In-depth trading ideas
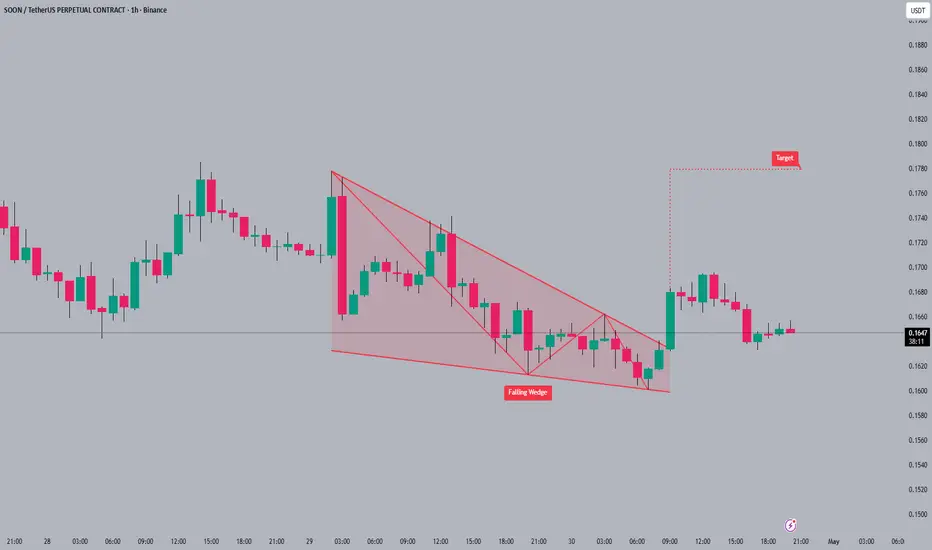
SOONUSDT Technical Analysis & Trade SetupSIX:SOON is nearing the trend of the descending resistance line, following the creation of a solid recovery off the support. The setup is developing a bullish appearance, buyers keep defending the higher low.
A confirmation breakout of the resistance line could cause an intense upward movement to $0.22- $0.27.As long as price stays above the $0.168 support level the bulls are winning.
Trade Setup:
Entry: Current Price / Breaking through the resistance
Take Profit: $0.203 - $0.226 - $0.274
Stop Loss: Under $0.168
DYOR, NFA
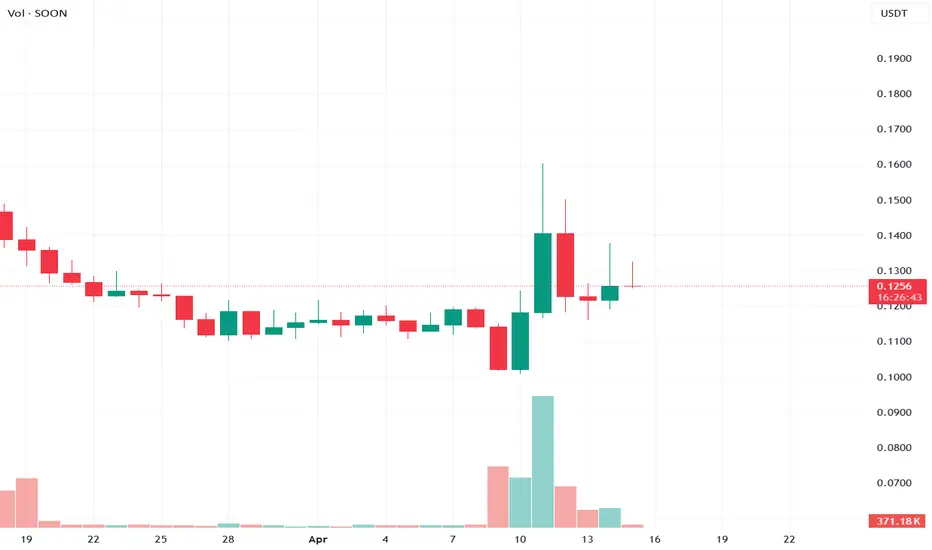
SOONUSDT - Moderate BullSOONUSDT at 0.1260, spot and futures perfectly pegged with zero basis. Spot volume 4.97M against futures 65.77M, Fut Lean with S/F dollar ratio 8.29M futures versus 625.82K spot — futures are running 13x spot in dollar terms, a significant imbalance that flags synthetic demand. Moderate Bull 21.37% at 1.54x, Clarity 46.43% — weak edge, low conviction.
Signal board 36 green to 16 red out of 112. C>T 7:7 dead split, no directional edge. EMA 5:1, Candle 14:0, Ichi TK 4:8 bearish. DD/SS 0:3 — three distribution signals, zero demand. Engulf 2:0, 3Sold 2:0, Star 2:0, Pat Tot 4:0. Squeeze HIGH at 11 bars, BW:25.04% Normal, Mom Bull — compression is elevated but bandwidth is wider than other setups, meaning the coil is less tight. MeanZ 1.09σ Rise is notable — the mean is rising, a positive structural signal. StdDev 5.843% Volatile. Cascade Normal. Prem 0% Neutral, Yield 0% Neutral — no basis signal whatsoever.
Spot Z -0.56 Quiet, Futures Z -0.30 Steady, Combined -0.32 Steady. SpotZ 0:5 sequence -0.56 to 0.04 to -0.6 Decel — spot had a brief volume spike and immediately decelerated, the single green candle on chart confirmed. Bull:Bear Z -0.15 to -0.3 Neutral. OBV Z 0.03 Drift up — barely above zero, the drift tick is the only positive volume intelligence signal. S.Mom Exp down 231.6% Loosening — momentum expanded to the downside and is now loosening, which can precede a directional break either way.
Leverage 13.24x rising, High. Percentile 29.3% Lower. AT Max 43.14x at 150 bars ago, AT Min 0.83x at 313 bars. Price at 0.5% Bottom — essentially the all-time price low on this chart. Retrace -21.3% Deep, Bounce 25% at 1.2x Bal.
The honest read: price is at its absolute floor at 0.5% Bottom, leverage is elevated at 13.24x High and rising, and futures are running 13x spot dollar volume — this is a futures-driven price at the bottom, not organic spot accumulation. The single OBV drift tick and MeanZ rise are encouraging micro-signals but the volume spike already decelerated, C>T is split, and Ichi TK is bearish. Fut Lean regime means the bid here is synthetic. Without spot dollar volume confirming and OBV Z building above 0.3, any bounce from this level is a leverage-driven short cover, not a real reversal. Watch for spot volume to match futures before committing.
Is That Crypto Pump Real? Data Says No. Here's Why.
Stop Losing Money to Fake Volume. Find Real Moves Now.
Trade the REAL Crypto Volume. Stop Getting Faked Out.
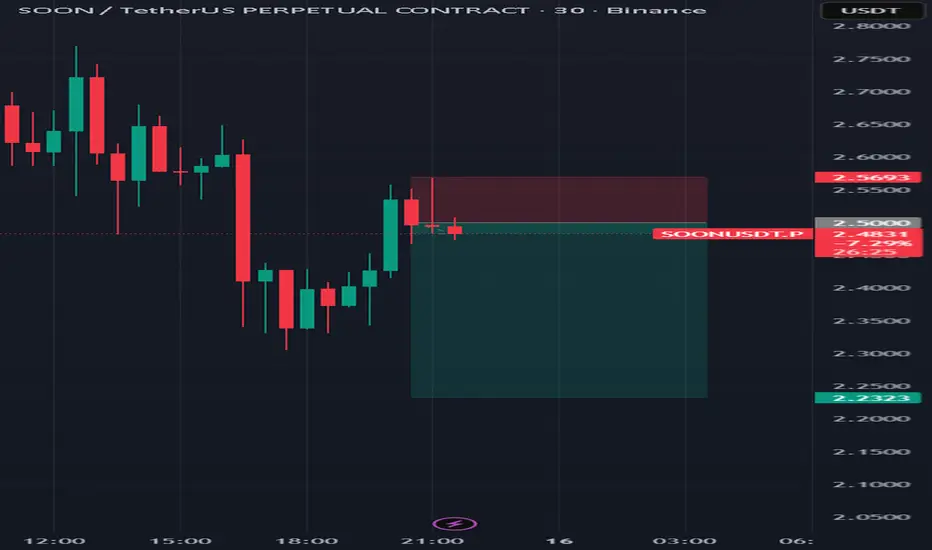
SOONUSDT.P: short setup from daily support at 1.933BINANCE:SOONUSDT.P is currently in a decline following a pump.
I wouldn’t call it a correction — it’s more likely a typical dump that usually follows sharp upward moves.
There’s a clearly confirmed support level and several hours of consolidation forming just above it.
This indicates that long positions are being exited, as each local high is lower than the previous one.
Expecting a short continuation in the near term.
Key factors for this scenario:
Asset decoupled from the market (relative strength/weakness vs. BTC)
Liquidity grab (false move against the trend)
Volatility contraction on approach
Immediate retest
No reaction after a false break
Closing near the bar's extreme
Was this analysis helpful? Leave your thoughts in the comments and follow to see more.
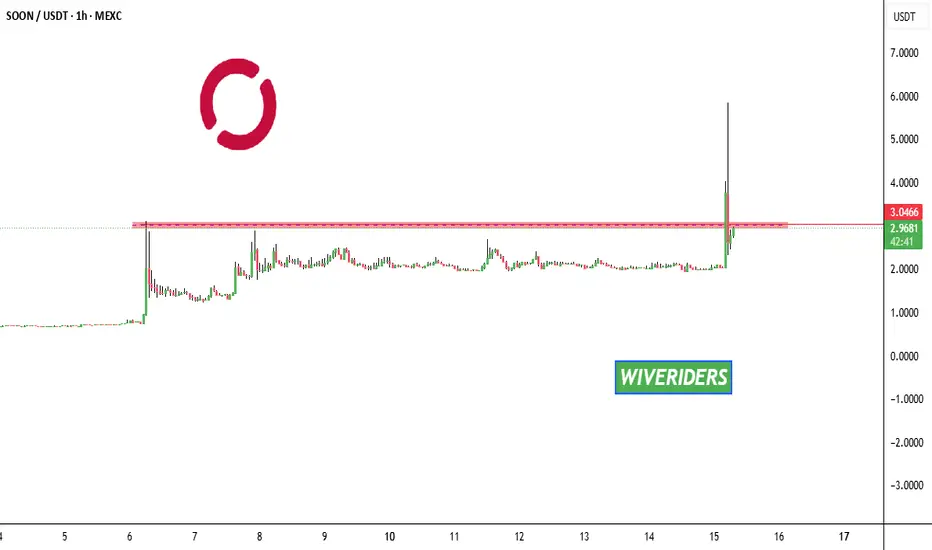
Higher SOONSOONUSDT is resting on support and momentum is still bullish on multiple timeframes. BTC.D appears to be bearish which would indicate money is rotating from BTC to Altcoins.
An object in motion will stay in motion until acted on by an outside force. TP1, about $3.13, is the area where resistance could cause price to halt. If it gains acceptance above there TP2, $8.32, is where price would try to reach next.
RR: 4.6:1 @ TP1, 30:1 @ TP2
#SOON price analysisThe recent attention on #SOON may look tempting, but caution is key.
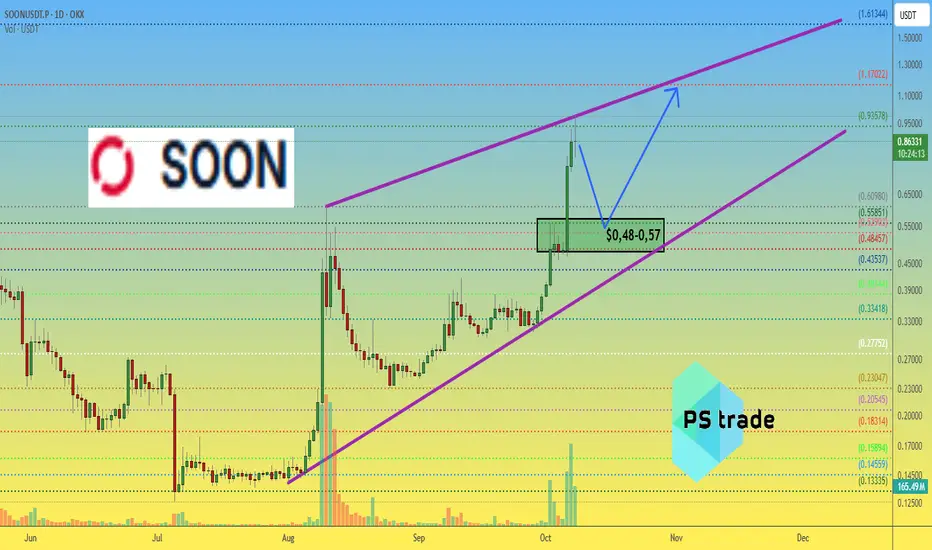
On the daily timeframe of OKX:SOONUSDT.P , a reversal pattern appears to be forming.
Over the next 7–10 days, we’ll see whether buyers can maintain the price between $0.48–$0.57.
If that range holds — a potential 2x growth opportunity may emerge in the mid-term.
Always assess risk before entering.
______________
◆ Follow us ❤️ for daily crypto insights & updates!
🚀 Don’t miss out on important market moves
🧠 DYOR | This is not financial advice, just thinking out loud
SOON/USDTKey Level Zone: 0.33500 - 0.34000
LMT v2.0 detected.
The setup looks promising—price previously trended upward with rising volume and momentum, then retested this zone cleanly. This presents an excellent reward-to-risk opportunity if momentum continues to align.
Introducing LMT (Levels & Momentum Trading)
- Over the past 3 years, I’ve refined my approach to focus more sharply on the single most important element in any trade: the KEY LEVEL.
- While HMT (High Momentum Trading) served me well—combining trend, momentum, volume, and structure across multiple timeframes—I realized that consistently identifying and respecting these critical price zones is what truly separates good trades from great ones.
- That insight led to the evolution of HMT into LMT – Levels & Momentum Trading.
Why the Change? (From HMT to LMT)
Switching from High Momentum Trading (HMT) to Levels & Momentum Trading (LMT) improves precision, risk control, and confidence by:
- Clearer Entries & Stops: Defined key levels make it easier to plan entries, stop-losses, and position sizing—no more guesswork.
- Better Signal Quality: Momentum is now always checked against a support or resistance zone—if it aligns, it's a stronger setup.
- Improved Reward-to-Risk: All trades are anchored to key levels, making it easier to calculate and manage risk effectively.
- Stronger Confidence: With clear invalidation points beyond key levels, it's easier to trust the plan and stay disciplined—even in tough markets.
Whenever I share a signal, it’s because:
- A high‐probability key level has been identified on a higher timeframe.
- Lower‐timeframe momentum, market structure and volume suggest continuation or reversal is imminent.
- The reward‐to‐risk (based on that key level) meets my criteria for a disciplined entry.
***Please note that conducting a comprehensive analysis on a single timeframe chart can be quite challenging and sometimes confusing. I appreciate your understanding of the effort involved.
Important Note: The Role of Key Levels
- Holding a key level zone: If price respects the key level zone, momentum often carries the trend in the expected direction. That’s when we look to enter, with stop-loss placed just beyond the zone with some buffer.
- Breaking a key level zone: A definitive break signals a potential stop‐out for trend traders. For reversal traders, it’s a cue to consider switching direction—price often retests broken zones as new support or resistance.
My Trading Rules (Unchanged)
Risk Management
- Maximum risk per trade: 2.5%
- Leverage: 5x
Exit Strategy / Profit Taking
- Sell at least 70% on the 3rd wave up (LTF Wave 5).
- Typically sell 50% during a high‐volume spike.
- Move stop‐loss to breakeven once the trade achieves a 1.5:1 R:R.
- Exit at breakeven if momentum fades or divergence appears.
The market is highly dynamic and constantly changing. LMT signals and target profit (TP) levels are based on the current price and movement, but market conditions can shift instantly, so it is crucial to remain adaptable and follow the market's movement.
If you find this signal/analysis meaningful, kindly like and share it.
Thank you for your support~
Sharing this with love!
From HMT to LMT: A Brief Version History
HM Signal :
Date: 17/08/2023
- Early concept identifying high momentum pullbacks within strong uptrends
- Triggered after a prior wave up with rising volume and momentum
- Focused on healthy retracements into support for optimal reward-to-risk setups
HMT v1.0:
Date: 18/10/2024
- Initial release of the High Momentum Trading framework
- Combined multi-timeframe trend, volume, and momentum analysis.
- Focused on identifying strong trending moves high momentum
HMT v2.0:
Date: 17/12/2024
- Major update to the Momentum indicator
- Reduced false signals from inaccurate momentum detection
- New screener with improved accuracy and fewer signals
HMT v3.0:
Date: 23/12/2024
- Added liquidity factor to enhance trend continuation
- Improved potential for momentum-based plays
- Increased winning probability by reducing entries during peaks
HMT v3.1:
Date: 31/12/2024
- Enhanced entry confirmation for improved reward-to-risk ratios
HMT v4.0:
Date: 05/01/2025
- Incorporated buying and selling pressure in lower timeframes to enhance the probability of trending moves while optimizing entry timing and scaling
HMT v4.1:
Date: 06/01/2025
- Enhanced take-profit (TP) target by incorporating market structure analysis
HMT v5 :
Date: 23/01/2025
- Refined wave analysis for trending conditions
- Incorporated lower timeframe (LTF) momentum to strengthen trend reliability
- Re-aligned and re-balanced entry conditions for improved accuracy
HMT v6 :
Date : 15/02/2025
- Integrated strong accumulation activity into in-depth wave analysis
HMT v7 :
Date : 20/03/2025
- Refined wave analysis along with accumulation and market sentiment
HMT v8 :
Date : 16/04/2025
- Fully restructured strategy logic
HMT v8.1 :
Date : 18/04/2025
- Refined Take Profit (TP) logic to be more conservative for improved win consistency
LMT v1.0 :
Date : 06/06/2025
- Rebranded to emphasize key levels + momentum as the core framework
LMT v2.0
Date: 11/06/2025
- Fully restructured lower timeframe (LTF) momentum logic
SOON/USDT - back to 0.5$ zone For the past two weeks, SOON/USDT was consolidating in a sloppy downtrend within a tight range, shaking out weak hands through a liquidity sweep and bear trap. That trap has now been confirmed, with price delivering a successful breakout from the range.
The plan now is to look for DCA entries inside the green box , which offers the most favorable risk/reward positioning. From there, the upside potential targets the $0.47 – $0.50 zone, a key major resistance level.
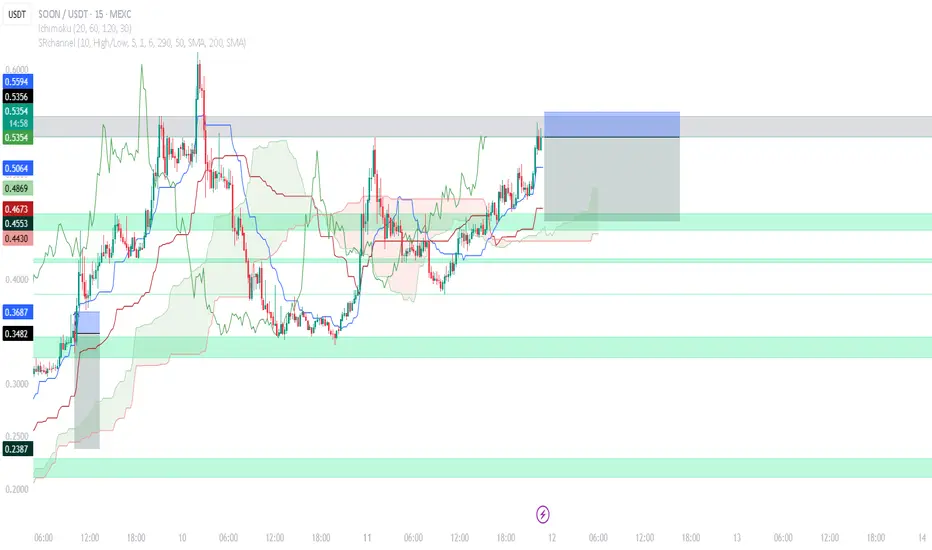
Shorting SOON/USDT at Major Supply ZonePrice has pushed into a well-defined supply zone between 0.5296–0.5336, an area that’s triggered strong rejections in the past. Despite current bullish momentum above the Ichimoku cloud, this setup looks for a countertrend reversal as late buyers get trapped. Stop is placed just above the supply zone to protect against a breakout, while the target is set at the 0.4673–0.4869 demand zone, offering roughly a 2:1 risk-to-reward. This trade banks on supply holding and momentum shifting back to the downside.
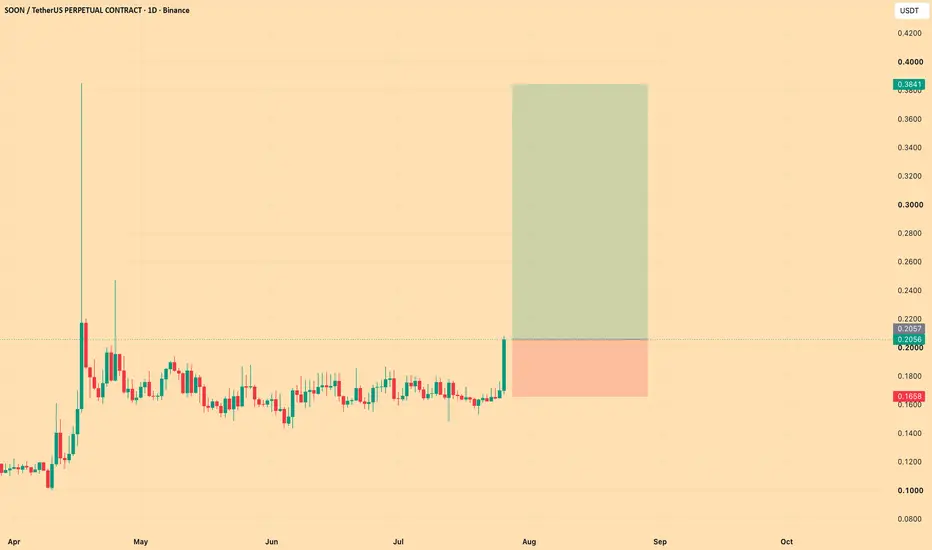
Soon/USDT short setupAfter a strong +200% rally from the bottom, momentum is starting to fade as price action shows early signs of exhaustion. A 30–40% corrective move is likely in play, providing a healthy reset before the next impulsive leg. Watching for a retracement into key support zones to confirm buyer re-entry and continuation of the broader bullish trend.
SOON/USDT -its mean soon bull start SOON/USDT on July 5 likely completed its final shakeout a classic liquidity grab and cleanout move before a potential reversal. The price is showing early signs of strength around the current zone, indicating the possibility of a trend shift.
I plan to DCA from current market price down to $0.128, identifying this as a strong accumulation area. Targeting a potential move towards the $0.31 zone, offering a solid risk-to-reward setup if the reversal unfolds as expected.
SOONUSDT → The coin that gets killed...BINANCE:SOONUSDT.P is under pressure. The coin looks extremely weak against the backdrop of a bullish market, with key support ahead, separating traders from the panic zone and a sharp decline
This coin is being killed. The price is gradually consolidating and compressing before support - the trigger is 0.2332. Against the backdrop of the overall decline that the market has experienced after a slight impulse from 0.2332, shocks are forming with the aim of capturing liquidity (red check marks). This generally indicates that large players are gathering a bearish position. A breakout of the risk zone will trigger panic and distribution.
Against the backdrop of growth in Bitcoin and the top 10 cryptocurrencies (bull market), the SOON coin is gradually declining and contracting towards key support, which could be broken accompanied by strong sell-offs.
Resistance levels: 0.2478, 0.25777
Support levels: 0.2332
If the coin continues to contract towards the 0.2332 support and form a pre-breakdown consolidation, there will be little chance of survival. In the short and medium term, I expect prices to fall.
Best regards, R. Linda!
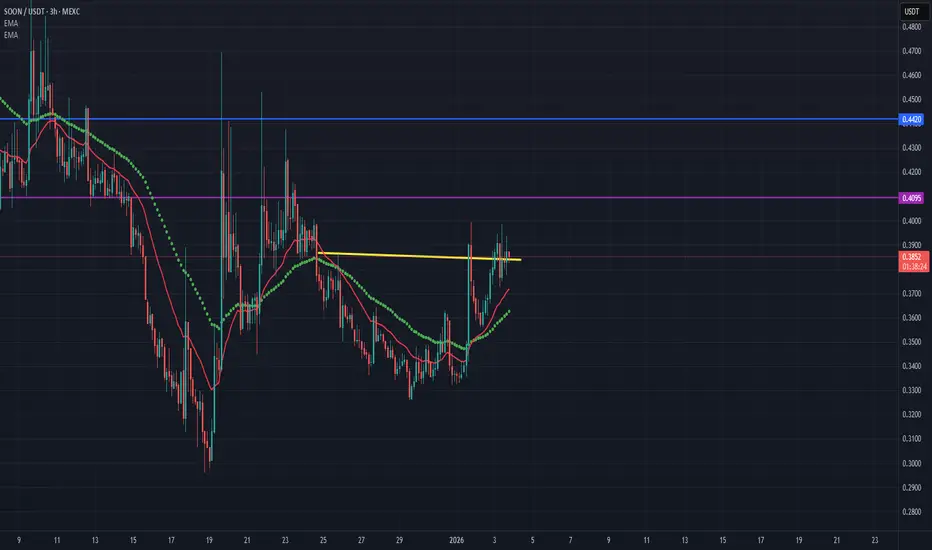
$SOON Volatility Spikes: Watch the $0.38 LevelSIX:SOON ’s drop to $0.387 follows a 62% crash, with high volatility signaled by a wide Bollinger Band spread. Support at $0.38 is critical; a break could hit $0.35, while a bounce might test $0.42. Short-term traders, stay cautious as FOMO cools. #SOON #CryptoVolatility
$SOON Faces Resistance at $0.42SIX:SOON ’s current price of $0.387 is struggling to break the $0.42 resistance level. The 1-hour chart shows a bearish wedge forming, suggesting a potential drop to $0.37 unless buying volume surges. Short-term traders, set stop-losses below $0.38! #SOON #TradingSignals