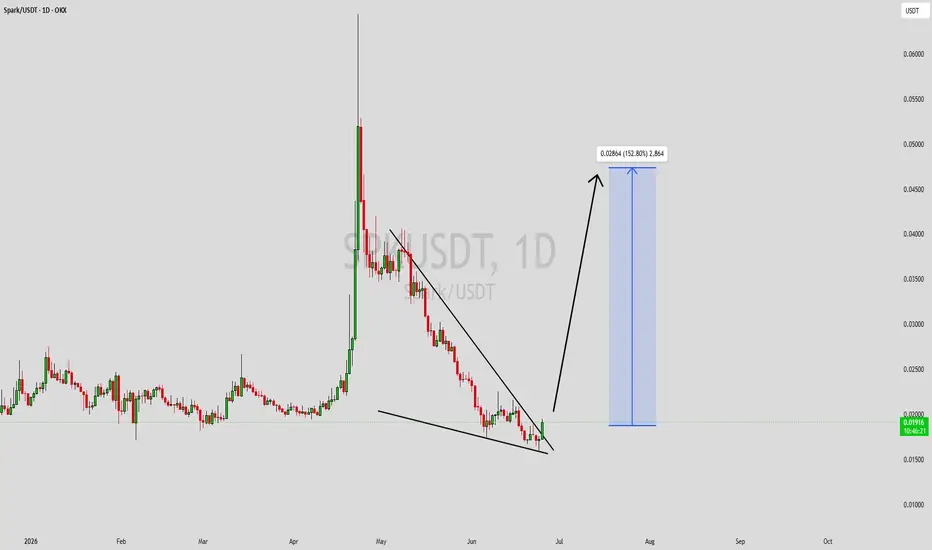
SPKUSDT Forming Falling WedgeSPKUSDT is forming a clear falling wedge pattern, a classic bullish wave signal that often indicates an upcoming breakout. The price has been consolidating within a narrowing range, suggesting that selling pressure is weakening while buyers are beginning to regain control. With consistent volume confirming accumulation at lower levels, the setup hints at a potential bullish breakout soon. The projected move could lead to an impressive gain of around 140% to 150% once the price breaks above the wedge resistance.
This falling wedge pattern is typically seen at the end of downtrends or corrective phases, and it represents a potential shift in market sentiment from bearish to bullish. Traders closely watching SPKUSDT are noting the strengthening momentum as it nears a breakout zone. Strong trading volume adds confidence to this pattern, showing that market participants are positioning early in anticipation of a reversal.
Investors’ growing interest in SPKUSDT reflects rising confidence in the project's long-term fundamentals and current technical strength. If the breakout confirms with sustained volume, this could mark the start of a fresh bullish leg. The current price structure suggests that buyers are gradually taking control while bearish pressure continues to weaken.
Traders might find this a valuable setup for medium-term gains, especially as the falling wedge pattern nears completion and buying momentum accelerates. A successful breakout could attract additional market attention and potentially drive the price toward significantly higher levels over the coming weeks.
✅ Show your support by hitting the like button!
✅ Leave a comment below! (What is your opinion about this coin?)
Your feedback and engagement keep me inspired to share more insightful market analysis with you!
SPK / TetherUS PERPETUAL CONTRACT
No trades
No trades
In-depth trading ideas
SPKUSDT 1D#SPK is breaking out above the descending resistance on the daily chart, but the daily candle has not closed yet and it is currently facing a heavy resistance zone. The overall structure looks promising, so keep an eye on it.
In case of a confirmed breakout above the resistance zone, the potential upside targets are:
🎯 $0.023415
🎯 $0.027298
🎯 $0.030437
🎯 $0.033575
🎯 $0.038043
🎯 $0.043735
⚠️ Always remember to use a tight stop-loss and maintain proper risk management.
SPKWe're greed, so we want to "Takeprofits" wider than "Stoplosses".
Thats a common behavior - to set TP's bigger than SL's, every "trading for beginners" book tells us about it *. But in the long run, what will this trading model lead to?
* Cut the losses, lets the profit run. Trend is your friend. Follow the white rabbit and so on, "azbuka" on russian. But how profitable the model is?
SPKUSDT Forming Bullish MomentumSPKUSDT is forming a clear bullish momentum pattern, a classic bullish reversal signal that often indicates an upcoming breakout. The price has been consolidating within a narrowing range, suggesting that selling pressure is weakening while buyers are beginning to regain control. With consistent volume confirming accumulation at lower levels, the setup hints at a potential bullish breakout soon. The projected move could lead to an impressive gain of around 80% to 90% once the price breaks above the wedge resistance.
This bullish momentum pattern is typically seen at the end of downtrends or corrective phases, and it represents a potential shift in market sentiment from bearish to bullish. Traders closely watching SPKUSDT are noting the strengthening momentum as it nears a breakout zone. The good trading volume adds confidence to this pattern, showing that market participants are positioning early in anticipation of a reversal.
Investors’ growing interest in SPKUSDT reflects rising confidence in the project’s long-term fundamentals and current technical strength. If the breakout confirms with sustained volume, this could mark the start of a fresh bullish leg. Traders might find this a valuable setup for medium-term gains, especially as the pattern completes and buying momentum accelerates.
✅ Show your support by hitting the like button and
✅ Leaving a comment below! (What is your opinion about this Coin?)
Your feedback and engagement keep me inspired to share more insightful market analysis with you!
SPKUSDT Forming Falling WedgeThis falling wedge pattern indicates a possible change in market sentiment from bearish to bullish and is usually observed after the conclusion of downtrends or corrective phases. As SPKUSDT approaches a breakout zone, traders keeping a careful eye on it are observing the growing momentum. This pattern is strengthened by the high trading volume, which indicates that market players are positioning early in expectation of a reversal.
increased trust in the project's long-term fundamentals and present technical strength is reflected in investors' increased interest in SPKUSDT. A new bullish run may begin if the breakout is confirmed with consistent volume. When the wedge formation finishes and buying momentum picks up speed, traders may find this to be a useful setup for medium-term gains.
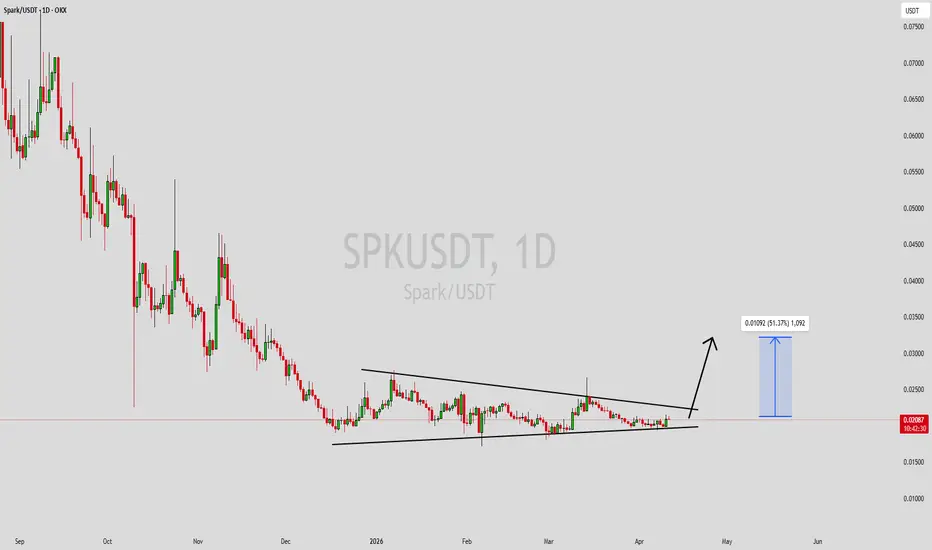
SPKUSDT Forming Falling WedgeSPKUSDT is forming a clear falling wedge pattern, a classic bullish reversal signal that often indicates an upcoming breakout. The price has been consolidating within a narrowing range, suggesting that selling pressure is weakening while buyers are beginning to regain control. With consistent volume confirming accumulation at lower levels, the setup hints at a potential bullish breakout soon. The projected move could lead to an impressive gain of around 40% to 50% once the price breaks above the wedge resistance.
This falling wedge pattern is typically seen at the end of downtrends or corrective phases, and it represents a potential shift in market sentiment from bearish to bullish. Traders closely watching SPKUSDT are noting the strengthening momentum as it nears a breakout zone. The good trading volume adds confidence to this pattern, showing that market participants are positioning early in anticipation of a reversal.
Investors’ growing interest in SPKUSDT reflects rising confidence in the project’s long-term fundamentals and current technical strength. If the breakout confirms with sustained volume, this could mark the start of a fresh bullish leg. Traders might find this a valuable setup for medium-term gains, especially as the wedge pattern completes and buying momentum accelerates.
✅ Show your support by hitting the like button and
✅ Leaving a comment below! (What is your opinion about this Coin?)
Your feedback and engagement keep me inspired to share more insightful market analysis with you!
SPKUSDT UPDATE#SPK
UPDATE
SPK Technical Setup
Pattern: Falling Wedge Pattern
Current Price: 0.02453$
Target Price: 0.05150$
Target % Gain: 120.47%
Technical Analysis: SPK has broken out of a well-defined falling wedge on the 1D timeframe, signaling a bullish reversal after a prolonged downtrend. Price has reclaimed the descending resistance trendline and is holding above the breakout zone, indicating strength from buyers. The projected move is based on the wedge height, targeting the 0.050–0.052$ resistance region, which also aligns with prior supply levels. A successful retest of the breakout area would further validate continuation toward the target.
Time Frame: 1D
Risk Management Tip: Always use proper risk management.
SPKUSDT UPDATESPK
UPDATE
SPK Technical Setup
Pattern: Falling Wedge Pattern
Current Price: $0.0226
Target Price: $0.05500
Target % Gain: 165.81%
Technical Analysis: SPK is forming a falling wedge pattern on the 1D chart, indicating bullish potential if the resistance trendline is decisively broken. Current price action shows the token holding above recent support areas with potential for upside continuation if volume expands. A confirmed breakout above the wedge with rising momentum could validate the projected move toward the $0.05500 target zone, aligning with the pattern’s measured move expectation.
Time Frame: 1D
Risk Management Tip: Always use proper risk management.
SPK/USDT — Price at Critical Support: Breakdown or Reversal?SPK/USDT on the daily timeframe (1D) remains in a clear downtrend (bearish trend) since the peak around 0.19 USDT. Price continues to form lower highs and lower lows, indicating strong seller dominance. Currently, price is trading near a major historical support zone, which may act as a key technical reaction area.
---
Pattern & Price Structure
Descending Channel / Modified Falling Wedge
Price is moving within a broad descending channel, characterized by:
Upper line: dynamic resistance (descending trendline)
Lower line: medium-term dynamic support
This structure represents a bearish continuation pattern, although a potential reversal could occur if price breaks above the upper trendline with strong confirmation and volume.
---
Key Levels
Support:
0.0220 – 0.0210 (current support / demand area)
0.0189 (historical low / extreme support)
Resistance:
0.0295
0.0320
0.0350
0.0455 (strong resistance / supply zone)
---
Bullish Scenario
Price holds above the 0.021 – 0.022 area and forms:
higher low
bullish engulfing / strong rejection candle
A valid breakout above the descending trendline
Upside targets:
0.0295
0.0320
0.0350
Extension: 0.0455
This scenario would indicate a relief rally or the early stage of a recovery phase.
---
Bearish Scenario
Price fails to hold above the 0.021 area
Strong daily candle close below support
Further downside potential toward:
0.0189
If broken, risk of bearish price discovery (new lows)
This scenario confirms bearish continuation with sustained seller control.
---
Conclusion
SPK/USDT remains in a medium-term bearish phase, but price is currently sitting at a critical decision zone. This area will determine whether the market experiences a technical rebound or continues its downward expansion. Clear breakout or breakdown confirmation is essential before taking any trading decision.
---
#SPKUSDT #SPK #CryptoAnalysis #TechnicalAnalysis #Altcoin #DescendingChannel #BearishTrend #BullishReversal #SupportResistance
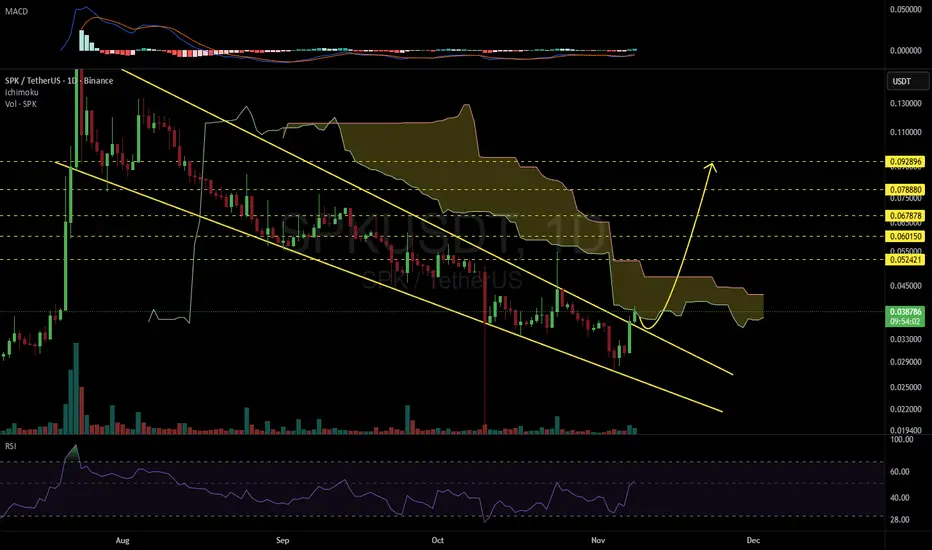
SPKUSDT 1D#SPK has broken above the falling wedge pattern on the daily chart and is now facing resistance from the Ichimoku cloud. In case of a breakout above this level, the potential upside targets are:
🎯 $0.052421
🎯 $0.060150
🎯 $0.067878
🎯 $0.078880
🎯 $0.092896
⚠️ Always remember to use a tight stop-loss and maintain proper risk management.
SPK/USDT – Final Pressure Before a Major Breakout?The market is watching SPK/USDT closely as it approaches a make-or-break zone.
After months of steady decline under a well-defined downtrend line, price is now testing the critical demand zone at 0.034–0.030 — the same level that previously triggered a massive rally earlier this year.
The current structure hints at a potential shift in momentum, but failure to hold this area could invite a deeper sell-off.
---
Pattern & Technical Structure
SPK is shaping a descending wedge / descending triangle pattern — a classic formation that often precedes a trend reversal when sellers lose steam and buyers begin to accumulate around a key support area.
The 0.034–0.030 zone acts as a strong defensive wall.
If this zone holds and price breaks above the yellow downtrend line, it could signal the start of a medium-term bullish reversal.
However, a clean break below this level would confirm bearish continuation, likely driving price down toward the 0.0225 support zone.
---
🟢 Bullish Scenario
A daily candle close above the downtrend line confirms a momentum shift.
Breakout must be supported by increasing volume for validation.
Upside targets:
0.0465 → first key resistance
0.0565 → confirmation of a trend reversal
0.0885 → extended bullish target if sentiment strengthens
Watch for the formation of a higher low post-breakout — a reliable sign of a structural reversal.
---
🔴 Bearish Scenario
A daily close below 0.030 confirms bearish dominance.
Potential for accelerated drop toward 0.0225 (previous major low).
If breakdown occurs on high volume, it may signal the final phase of capitulation before a deeper accumulation phase.
---
💡 Market Outlook & Sentiment
SPK is standing at a major inflection point.
The 0.034–0.030 zone is not just a support range — it’s a battlefield between accumulation and continuation.
A breakout above the trendline would ignite a new chapter in SPK’s price structure, while a breakdown could extend its bearish cycle into year-end.
Smart traders will wait for daily candle + volume confirmation, not emotional reactions.
The next decisive move here could define the market direction for months ahead.
---
🎯 Key Technical Levels
Main Support: 0.034 – 0.030
Next Support: 0.0225
Immediate Resistance: 0.0465
Major Resistances: 0.0565 / 0.0885 / 0.1250
---
🧭 Market Perspective
Although SPK remains within a downtrend, the slowing bearish momentum near this demand zone might indicate early accumulation by smart money.
If a breakout occurs, expect a possible short squeeze rally toward 0.05–0.06 as short positions unwind above the descending trendline.
---
#SPK #SPKUSDT #CryptoAnalysis #Breakout #Downtrend #TechnicalAnalysis #PriceAction #AltcoinSetup #CryptoTrading #ReversalZone #SupportResistance
What Happened to SPK?SPK’s Binance HODLer airdrop distributed 200M tokens (2% of total supply) to users who staked BNB between June 10–14. Recipients immediately sold ~300M SPK ($18M at peak prices), overwhelming demand. With 17% of supply circulating at launch, the sell-off triggered a liquidity crisis on exchanges like Bybit, where order books lacked depth to cushion the drop. This mirrors historical airdrop failures (Arbitrum, Starknet), where tokenomics prioritized short-term rewards over sustainable demand 👀
SPKUSDT UPDATE#SPK
UPDATE
SPK Technical Setup
Pattern: Bullish falling wedge breakout
Current Price: $0.1220
Target Price: $0.2870
Target % Gain: 135.82%
INDEX:SPK is breaking out of a falling wedge pattern on the 1D timeframe. The breakout signals strong bullish momentum with structure favoring continuation toward $0.2870, offering over 135% potential upside. Always use proper risk management.
SPKUSDT 1D#SPK is moving inside a falling wedge pattern on the daily chart. Enter this coin only after a clean breakout above the wedge resistance. The potential targets are:
🎯 $0.063654
🎯 $0.075669
🎯 $0.085380
🎯 $0.095091
🎯 $0.108916
🎯 $0.126527
⚠️ Always remember to use a tight stop-loss and follow proper risk management.
Spark SPK price analysisThis day has come and a new trend-narrative is emerging ?
Instead of memecoins on CRYPTOCAP:SOL , projects from the CRYPTOCAP:ETH ecosystem will now shooting ?)
The #SPK coin has made + 550% in less than 10 days
and the capitalization of the #Spark project is "only" $150 million.
We personally do not feel comfortable buying at the current price of OKX:SPKUSDT
At $0.045-0.055 it would be much more comfortable
But it's definitely worth watching, maybe this narrative will be the same "money" button in the future ?)
What do you think?
SPKUSDT Forming Bullish MomentumSPKUSDT is currently trading at a key support zone after a sharp correction, and this consolidation phase is creating a strong base for the next potential move. The chart suggests that the price has respected historical demand levels, which could trigger a powerful bullish rally once buyers regain control. With strong buying interest starting to build up, SPKUSDT has the potential to deliver an impressive 190% to 200%+ gain if momentum continues to align with technical signals.
The current setup reflects a classic accumulation pattern where smart money enters at discounted levels before the next breakout. Volume remains healthy, further supporting the possibility of an upside move. Once the price begins to lift from this support region, the momentum could accelerate quickly, pushing SPKUSDT towards higher resistance levels that align with its projected targets.
Investor confidence is growing around this project, and with the broader crypto market showing signs of recovery, SPKUSDT stands out as one of the coins with significant short-term growth potential. If the price successfully breaks above the consolidation zone with strength, it could trigger a wave of buying that drives the pair toward its next major resistance, making this a strong opportunity for bullish traders.
✅ Show your support by hitting the like button and
✅ Leaving a comment below! (What is You opinion about this Coin)
Your feedback and engagement keep me inspired to share more insightful market analysis with you!
SPK Market Update📊 INDEX:SPK Market Update
INDEX:SPK is now testing the red resistance zone 🔴 and showing signs of a potential Double Bottom pattern forming 📈
👉 If buyers achieve a confirmed breakout above resistance, this would validate the pattern and signal a bullish continuation ✅
⚠️ Until then, sellers may still defend this zone, so wait for clear confirmation before entering.
Spark · Corrections, Retraces, Sideways & Bull MarketSpark just entered the bearish zone but is having a reaction. On this chart we have a full 0.786 retracement. The action just moved below. SPKUSDT daily.
There was some volume 25-Aug, higher than average; then today again we are seeing a market reaction as a new low is hit after the late July major advance. Support will be found and established soon.
SPKUSDT can go sideways a little bit while forming the bottom. See the arrow working as cup pattern. In this sideways periods there are lots of price swings. New lows are possible or no new lows, makes no difference.
After the bullish wave there is a correction. After the correction the market consolidates, accumulation. The accumulation transitions into a new market phase, cycle or wave. Since SPKUSDT is already bullish, right now trading as a higher low compared to the last low, we can expect the market to resolve bullish once the accumulation phase is over.
As soon as support is hit, we can say the correction ends. There is always a period of sideways before a new wave of growth. In this type of chart setup, the sideways period can go for 1-3 months.
Namaste.