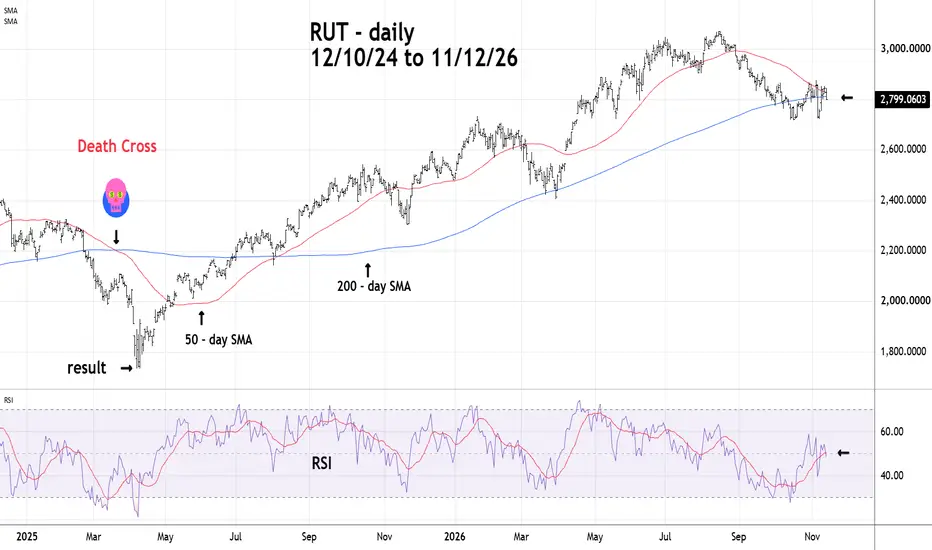
The Dreaded Death CrossA Death Cross occurs when the 50 - day Simple Moving Average (SMA) crosses below thew 200 - day SMA. The Russell 2000 (RUT) is on the verge of a Death Cross.
Note what happened at the prior Death Cross in 2025.
Daily RSI has crossed below its moving average line implying more downside action.
In-depth trading ideas
๏ปฟRUSSELL aggressive Bear Cycle to the 1M MA70 started.Russell 2000 (RUT) is sitting on its 1W MA50 (blue trend-line) having tested it last month for the first time since the week of March 30 2026, being on a strong 4-month correction since the 1M RSI got overbought. With the 1M RSI breaking below its MA (yellow trend-line) in September, the probabilities of a monthly closing below the 1W MA50, break have strengthened.
The reason is that since the 2009 market bottom of the U.S. Housing Crisis, Russell always targeted its 1M MA70 (red trend-line) af
Small caps vs large caps since 1988: a coin flip, 50.3%Small caps are said to move more than large caps, both ways. We measured the Russell 2000 against the S&P 500 week by week, from 1988 to 2025.
What we measured
TradingView weekly closes for the Russell 2000 and the S&P 500: 1,983 weeks. Both are price indices, without dividends, and the S&P's companies pay more of them.
What we found
Week to week it is a coin flip: the Russell beat the S&P in 50.3% of weeks, and every decade landed between 48% and 54%.
How far it moves changed. Before 2
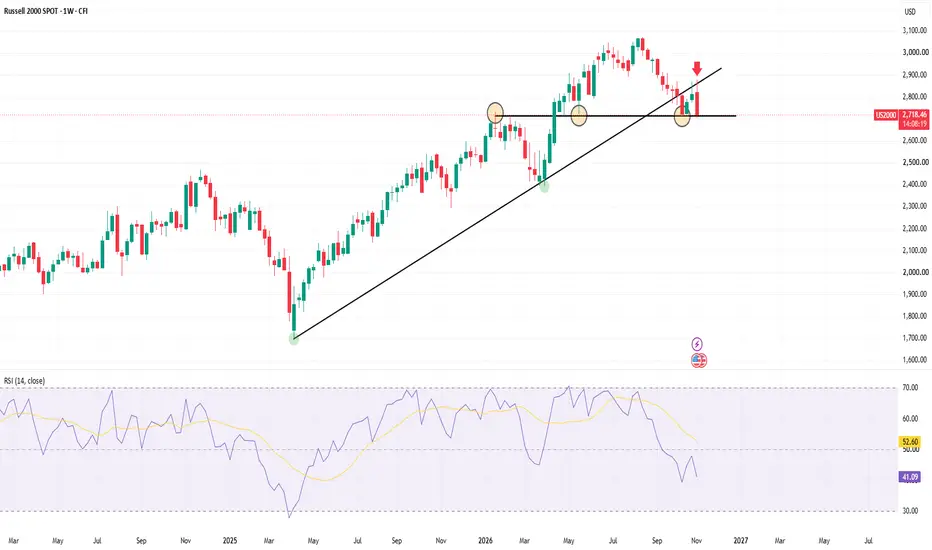
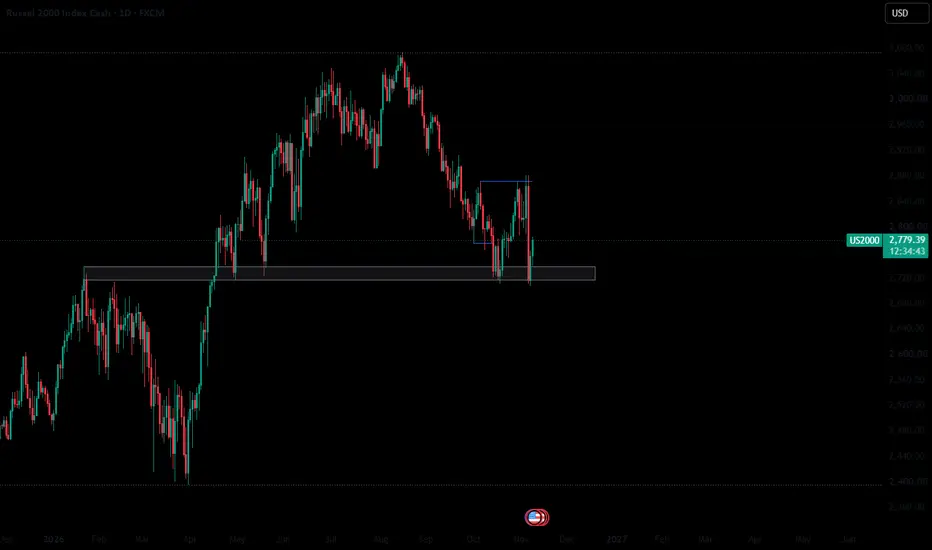
US2000 Index Tests Key Support Levels!Technical analysis of the US2000 index:
The Russell US2000 Index is currently trading near key support levels, and we will be watching how prices react to this area. The index recorded a sharp decline in yesterday's session, falling by 5.1% and settling near the 2,715 level. The support levels in question are located around 2,720. The technical significance of these levels can be summarized in the following key points:
This area previously acted as a resistance zone at the beginning of the
RUSSELL: Eyes the 1D MA100 and 2,500.Russell 2000 turned bearish on its 1D technical outlook (RSI = 39.218, MACD = -8.865, ADX = 24.707) as today's dramatic reversal crossed under its 1W MA50 again on one of the most brutal candles in recent history. The long term Channel Up now eyes the 1W MA100 for support, which has been untouched since June 2nd 2025. Short, TP = 2,500. The 1W RSI getting oversold (30.000), would be a strong buy opportunity.
## If you like our free content follow our profile to get more daily ideas. ##
## Co
us2000 LONGHTF bias is Bullish.
Market condition is in bearish retracement.
POI: Daily demand zone. Price has revisited the zone multiple times, including a sharp bearish penetration and recovery.
V06 execution plan
1. Wait for price to interact with the demand zone.
2. Observe liquidity events (sweep of local lows).
3. Look for bullish LTF displacement / CHoCH.
4. Wait for pullback into confirmation area.
5. Execute long only after confirmation.
6. If price breaks through demand zone, pause and reassess.
The Russell May Be RunningThe Russell 2000 small cap index had a big pullback in the late summer, but some traders could think itโs rising again.
The first pattern on todayโs chart is the January peak of 2,735. RUT bounced at that level in April and May before advancing to new highs. It held the same level after sliding between mid-August and mid-October. That may confirm old resistance has become new support.
Second, prices have recovered after testing below their 200-day simple moving average (SMA). Is the long-term
US2000: Small-Cap Breakout Reloaded? The 2970 Money Heist!๐ฅ US2000 / RUSSELL 2000 โ SMALL-CAP MONEY HEIST ๐ฅ
๐บ๐ธ US SMALL CAP 2000 | RUT | Index CFD
๐ Day Trade / Swing Trade Opportunity Guide
๐จ THIEF TRADER MISSION: BULLISH BREAKOUT + RETEST ๐จ
๐ฏ MY PLAN
Plan: Bullish scenario
Entry concept: Bullish breakout + retest confirmation
First Target: 2920
Main / Final Target: 2970
Thief SL: 2780
๐ POLICE FORCE BARRICADE AHEAD:
The 2920โ2970 zone is where I am watching for a potential resistance reaction. Price may become stretched/overbought into this area,
Russell 2000 (RTY) | Multi-Timeframe Market AnalysisOverall Bias: Bullish
Execution Bias: Intraday Long
Higher Timeframe Analysis
Monthly: The broader structure remains bullish, with price showing a strong rejection from the 10 EMA and holding above the 38.2% Fibonacci retracement. The next major upside objective is the previous monthly high, which aligns with a key structural flip zone.
Weekly: The previous weekly candle closed bullish and above the preceding candle's wick. This supports continuation towards the previous weekly high, where bu
RUSSELL MULTI TIME FRAME ANALYSISHigher-Timeframe Bias: Bullish
Monthly: Strong rejection from the 10 EMA; targeting the previous monthly high.
Weekly: Mixed structure, but major trend remains bullish with price holding above the 50 EMA.
Daily: Bullish break of structure, with price reacting from the 38.2% Fibonacci level.
4H: Bullish rejection above the 50 EMA; watching for continuation after a potential pullback.
Trading Plan:
A-Grade Setup: Buy after an impulsive move higher and a confirmed pullback.
Target: Previous mon
On the Brink of Collapse.I've been watching this index for quite some time now, waiting for an entry to go short. Imo, right now is the best moment. Why? Here are 3 main reasons:
1. The technical picture looks like perfect berish setup. This ETF did go up almost non-stop for over a year, at one point even outperforming both SPY and QQQ, but right now the situation could change drastically, and we are already seeing signs of this through outflows from this ETF. 2. Money is becoming very expensive. The latest inflation
Russell 2000 bounces off 2,716, can it clear 2,865?The Russell 2000 closed Wednesday at 2,830.51, up about 0.4% on the day, and was near 2,857 this morning. It is back over its 20-day average (2,789) and its 200-day average (2,803) but still under its 50-day average at 2,867. The low to protect is 2,716.23 from 16 Oct, which held when it was tested. The weekly chart is still a pullback, with the highs falling from 3,069.71 in mid August.
If it goes up (most likely, but only slightly). A daily close over 2,864.83, the 6 Oct high, would clear the
Russell 2000: Bullish Reversal Signals EmergeThe US Small Cap 2000 is showing early signs of a potential bullish reversal on the daily timeframe, following an extended decline within a well-defined descending channel. Recent price action has pushed above the channel's upper boundary and reclaimed the 200-day moving average, suggesting that bearish momentum may be transitioning into a recovery phase.
Descending Channel โ Early Breakout Signals
Since its August peak, the index has maintained a sequence of lower highs and lower lows within
US Russell 2000 CashUS Russell 2000 Cash
The Russell 2000 Index tracks a segment of the U.S. equity market focused on small-cap companies, offering insight into the performance of smaller businesses and broader domestic market sentiment.
From a technical perspective, the main priority is to assess market structure across multiple timeframes. Lower-timeframe price action can help identify potential turning points, but confirmation should come from a clear structural shift rather than simply reacting to a price lev
Russell Bulls Aren't Going Down Without a FightOne thing that stands out when looking at the Russell 2000 contract is that it's a market that likes to trend, often for lengthy periods.
The contract now sits immediately beneath downtrend resistance from the record high set in August, with the 200-day moving average and former uptrend from the April 2025 Liberation Day low also located overhead. Together, they form a significant resistance zone heading into a massive week for risk events, including the Fed meeting and major technology earning
US2000 Outlook: The Small-Cap Rotation Trade๐ฅ US2000 | RUSSELL 2000 โ SMALL-CAP MONEY HEIST BLUEPRINT ๐ฐ๐ต๏ธ
๐ Asset: US2000 โ Russell 2000 Index CFD
๐ฏ Trade Style: Day / Swing Trade Opportunity Guide
๐ Plan: Bullish Scenario
๐ง Method: Layered Buy-Limit Entry Strategy
โ๏ธ Thief Trader Blueprint: ENTER โ BUILD โ WATCH LIQUIDITY โ ESCAPE SMART
โโโโโโโโโโโโโโโโโโโโโโ
๐ฐ THE THIEF TRADER PLAN
๐ Layered Entry Zone:
2750 โ 2790
Instead of relying on one entry price, the plan uses multiple buy-limit layers across the selected zone.
The objectiv
Decision time at 2800The Russell 2000 contract finds itself in a clear short-term downtrend from its August highs, with the trendline now acting as resistance. At the same time, you've got a support zone comprising a long-running uptrend extending from the April 2025 lows, the 200-day simple moving average and horizontal support at 2,800, immediately underneath where it now trades.
With the price effectively wedged between these two opposing technical forces, it's decision time for Russell 2000 traders.
Looking at
RUSSELL cyclical correction to 2400 at least has begun.Russell 2000 (RUT) is about to test its 1W MA50 (blue trend-line) for the first time since the week of March 30 2026 following a strong 2-month pull-back after the 1M RSI got overbought. Now with the 1M RSI breaking below its MA (yellow trend-line), the probabilities of a 1W MA50 break-out for the first time since July 2025 have strengthened.
The reason is that since the 2009 market bottom of the U.S. Housing Crisis, Russell targeted its 1M MA70 (red trend-line) after a 1W MA50 bearish break-ou
The US2000 Index Continues Its Downward Trend!The attached chart highlights the importance of the support levels around 2,790 for the US2000 Index, where the index has held on two consecutive previous occasions. It also shows that the index has been moving within a short-term downward trend, declining from the 3,073 levels to its current levels around 2,800, particularly after falling 0.5% in yesterdayโs session.
The continued rise in bond yields to record levels, their highest in more than two decades, persistent inflation at elevated lev
US2000 Shows Signs of ReversalUS2000 has been consecutively forming Lower Lows and Lower Highs on the 1D timeframe, maintaining a clear bearish structure. However, while price is now forming another Lower Low, RSI is holding a Higher Low, creating a bullish divergence. This suggests that bearish momentum may be weakening despite continued downside price action, potentially signaling a recovery or bullish reversal is confirmed.
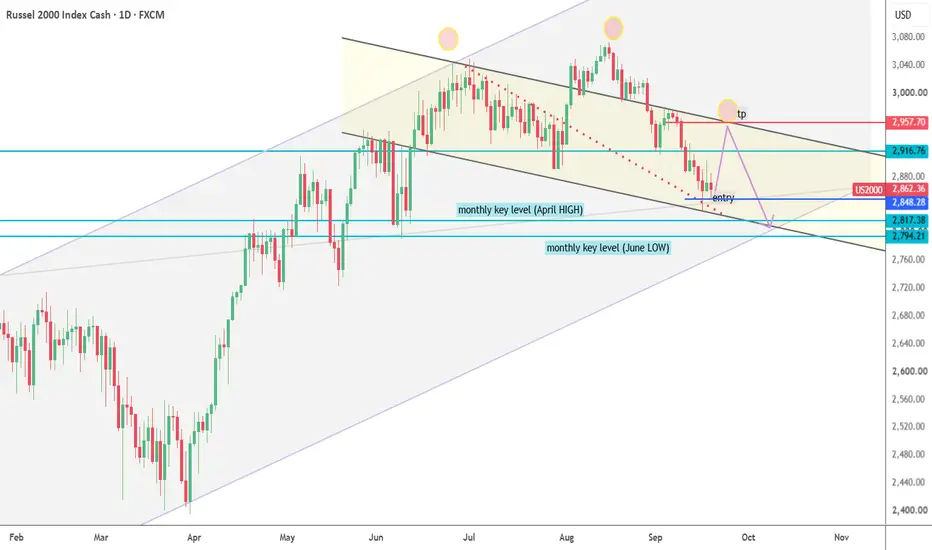
US2000--SHORTHigher-Timeframe Channel Rotation & Bearish Bias
--Price is currently rotating downward within a descending channel, moving from the upper boundary toward the lower boundary of a broader ascending structure.
-- Multi-timeframe analysis confirms sustained weakness, with recent candle closes below both the previous day's low and the previous month's low.
--Bearish continuation is expected, targeting the key monthly support level marked on the chart...
US Small Cap 2000 Index โ Bullish Setup Toward 3412US Small Cap 2000 Index โ Bullish Setup Toward 3412 ๐๐บ๐ธ
The US Small Cap 2000 Index is presenting a constructive bullish structure, with price action showing improving upside potential and renewed strength across the broader small-cap segment.
The current technical formation suggests that buyers are gradually gaining greater influence over the market. The structure is being assessed through price behavior, momentum development, and the broader directional pattern, with the 3412 level positione
US2000--LONG--CorrectionUS2000 โ Weekly Macro Channel & Head & Shoulders Retest
Higher-Timeframe Channel: US2000 has been respecting a gray ascending channel on the weekly chart (anchored from the 2025 low to the 2026 low, with the parallel upper boundary aligned with the 3rd week of 2026).
Market Structure: Price is currently retracing from the upper boundary toward the lower boundary of this channel, forming a Head & Shoulders pattern (pattern is clear on the daily or H4 timeframes)
Current Price Action: Following
RUSSELL: targeting its 1D MA200 in the next days.Russell 2000 turned bearish on its 1D technical outlook (RSI = 39.006, MACD = -28.020, ADX = 51.578) as it is extending a bearish wave since August 14th. The long term Channel Up is correcting and the last bearish wave hit the 1D MA200. Target that for a new LL (TP =2,780).
See how our prior idea has worked out:
## If you like our free content follow our profile to get more daily ideas. ##
## Comments and likes are greatly appreciated. ##