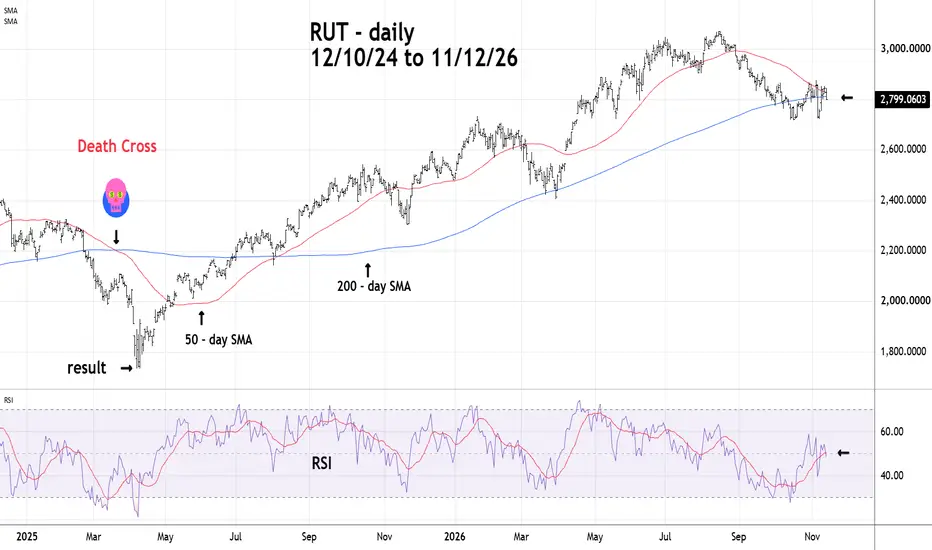
The Dreaded Death CrossA Death Cross occurs when the 50 - day Simple Moving Average (SMA) crosses below thew 200 - day SMA. The Russell 2000 (RUT) is on the verge of a Death Cross.
Note what happened at the prior Death Cross in 2025.
Daily RSI has crossed below its moving average line implying more downside action.
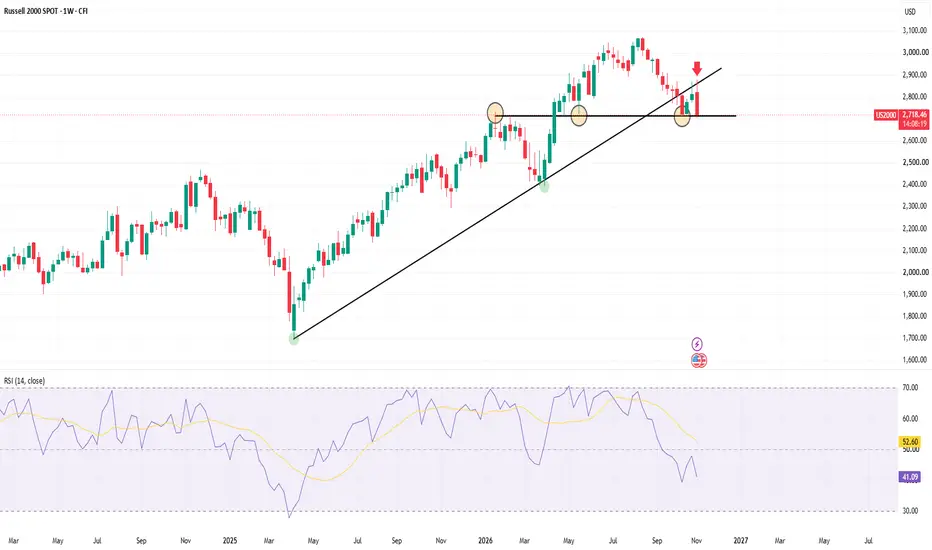
RUSSELL aggressive Bear Cycle to the 1M MA70 started.Russell 2000 (RUT) is sitting on its 1W MA50 (blue trend-line) having tested it last month for the first time since the week of March 30 2026, being on a strong 4-month correction since the 1M RSI got overbought. With the 1M RSI breaking below its MA (yellow trend-line) in September, the probabiliti
Small caps vs large caps since 1988: a coin flip, 50.3%Small caps are said to move more than large caps, both ways. We measured the Russell 2000 against the S&P 500 week by week, from 1988 to 2025.
What we measured
TradingView weekly closes for the Russell 2000 and the S&P 500: 1,983 weeks. Both are price indices, without dividends, and the S&P's co
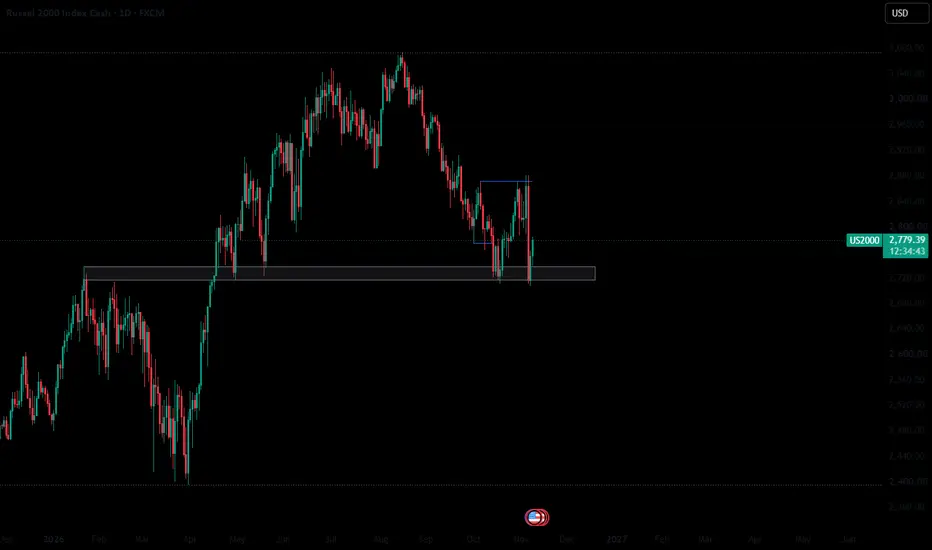
US2000 Index Tests Key Support Levels!Technical analysis of the US2000 index:
The Russell US2000 Index is currently trading near key support levels, and we will be watching how prices react to this area. The index recorded a sharp decline in yesterday's session, falling by 5.1% and settling near the 2,715 level. The support levels in
RUSSELL: Eyes the 1D MA100 and 2,500.Russell 2000 turned bearish on its 1D technical outlook (RSI = 39.218, MACD = -8.865, ADX = 24.707) as today's dramatic reversal crossed under its 1W MA50 again on one of the most brutal candles in recent history. The long term Channel Up now eyes the 1W MA100 for support, which has been untouched s
us2000 LONGHTF bias is Bullish.
Market condition is in bearish retracement.
POI: Daily demand zone. Price has revisited the zone multiple times, including a sharp bearish penetration and recovery.
V06 execution plan
1. Wait for price to interact with the demand zone.
2. Observe liquidity events (sweep of loca
The Russell May Be RunningThe Russell 2000 small cap index had a big pullback in the late summer, but some traders could think it’s rising again.
The first pattern on today’s chart is the January peak of 2,735. RUT bounced at that level in April and May before advancing to new highs. It held the same level after sliding bet
US2000: Small-Cap Breakout Reloaded? The 2970 Money Heist!🔥 US2000 / RUSSELL 2000 — SMALL-CAP MONEY HEIST 🔥
🇺🇸 US SMALL CAP 2000 | RUT | Index CFD
📊 Day Trade / Swing Trade Opportunity Guide
🚨 THIEF TRADER MISSION: BULLISH BREAKOUT + RETEST 🚨
🎯 MY PLAN
Plan: Bullish scenario
Entry concept: Bullish breakout + retest confirmation
First Target: 2920
Main /
Russell 2000 (RTY) | Multi-Timeframe Market AnalysisOverall Bias: Bullish
Execution Bias: Intraday Long
Higher Timeframe Analysis
Monthly: The broader structure remains bullish, with price showing a strong rejection from the 10 EMA and holding above the 38.2% Fibonacci retracement. The next major upside objective is the previous monthly high, which
RUSSELL MULTI TIME FRAME ANALYSISHigher-Timeframe Bias: Bullish
Monthly: Strong rejection from the 10 EMA; targeting the previous monthly high.
Weekly: Mixed structure, but major trend remains bullish with price holding above the 50 EMA.
Daily: Bullish break of structure, with price reacting from the 38.2% Fibonacci level.
4H: Bu
See all ideas
Displays a symbol's value movements over previous years to identify recurring trends.
Frequently asked questions
The safest way to invest in US Small Cap 2000 CFD is through a reliable broker. Create an account, fund it, and place a buy order for index futures or other derivatives.
You can trade US Small Cap 2000 CFD directly from TradingView:
– Choose a broker: Explore our supported trading partners and pick one that fits your needs
– Compare options: View available brokers side by side to evaluate fees and features
– Connect your account: Open Supercharts, click "Trade", select your broker, and log in
– Start trading: Place orders without leaving the chart
Tip: If you're new to trading, try paper trading first — it lets you practice strategies in real market conditions without risking funds.
You can trade US Small Cap 2000 CFD directly from TradingView:
– Choose a broker: Explore our supported trading partners and pick one that fits your needs
– Compare options: View available brokers side by side to evaluate fees and features
– Connect your account: Open Supercharts, click "Trade", select your broker, and log in
– Start trading: Place orders without leaving the chart
Tip: If you're new to trading, try paper trading first — it lets you practice strategies in real market conditions without risking funds.