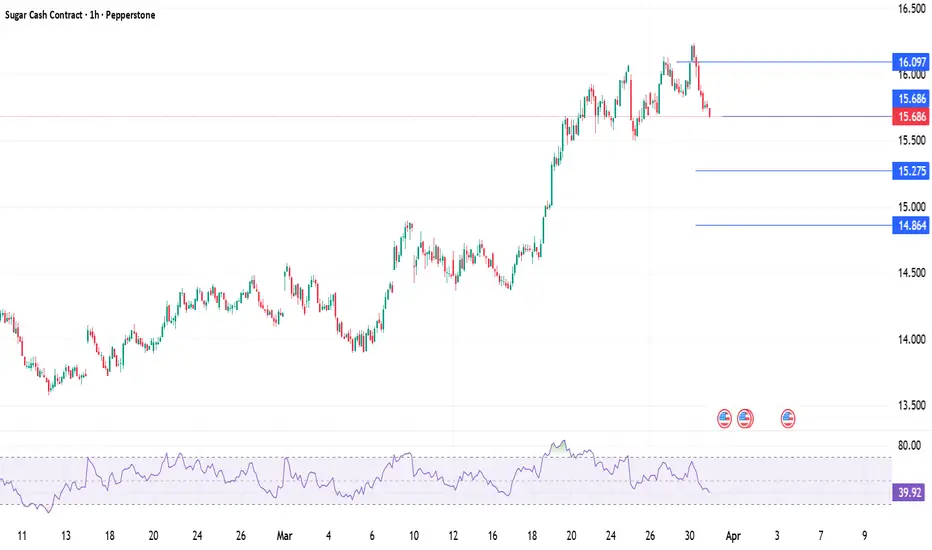
Sugar - Bulls Show the First Signs of Strength!Sugar remains bearish from a broader perspective, having traded inside the red descending channel for an extended period. Despite the prevailing downtrend, price has repeatedly respected the blue support area, where buyers have stepped in several times to prevent a breakdown.
Recently, price broke
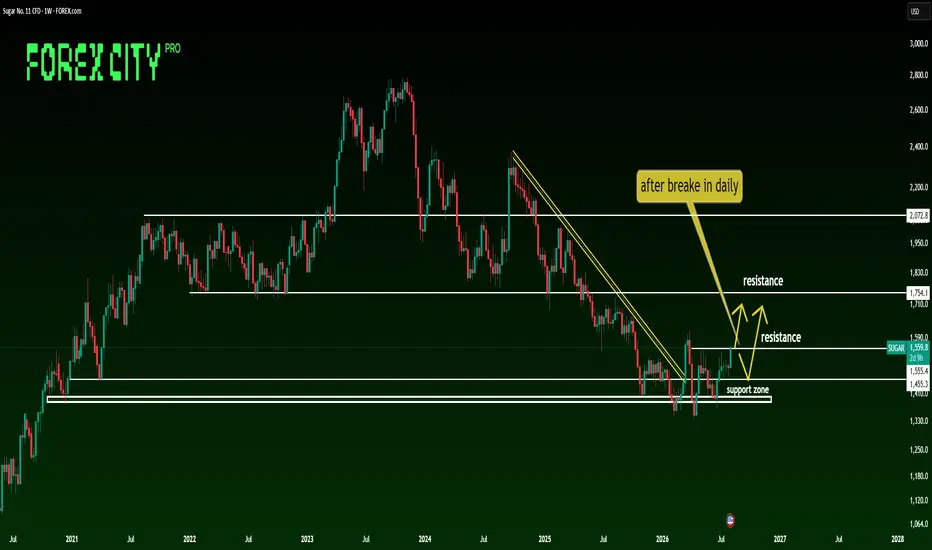
Weekly Sugar Analysis | SUGARWeekly Sugar Analysis | SUGAR 🍬📊
Hello and warm greetings to all my friends and followers on TradingView! 🌹📈
I hope your trades are going well and your portfolios are staying green. Today, let’s take a look at Sugar No. 11 on the weekly timeframe and examine whether the market may finally be showin
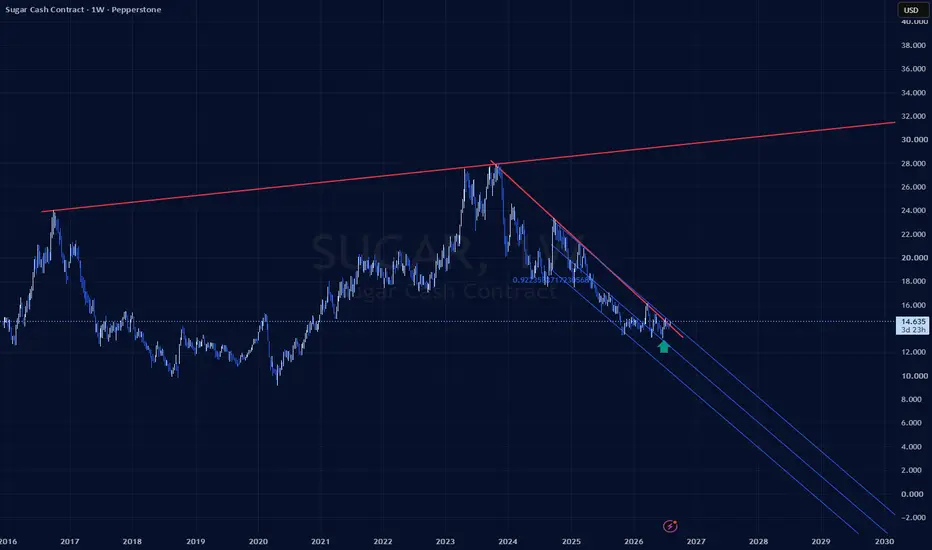
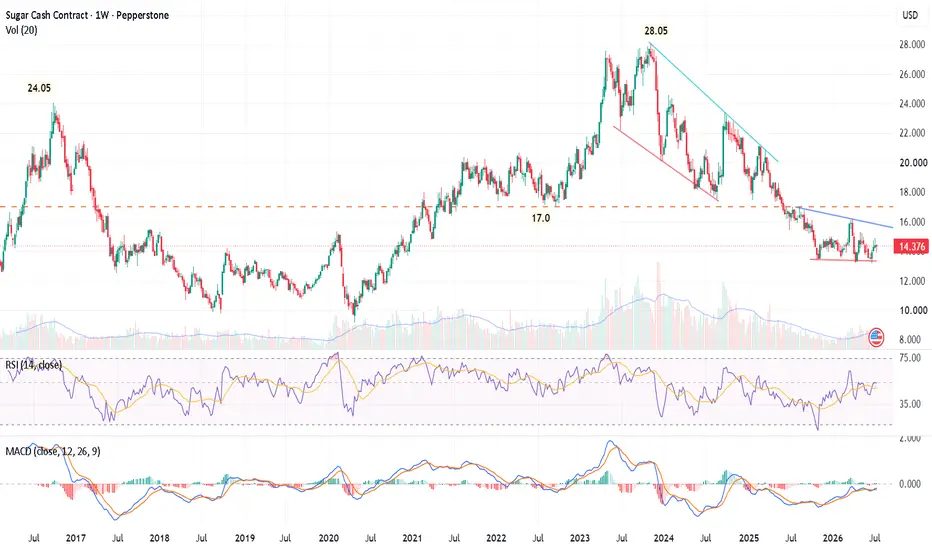
Sugar (Cash) : Technical Analysis & OverviewPEPPERSTONE:SUGAR Weekly Chart
Key Support Test & Multi-Year Falling Wedge
Sugar (Cash / Spot) is currently trading around 14.37, undergoing a macro corrective phase after peaking at its 2023 major high of 28.05. A clear structure is forming on the weekly chart that sets up a potential
Sugar bulls eye a sweet breakoutIt's decision time for sugar bulls.
Mounting supply concerns, including a disappointing Indian monsoon and a heatwave across parts of Europe, have helped drive a sharp rebound in prices over recent days. But despite the improved backdrop, the rally has now stalled at the intersection of horizontal
Has Sugar made a low?Sugar has been in a correction from the high back in 2023, with a strong downward correction which made a low at the 72% fib level.
Checklist
Increasing volume - YES for the past month
5 waves up - Current small wave has 5 waves
Correction complete (pull back) - Yes but ABC counter trend correctio
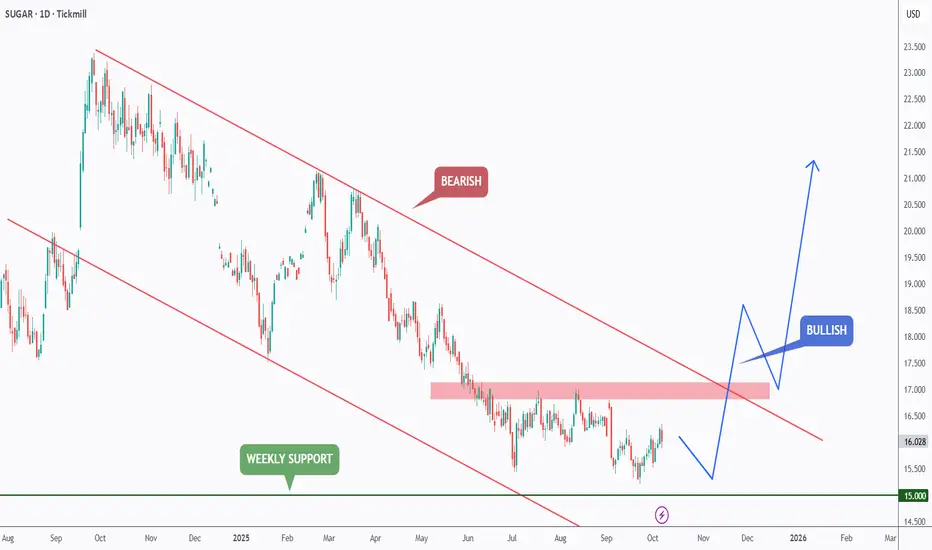
SUGAR – Sweet Spot at $15… Reversal Brewing?Sugar has been trading within a clear bearish channel , but price is now hovering around a key psychological level.
As long as price holds above the $15 round number, we expect buyers to step in and gradually shift momentum to the upside.
However , for the bulls to fully take control, a break a
Sugar returns to the scene of the breakout - March 2026On the above 6 day chart price action has corrected 80% from all time highs. A number of reasons now exist for a bullish outlook. They include:
Price action has returned to the 7 year resistance breakout level. Former resistance, now support. This is a classic and significant technical development.
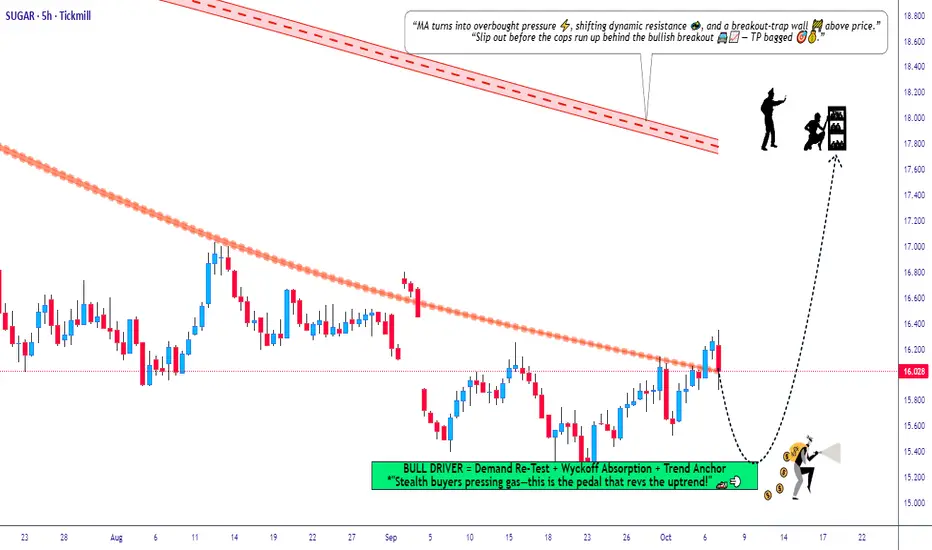
Sugar Market Upside Potential – Smart Entry, SL & TP GuideSUGAR: HULL MA Breakout Confirms BULLISH SWING! 🚀🍭 + Key Pairs Analysis
🔥 Asset: “SUGAR” – Soft Commodities Market Trade Opportunity Guide (Swing / Day Trade)
📈 Market Bias: Bullish continuation confirmed after a HULL Moving Average Breakout
🎯 Trading Style: Suitable for both Swing & Day Traders
🚀
See all ideas
Displays a symbol's price movements over previous years to identify recurring trends.