Sugar (Cash) : Technical Analysis & OverviewPEPPERSTONE:SUGAR Weekly Chart
Key Support Test & Multi-Year Falling Wedge
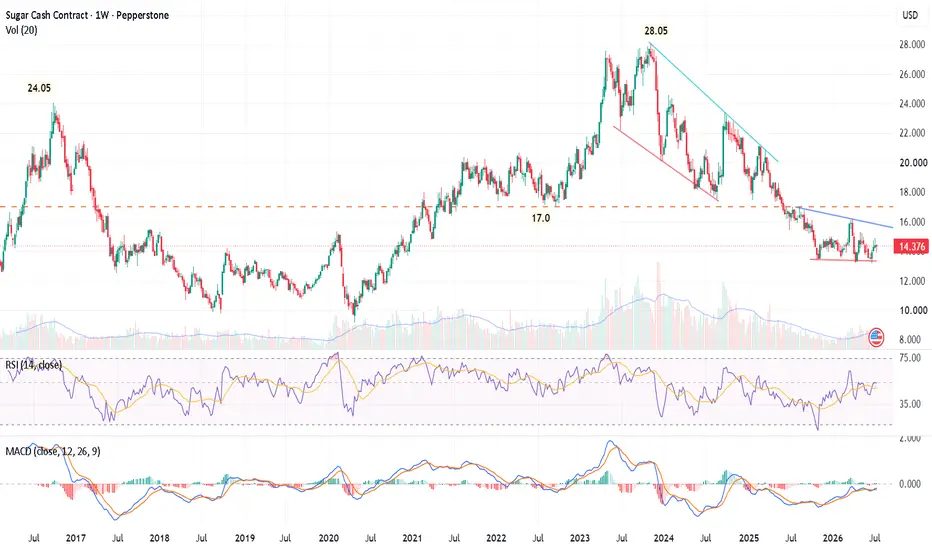
Sugar (Cash / Spot) is currently trading around 14.37, undergoing a macro corrective phase after peaking at its 2023 major high of 28.05. A clear structure is forming on the weekly chart that sets up a potential high-probability setup for swing traders.
Technical Breakdown & Structure
Macro Geometry & Wedge Structure:
From the 28.05 peak down to the recent lows, price action is bounded within a descending structure (falling wedge/descending channel). Notice the highlighted blue resistance line above and the underlying red trendline support. Price is compressing toward the apex of this falling structure.
Horizontal Support Zone (13.90 – 14.30):
The current price level (14.376) is testing a critical horizontal support base (red baseline). On the weekly chart, this zone has consistently acted as a launchpad and structural pivot in previous cycles. A sustained break below 13.90 would invalidate the immediate bullish setup.
Key Macro Resistance Overhead (17.00):
The horizontal dashed orange level at 17.00 marks the major breakdown point from earlier in the cycle. This remains the primary macro hurdle for bulls in any upcoming relief rally.
Indicator Analysis
RSI (14): Currently sitting at 49.72 (Signal line at 45.86). The index has recovered from oversold conditions and is consolidating near the neutral 50 level, showing early signs of bullish divergence on lower timeframes relative to the recent price test of the 13.90 support area.
MACD (12, 26, 9): The MACD histogram has crossed back above zero, with the MACD line (0.054) crossing over the signal line (-0.182). While values remain near the zero line, this bullish crossover indicates momentum is gradually shifting back to the upside.
Trading Plan & Expectations
Scenario A: Bullish Reversal / Falling Wedge Breakout (Primary Bias)
Entry Trigger: A confirmed weekly close back above the immediate falling blue resistance trendline (~15.20 - 15.50).
Target 1: 17.00 (Major horizontal resistance pivot).
Target 2: 19.50 – 20.00 (Descending channel upper boundary / previous lower high).
Stop Loss: Below the key structural horizontal support at 13.80.
Scenario B: Bearish Breakdown (Invalidation)
If price fails to hold the 13.90 base and closes lower on the weekly timeframe, expect further downside toward the 12.50 – 12.00 psychological demand zone before any meaningful recovery.
Summary: Sugar is consolidating at a major multi-year support floor inside a long-term falling structure. Risk-to-reward strongly favors buyers near this 13.90 - 14.30 zone, provided risk is tightly managed below key support. A breakout above 15.50 will confirm a trend reversal toward 17.00+.
In-depth trading ideas
Sugar bulls eye a sweet breakoutIt's decision time for sugar bulls.
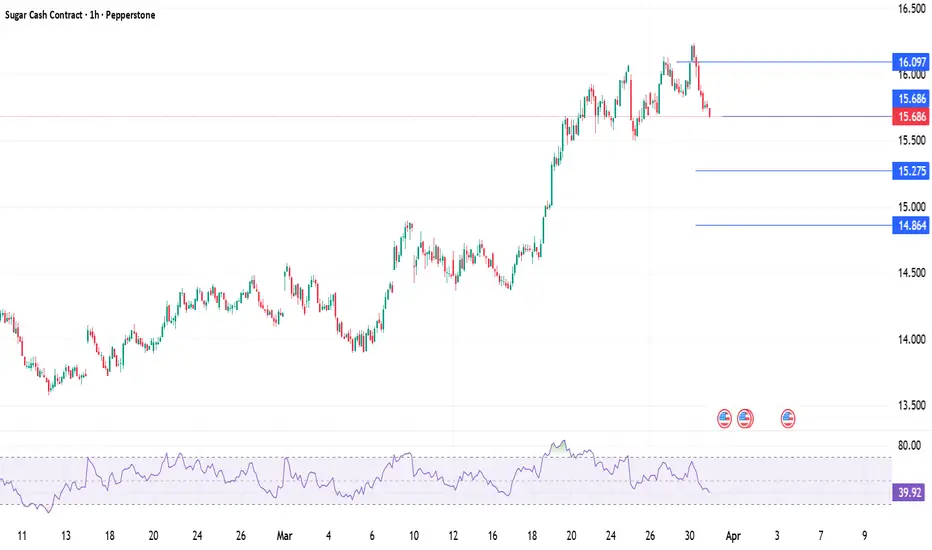
Mounting supply concerns, including a disappointing Indian monsoon and a heatwave across parts of Europe, have helped drive a sharp rebound in prices over recent days. But despite the improved backdrop, the rally has now stalled at the intersection of horizontal resistance at 14.883 cents per pound and downtrend from the March highs. That's now the immediate focus overhead.
A convincing break above that resistance zone would strengthen the case that a more meaningful recovery is underway. If that happens, longs could be considered above with a tight stop beneath, targeting 15.25 cents per pound initially, followed by 15.52 cents, before the March 30 swing high at 16.18 cents per pound comes into view.
The message from the oscillators is also becoming more supportive. RSI (14) has pushed back above 50 and continues to trend higher, while MACD has crossed above the signal line and is moving towards positive territory while continuing to diverge from it. At the very least, it suggests we may be in the early stages of a shift in momentum from the downside to the upside. It's not a definitive signal yet, but it's there.
Of course, if the price can't break decisively above 14.883 cents per pound, another option would be to look at shorts, initially targeting the confluence of the 50 and 100-day moving averages before 14.363 cents per pound, a level that has repeatedly acted as both support and resistance in recent weeks. Beneath that, 13.68 cents per pound comes into focus before the double bottom around 13.44 cents per pound set earlier this year.
Good luck!
DS
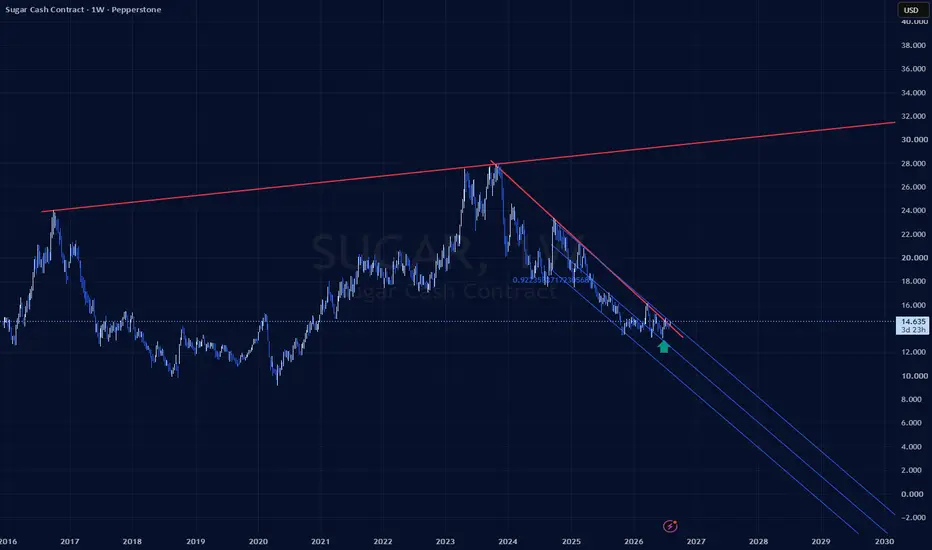
Has Sugar made a low?Sugar has been in a correction from the high back in 2023, with a strong downward correction which made a low at the 72% fib level.
Checklist
Increasing volume - YES for the past month
5 waves up - Current small wave has 5 waves
Correction complete (pull back) - Yes but ABC counter trend correction is still valid
Above DEMA 233 Day - YES
PITCHFORK/GEOMETRY - YES long term price channel shows support
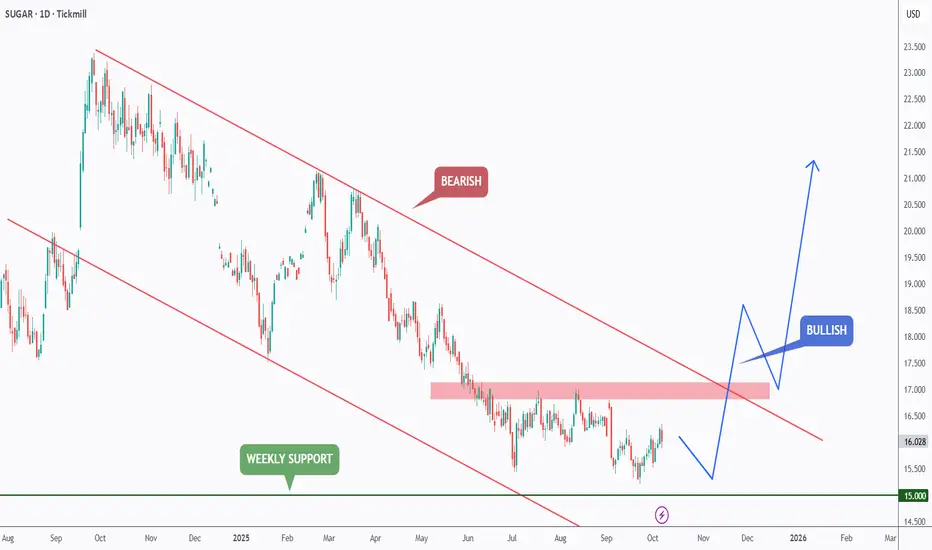
SUGAR – Sweet Spot at $15… Reversal Brewing?Sugar has been trading within a clear bearish channel , but price is now hovering around a key psychological level.
As long as price holds above the $15 round number, we expect buyers to step in and gradually shift momentum to the upside.
However , for the bulls to fully take control, a break above the falling channel and the last major high marked in red is needed.
Until then, this remains a potential bottoming phase… not a confirmed reversal.
⚠️ Disclaimer: This is not financial advice. Always do your own research and manage risk properly.
📚 Stick to your trading plan regarding entries, risk, and management.
Good luck! 🍀
All Strategies Are Good; If Managed Properly!
~Richard Nasr
SLong
Sugar returns to the scene of the breakout - March 2026On the above 6 day chart price action has corrected 80% from all time highs. A number of reasons now exist for a bullish outlook. They include:
Price action has returned to the 7 year resistance breakout level. Former resistance, now support. This is a classic and significant technical development. Give your attention to support confirmation.
Composite oscillator prints an Incredible Buy signal. On this timeframe these signals are rare. The last comparable signal preceded the historic breakout rally.
The measured move from the breakout base to the all time high, when applied as a corrective target, places price precisely at current levels. The market has mean reverted in full.
For now the evidence is compelling. The 7 year resistance held the market for nearly a decade. It launched one of the most extraordinary commodity rallies in a generation. Price has now returned to test that same level as support.
The forecast is to the upper resistance zone in the region of $14,000 - $15,000.
Is it possible price action continues lower? Of course. Nothing is guaranteed in markets. A weekly close materially below the green support zone would concern the bullish case and require reassessment.
Is it probable? No.
Patience is required on this timeframe. Each candle is 6 days. Targets are weeks and months in the making, not tomorrow.
Ww
=============================================================
Disclaimer
As always, these are personal views and shared for educational purposes only. They do not constitute financial advice. Please do your own research and manage risk accordingly.
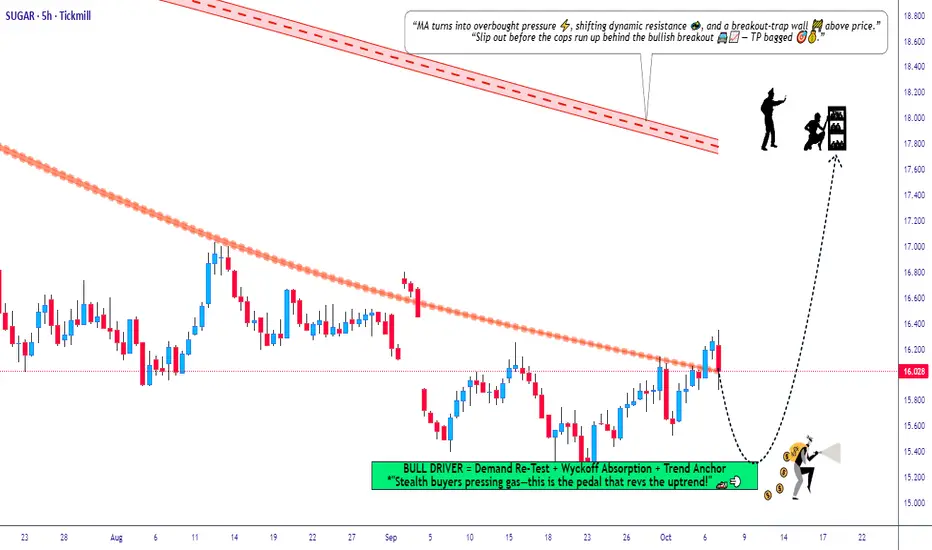
Sugar Market Upside Potential – Smart Entry, SL & TP GuideSUGAR: HULL MA Breakout Confirms BULLISH SWING! 🚀🍭 + Key Pairs Analysis
🔥 Asset: “SUGAR” – Soft Commodities Market Trade Opportunity Guide (Swing / Day Trade)
📈 Market Bias: Bullish continuation confirmed after a HULL Moving Average Breakout
🎯 Trading Style: Suitable for both Swing & Day Traders
🚀 Plan Overview
The bullish structure remains strong as price has completed a clean breakout above the Hull Moving Average, signaling renewed upward momentum. Buyers continue to hold control, and momentum strength supports potential continuation toward higher resistance zones.
🎯 Entry Plan
💠 Entry: Traders can position at any suitable price level after confirming bullish structure continuation.
✔ Use your own filtering tools such as:
– Structure Retests
– Trendline Bounces
– Pullback Zones
– Volume Confirmation
🛡 Stop Loss (Risk Management)
🔻 Suggested SL Zone: 15.200
Dear Ladies & Gentlemen (Thief OG’s), kindly adjust your stop loss based on your personal strategy and risk tolerance. This value is NOT a mandatory SL—trade safely and manage your own risk model.
🎯 Target Zone
🎯 Primary Target: 17.600
This target aligns with:
• Moving Average Resistance Zone
• Overbought Price Conditions
• Potential Bull Trap Formation Near Upper Bands
Dear Ladies & Gentlemen (Thief OG’s), take profits according to your own strategy. You are in full control—make profits, secure profits at your comfort and risk.
🔍 Correlated Pairs & Related Markets to Watch
Monitoring correlated markets helps validate momentum, sentiment, and macro commodity flow.
🔸 1. Sugar Futures (SB1!) — USD Contract
• Direct benchmark for sugar price movements.
• Strong correlation with supply shocks, weather conditions & global trade flows.
🔸 2. Crude Oil (WTI / Brent)
• Indirect correlation through biofuel production.
• When crude rises, demand for ethanol (produced from sugarcane) increases → bullish for Sugar.
• Watch for energy market volatility.
🔸 3. US Dollar Index (DXY)
• Commodities priced in USD react inversely.
• Weak USD = bullish commodities, including sugar.
• If DXY pulls back, sugar tends to strengthen.
🔸 4. Corn Futures (ZC)
• Sugar competes with corn in the biofuel market.
• If corn prices rise, sugar becomes more attractive → increases demand for sugarcane-derived products.
🔸 5. Coffee & Cocoa (Soft Commodities Basket)
• Often experience similar supply chain disruptions.
• Weather cycles impact the entire soft-commodity group together.
• Strength in these markets sometimes signals broader soft commodity momentum.
🧭 Key Takeaways
• Hull MA Breakout confirms bullish control
• Structure remains supportive for higher continuation
• Risk management is personal—trade responsibly
• Soft commodities often move in clusters; keep correlated markets on your radar
• Watch for overbought traps near target zone
S
Is This the Perfect Short Entry in Sugar RAW? Check the Plan!🏴☠️ Thief OG’s Sugar RAW CFD Money Making Plan 💰 (Swing/Day Trade)
Asset: SUGAR RAW Commodities CFD
Plan: Bearish Plan confirmed with 200 SMA rejection of bulls + seller pressure on the downside
⚡ Trade Setup – Thief Strategy Style
Entry: Use Thief layering strategy with multiple limit orders:
Example: 16.000 / 15.800 / 15.600 / 16.100
💡 You can increase limit layers based on your own plan.
Stop Loss: Thief SL @16.400 ❌
Adjust based on your strategy & risk appetite.
Target: Support + oversold + market reversal trap → Target @15.000 🎯
Note: Take profits at your discretion — “stolen money” is yours to keep 💵
🔍 Why This Plan? – Thief Technical + Macro Analysis (SEPTEMBER 05)
Thief Technical Plan:
Bearish trend confirmed via 200 SMA rejection 📉
Multiple layer entries to optimize risk/reward ⚡
Market traps and reversal zones accounted for 🕵️♂️
Fundamental & Macro Insights:
Fundamental Score: 6/10
✅ Record global production: 189.3M MT (Brazil & Thailand)
❌ Surplus of 7.5M MT pressuring prices
⚠️ Logistical bottlenecks & ethanol competition affecting supply
Macro Score: 5/10
📉 Weak global demand amid slowdown
🌎 Geopolitical tensions affecting trade flows
💵 Strong USD capping gains
Investor Sentiment:
Retail Traders: Bullish 45% 🐂 / Bearish 55% 🐻
Institutional Traders: Bullish 35% 🐂 / Bearish 65% 🐻
Fear & Greed Index:
Current Level: 40/100 😨 Neutral → slight fear
Mood: Cautious due to oversupply
Overall Market Outlook: Bearish 📉
Oversupply + weak demand + macro headwinds outweigh emerging market demand potential
🔗 Related Pairs to Watch:
$COFFEEUSD ☕
$COTTONUSD 🧵
OANDA:SUGARUSD 🍬
“If you find value in my analysis, a 👍 and 🚀 boost is much appreciated — it helps me share more setups with the community!”
#SugarCFD #CommoditiesTrading #ThiefStrategy #BearishPlan #SwingTrade #DayTrade #CryptoCommodities #ForexCFD #MarketAnalysis #TradingViewIdeas #TraderOG
SShort
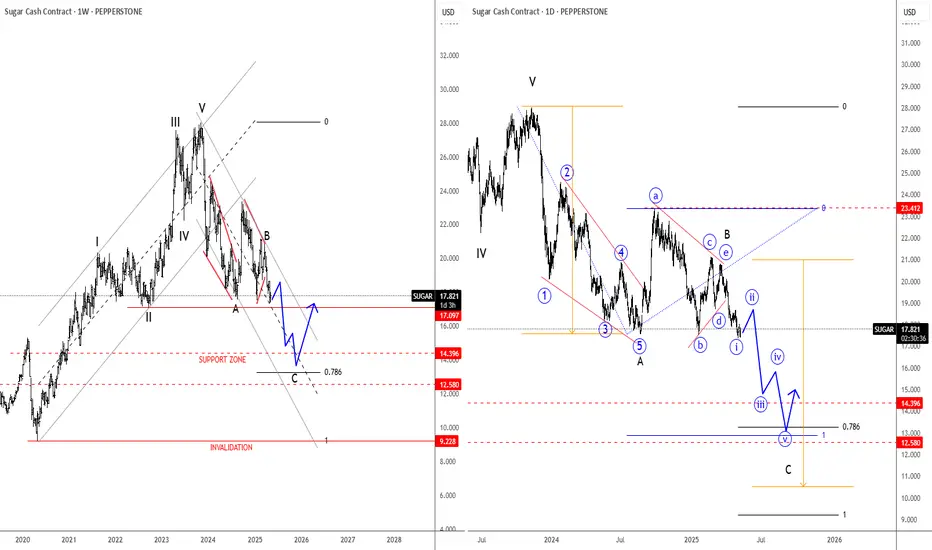
Sugar Is In A Higher Degree Correction; Elliott Wave AnalysisSugar has been trading lower since 2023 when we spotted final wave V of an impulse on the weekly chart. So from Elliott wave perspective, it’s trading in a multi-year higher degree ABC corrective decline, where wave C can drop the price even down to 78,6% Fibonnaci retracement and 14-12 support area before bulls show up again.
The reason why Sugar can go lower is a short-term daily Elliott wave structure, where we see a five-wave leading diagonal formation into wave A, followed by a bearish abcde triangle pattern in wave B. It can now extend the decline within wave C towards 14 -12 area which can be made by a lower-degree five-wave bearish cycle, just be aware of short-term pullbacks.
Sugar (CFD) – Bullish Setup from a Key Demand Zone! 🔥 Sugar (CFD) – Bullish Setup from a Key Demand Zone! 🍬
Sugar is bouncing off a major demand zone, presenting a great risk/reward setup for a bullish move. With technical indicators signaling a reversal and fundamental tailwinds supporting higher prices, this could be a great swing trade opportunity. Let’s dive into the setup!
💼 Trade Setup (CFD Pricing):
🔹 Entry Price: 1,770
🎯 Take Profit 1: 1,820
🎯 Take Profit 2: 1,930
🎯 Take Profit 3: 2,070
🎯 Take Profit 4: 2,350
🛡️ Stop Loss: 1,650
📈 Why Am I Bullish on Sugar?
1️⃣ Technical Reversal from a Strong Demand Zone
Sugar is bouncing off a key support level around 1,750-1,770, a demand zone that has held multiple times in the past. This level has consistently attracted buyers, and the current bounce suggests renewed interest from bulls.
Additionally, the RSI is climbing out of oversold territory, and Stochastic indicators are signaling a potential reversal, which supports a bullish outlook.
2️⃣ Fundamental Tailwinds
The global sugar market remains tight, with ongoing supply concerns in major producing countries like Brazil and India. At the same time, demand from China continues to rise, adding upward pressure on prices.
With weather risks and logistical issues, the supply/demand imbalance favors higher prices in the medium term.
💡 Final Thoughts:
Sugar is setting up for a strong bullish move, with both technical and fundamental factors aligning. If the price holds above the 1,750 demand zone, we could see a rally toward 2,000 and beyond.
Keep an eye on the 1,800 breakout level, which could confirm the continuation of the bullish trend. Let’s see how it plays out! 🚀
💬 What’s your take on Sugar? Are you bullish too? Drop your thoughts below! 👇
Sugar Market: Higher U.S. Production and Global Trade ShiftsRising U.S. Sugar Production and Its Impact on Prices
In recent years, the United States has witnessed a notable increase in sugar production, driven by advancements in agricultural technology and favorable weather conditions. This growth has contributed to reduced reliance on imports, particularly from Mexico, which has traditionally been one of the largest suppliers of sugar to the U.S. market. While this development enhances domestic self-sufficiency, it also exerts downward pressure on both domestic and international sugar prices, reshaping global trade dynamics.
The shift in U.S. production patterns has significant implications for global markets. With increased domestic supply, the need for imports diminishes, impacting countries like Mexico that depend heavily on exports to the United States. This trend could lead to long-term adjustments in global trade flows, as other nations seek alternative buyers or adapt their own production strategies.
Challenges Facing Mexico's Sugar Industry
Mexico's sugar industry faces mounting challenges amid declining exports to the United States. In addition to competition from rising U.S. production, Mexican producers grapple with internal issues such as outdated infrastructure, water scarcity, and insufficient investment in modernization. These factors erode the competitiveness of Mexican sugar compared to its American counterpart, further complicating efforts to maintain market share.
Moreover, regulatory changes and evolving trade agreements add another layer of complexity. For instance, stricter quality standards and fluctuating quotas have created uncertainty for Mexican exporters, forcing them to explore new markets while addressing existing inefficiencies.
Changes in Import Patterns and Their Implications
Despite increased domestic production, the United States continues to import sugar to meet consumer demand. However, the composition of these imports is shifting. Data from USDA indicates that Mexico's share of U.S. sugar imports is decreasing, giving way to other major producers such as Brazil and Thailand, known for their cost advantages and flexible trading terms. This realignment reflects broader trends in global agriculture, where emerging economies leverage competitive pricing and scalable operations to capture larger portions of international markets.
For stakeholders in the U.S. sugar sector, understanding these shifts is critical. Companies must evaluate how changing import patterns affect supply chains, pricing strategies, and overall profitability. At the same time, policymakers face the challenge of balancing domestic interests with international obligations, ensuring fair competition without undermining local industries.
Looking Ahead
The evolving landscape of the global sugar market underscores the importance of adaptability and innovation. As the United States continues to boost its production capabilities, it sets a precedent for other countries to follow suit. Meanwhile, traditional exporters like Mexico must rethink their approaches to remain relevant in an increasingly dynamic environment. By embracing technological advancements, optimizing resource utilization, and exploring diversified markets, players across the sugar value chain can position themselves for sustained success in the years ahead.
ECONOMICS:WWSPI
OANDA:SUGARUSD
SET:KSL
Raw Sugar vs US Dollar Quote | Chart & Forecast SummaryKey Indicators On Trade Set Up In General
1. Push Set Up
2. Range Set up
3. Break & Retest Set Up
Notes On Session
Raw Sugar vs US Dollar Quote
- Double Formation
* (Reversal Argument)) At 23.500 USD | Subdivision 1
* Trendline 1&2 | Descending Triangle Measurement
- Triple Formation
* Pattern Confirmation | Inverted Head & Shoulders | Subdivision 2
* Numbered Retracement | Uptrend Bias & Entry | Subdivision 3
* Daily Time Frame | Trend Settings Condition
Active Sessions On Relevant Range & Elemented Probabilities;
European Session(Upwards) - US-Session(Downwards) - Asian Session(Ranging)
Conclusion | Trade Plan Execution & Risk Management On Demand;
Overall Consensus | Buy
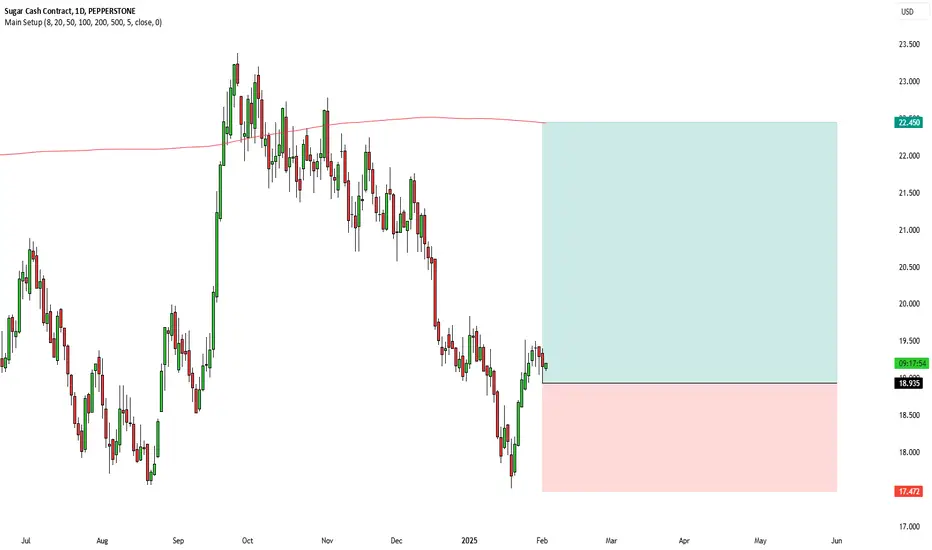
SUGAR LONG A superb long opportunity has emerged with an outstanding risk-to-reward ratio. The price is forming a double bottom pattern, signaling a potential reversal to the upside.
To account for market fluctuations, we recommend placing the stop loss slighly lower than usual for added safety.
Good luck to everyone!
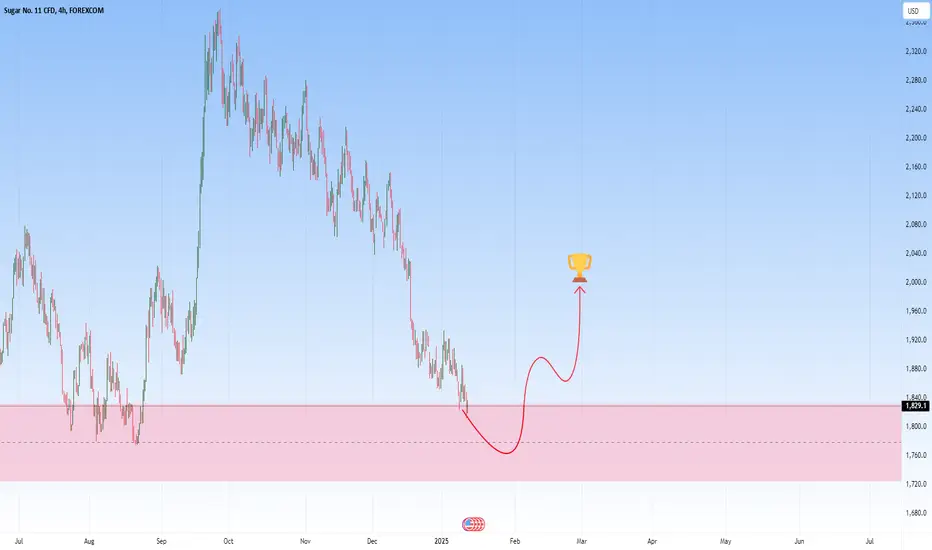
Sugar Up for a Potential RallySugar prices have reached a strong demand zone around 1825–1830, a major support level. The price action suggests potential accumulation, with buyers likely stepping in. A rebound could target the 1983 level as the next resistance.
A sustained breakout above 1983 could open the door for further upside momentum, while a failure to hold 1825 may signal increased bearish activity.
Follow up for results.
Sugar may target 22.7Daily chart, Sugar PEPPERSTONE:SUGAR can be seen as forming a diamond chart pattern.
Since there is a price gap, as shown in the circle, it may go to close this gap before a rebound to the resistance line R.
Above R, the target will be 22.7 passing through a resistance level at 20.9
Stop loss below 18.4 should be considered.
SUGAR - UniverseMetta - Signal#SUGAR - UniverseMetta - Signal
W1 - Potential start of the 5th wave in the continuation of the uptrend.
H4 - You can consider entering from these levels or wait for fixation beyond the trend line. A more confident entry point is formed at the formation of the 3rd wave. Stop behind the minimum of the 1st wave.
Entry: 2206.7 - *2246.5
TP: 2290.8 - 2378.3 - 2520.6 - 2609.5
Stop: 2143.4
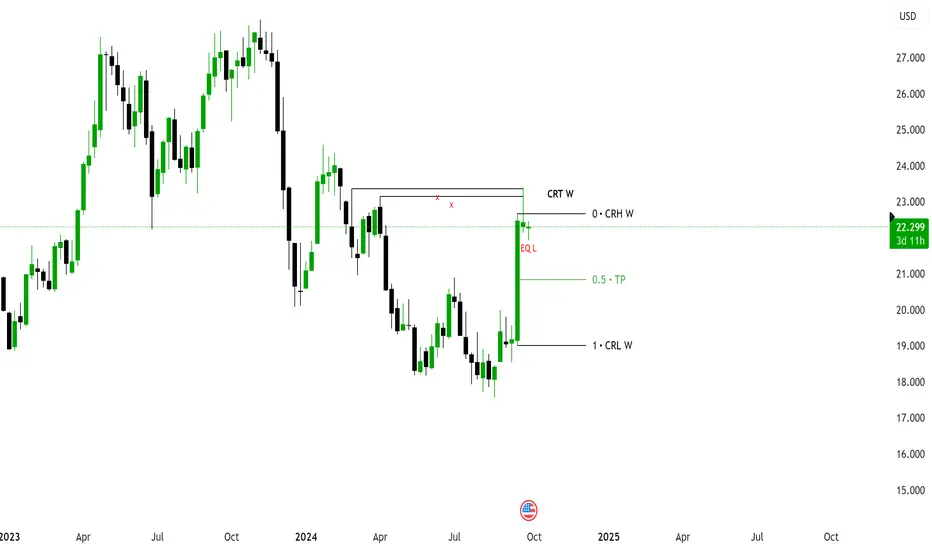
Weekly CRT ON SUGAR - SELLIn this strategy I look at the last 3 W candles and the structure confirms my conditions for CRT (candle range theory) .
Conditions:
1. Candle 1 sweeps a high from the past.
2. Candle 2 sweeps liquidity from candle 1 and closes with body in first candle.
3. Key level - this happens in an bearish OB .
Enter at 22.720 (on candle 3 in W TF), when we sweep H4 liquidity, SL at candle 2 high, Tp1 in 50% of candle 1 range.
Will SUGAR Cup Reach Its Target?When the SUGAR 8-hour chart is examined; It is observed that the price movements continue within the Cup formation formation. It is evaluated that the SUGAR price may retreat to the level of 2077 in price movements below the level of 2278, but it is evaluated that in price movements above the level of 2278, it may exceed the level of 2412 and target the level of 2964.
Sugar Chart Review
When the daily chart of Sugar is examined; It is observed that the price movements continue on the downward sloping wedge. As long as the level of Sugar price 1.841 is not broken down, it is evaluated that in price movements above the level of 1.927, it can exceed the level of 2.024 and target the level of 2.287.