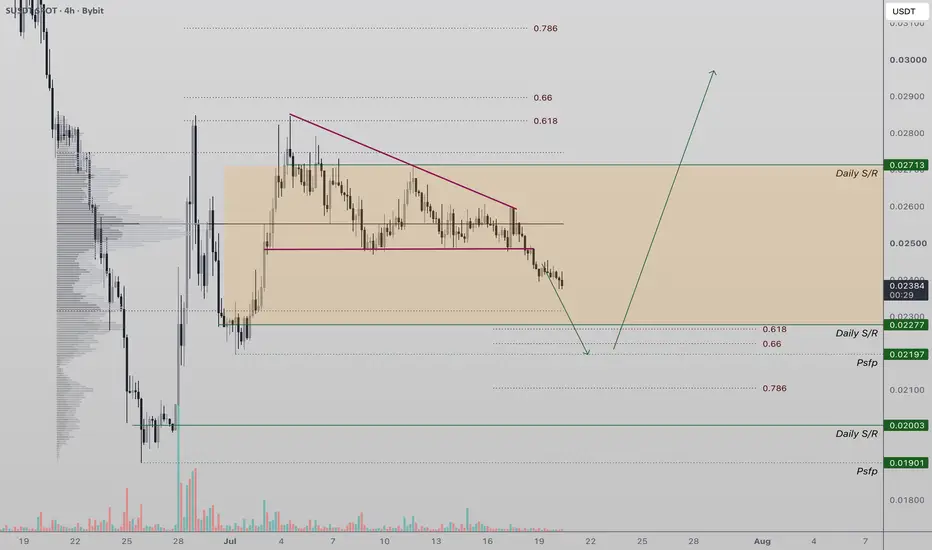
Sonic Key Support Appraching Sonic (S) has confirmed a breakdown from its local descending triangle, completing the bearish pattern and sending price toward its projected downside target.
This move aligns with the measured objective of the formation, suggesting sellers have largely achieved the initial target of the breakdown. As price approaches a significant higher-timeframe support level, attention now shifts from the downside move to whether buyers are prepared to defend this key area.
This support zone is critical for the next phase of price action. If Sonic can establish acceptance above this level and successfully hold it on a retest, the breakdown may transition into an exhaustion move rather than the beginning of a larger decline. A strong reaction from support would indicate that demand is returning, increasing the probability of a reversal back toward higher resistance levels.
Volume will be an important factor to monitor. An increase in buying activity as price tests support would strengthen the bullish case and confirm that market participants are stepping in with conviction. On the other hand, a failure to hold this region would invalidate the reversal scenario and expose Sonic to further downside pressure.
For now, the focus remains on the higher-timeframe support. As long as price continues to respect this level on any retest, the probability favours a recovery and a potential rotation back toward the upper boundaries of the recent trading range.
In-depth trading ideas
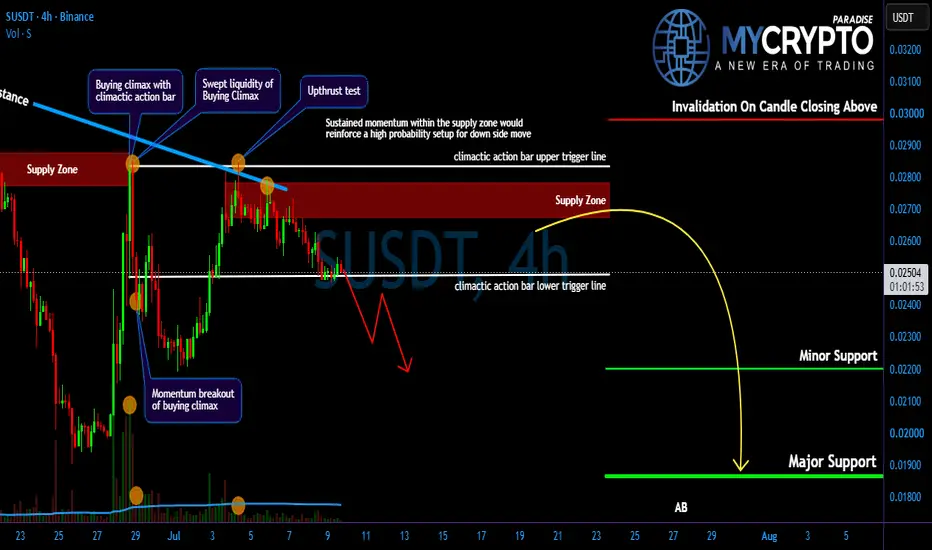
S Downside Risk Remains Active…!Yello Paradisers! Are you prepared for a potential sharp downside move on #S, or are you still calling this “just a healthy pullback” while smart money quietly distributes above you? At first glance, the structure may look harmless. But when we remove emotions and read the chart objectively, the story changes completely. This is not a random retracement. This is a high-risk zone where discipline matters more than opinions.
💎#S formed a buying climax followed by a climactic action bar. This combination typically shows distribution. In simple terms, institutions use these aggressive spikes to offload positions into retail enthusiasm. When the crowd feels confident, smart money distributes quietly.
💎#S swept the upper trigger line of the buying climax but failed to sustain higher levels. This was followed by a candle breaking below the lower trigger line, which is a major probability that supply is taking control. We have also seen an upthrust test, adding even more weight to the bearish scenario. If bearish momentum continues, the next major downside target sits around 1865, and it could be reached sooner than many traders expect.
💎#S has clearly respected the descending resistance trend-line and failed to break above it. This rejection is a key probability of ongoing structural weakness. At the same time, Overall structure is bearish and price has respected the supply area during the retracement.
💎As long as price holds momentum within the supply zone the probability favours continuation lower. The immediate minor support sits around 2200, which now acts as the first downside magnet if selling pressure persists.
💎If #S manages to break above the key resistance at 2980 with a strong momentum candle, this whole bearish probability would be invalidated, and we could instead see a bullish continuation. As always, we let price confirm our bias.
Discipline is key, Paradisers! The charts may look volatile, but this is where professionals thrive and amateurs panic. Don’t let emotions guide your trades. Wait for clear confirmation and manage risk like a pro. Strive for consistency, not quick profits. Treat the market as a businessman, not as a gambler.
MyCryptoParadise
iFeel the success🌴
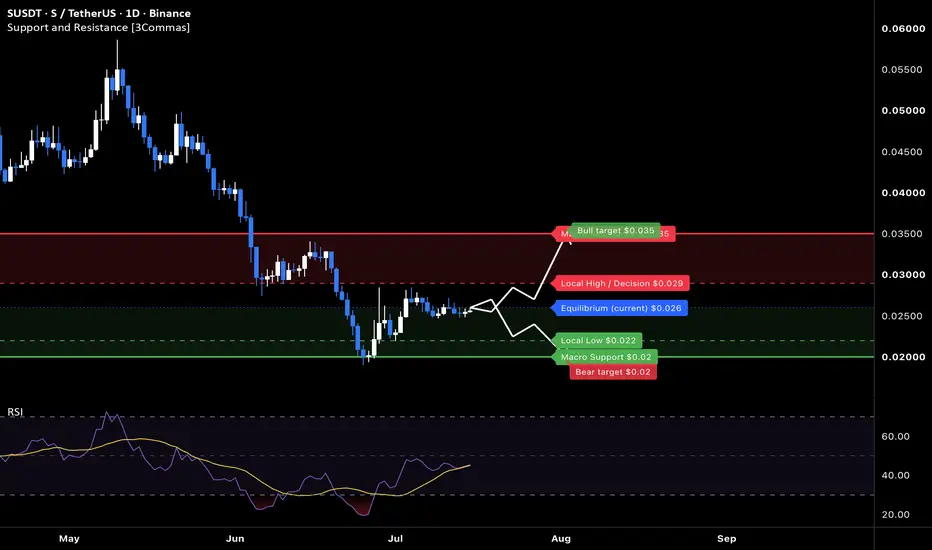
S at macro floor: base recovery toward $0.035The Macro Picture 🗺️
Sonic unwound its May $0.058 highs through a steep descent that bottomed at $0.020 in early July — a structural reset deep enough to exhaust the sellers and push RSI into oversold. Since that flush, the tape has changed character: price carved a higher low, reclaimed the equilibrium, and dragged momentum back toward the midline near 45. That shift from lower lows to a defended, rising base is the signature of accumulation. Price now sits at $0.026, holding well above the flush low, and the path of least resistance is beginning to tilt back in favor of the bulls.
The Setup ⚙️
The Buy Area: The $0.022–0.026 band is where the recovery has built. Bulls are defending each dip, and as marked on the chart, price is holding above the $0.022 higher low with momentum turning up.
The Accumulation Zone: A deeper flush toward $0.020 opens a textbook pocket for staggered, averaging-based entries — the twice-defended macro floor makes this a high-confluence zone to build a position rather than chase.
The Ceiling: The $0.029 decision line is the first hurdle. A clean reclaim confirms the recovery structure and opens the path toward the $0.035 macro resistance above.
The Roadmap: Primary target sits at $0.035 — the green roadmap points there as price works up from the base toward the next major shelf. Invalidation: a clean daily close below $0.020 would invalidate this bullish thesis and signal the base has failed.
More setups in profile.
#S #CRYPTO #Sonic #Altcoins #TechnicalAnalysis
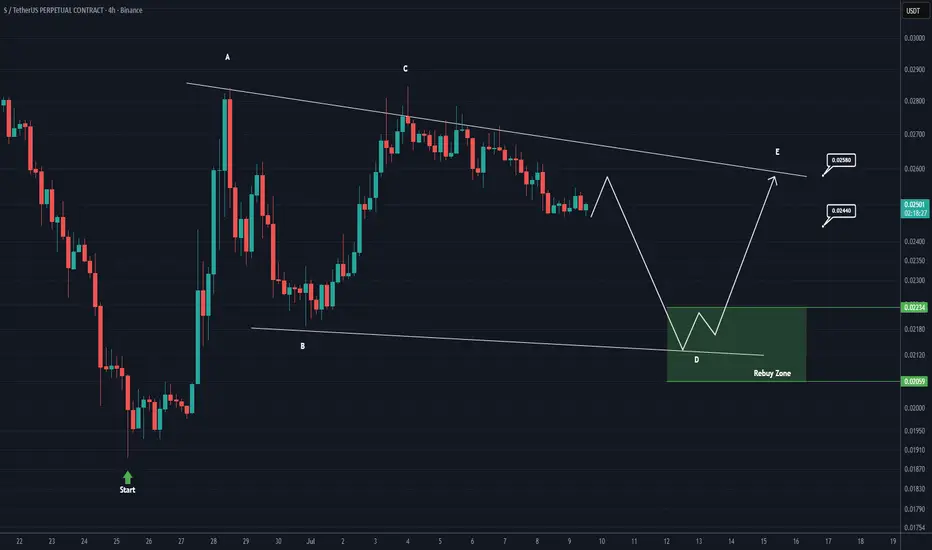
Sonic is currently consolidating within a triangle pattern (4H)Before anything else, it's important to note that this is not a sell/short setup—it's a buy/long setup.
From the point where we placed the green arrow on the chart, Sonic appears to have started forming a Triangle pattern.
Waves A, B, and C of the Triangle appear to be complete, and the price is now developing wave D.
The highlighted green zone offers the best area to look for buy/long positions. If the price reaches this zone, it provides a relatively low-risk entry. Set an alert around this area. If the price does not reach the green zone, we will not take a position.
The targets are marked on the chart.
A daily candle close below the invalidation level will invalidate this analysis.
If you have a symbol you want analyzed, first hit the like button and then comment its name so I can review it for you.
Do you also think SONIC is bullish?
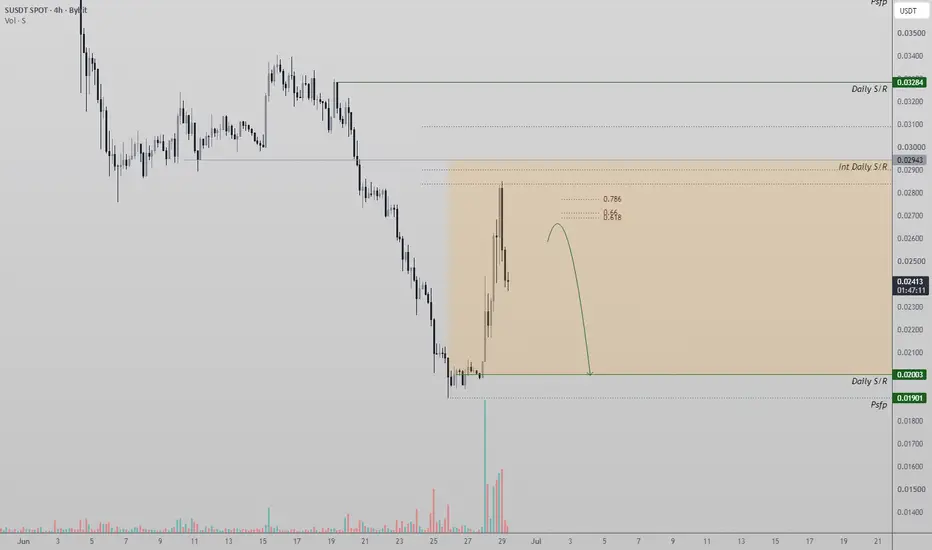
Sonic Faces Short-Term CorrectionSonic (S) is showing signs of short-term weakness after rejecting from the 0.618 Fibonacci retracement, a key technical resistance that has successfully capped the recent recovery. The rejection has also formed the early stages of a Swing Failure Pattern (SFP), suggesting that buying momentum may be fading and sellers are beginning to regain control.
Adding to the bearish outlook, price has now lost its daily support, increasing the probability of a corrective move toward the next major support region around 0.002. This level is particularly significant as it aligns with another 0.618 Fibonacci retracement, creating a strong area of technical confluence where buyers may look to step back into the market.
From a technical perspective, the recent rejection suggests that Sonic is likely to remain under pressure in the immediate short term. A move into the lower support would represent a healthy correction within the broader structure and could provide the foundation for the next bullish rotation if buyers defend the level.
For now, momentum favors the downside while price remains below the rejected Fibonacci resistance. Traders should closely monitor the reaction around the 0.002 support zone, as a successful defense could establish a higher low and reignite bullish momentum. Until then, the path of least resistance remains to the downside.
Sonic Eyes Consolidation After Rally Sonic (S) has staged a strong recovery after experiencing aggressive selling pressure, producing what appears to be a classic oversold bounce. The relief rally has been impressive, but price has now reached an important technical barrier at the 0.618 Fibonacci retracement, where sellers have begun stepping back into the market. The rejection from this level suggests that the recent bounce is encountering resistance, making this a pivotal area for determining the next short-term direction.
From a technical perspective, the oversold recovery has already achieved one of its primary objectives by retracing into a significant Fibonacci level. Rather than immediately continuing higher, the market is now showing signs that it may enter a period of consolidation. This would allow bullish and bearish participants to establish a new equilibrium before the next impulsive move develops.
The recent rally also followed an important retest of the daily support region, where price successfully revisited lower levels to fill market inefficiencies left during the previous decline. This retest strengthens the technical significance of the current range and suggests the market is attempting to build a more stable foundation.
As long as Sonic remains below the 0.618 Fibonacci resistance, the probability favors a range-bound environment rather than an immediate breakout. Consolidation within this region would be a healthy development, allowing momentum indicators to reset while buyers continue absorbing supply.
For now, the outlook is neutral in the immediate short term. The oversold bounce has relieved selling pressure, but confirmation of the next trend is still required. A sustained break above the 0.618 Fibonacci would shift momentum back in favor of the bulls, while continued rejection would likely keep price rotating within the developing range. Traders should monitor this consolidation closely, as it could provide the base for Sonic's next significant directional move in the weeks ahead.
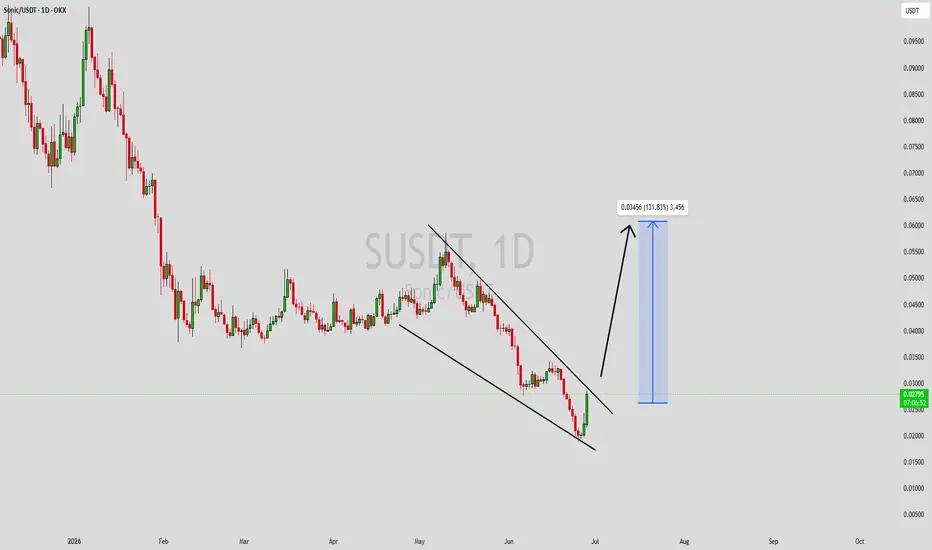
SUSDT Forming Falling WedgeSUSDT is forming a clear falling wedge pattern, a classic bullish wave signal that often indicates an upcoming breakout. The price has been consolidating within a narrowing range, suggesting that selling pressure is weakening while buyers are beginning to regain control. With consistent volume confirming accumulation at lower levels, the setup hints at a potential bullish breakout soon. The projected move could lead to an impressive gain of around 90% to 100% once the price breaks above the wedge resistance.
This falling wedge pattern is typically seen at the end of downtrends or corrective phases, and it represents a potential shift in market sentiment from bearish to bullish. Traders closely watching SUSDT are noting the strengthening momentum as it nears a breakout zone. Strong trading volume adds confidence to this pattern, showing that market participants are positioning early in anticipation of a reversal.
Investors’ growing interest in SUSDT reflects rising confidence in the project's long-term fundamentals and current technical strength. If the breakout confirms with sustained volume, this could mark the start of a fresh bullish leg. The current price structure indicates that bearish momentum is gradually fading while buyers continue to accumulate, creating favorable conditions for a potential trend reversal.
Traders might find this a valuable setup for medium-term gains, especially as the falling wedge pattern approaches completion and buying momentum accelerates. A successful breakout could attract additional buying interest and potentially drive the price toward its projected upside target over the coming weeks.
✅ Show your support by hitting the like button!
✅ Leave a comment below! (What is your opinion about this coin?)
Your feedback and engagement keep me inspired to share more insightful market analysis with you!
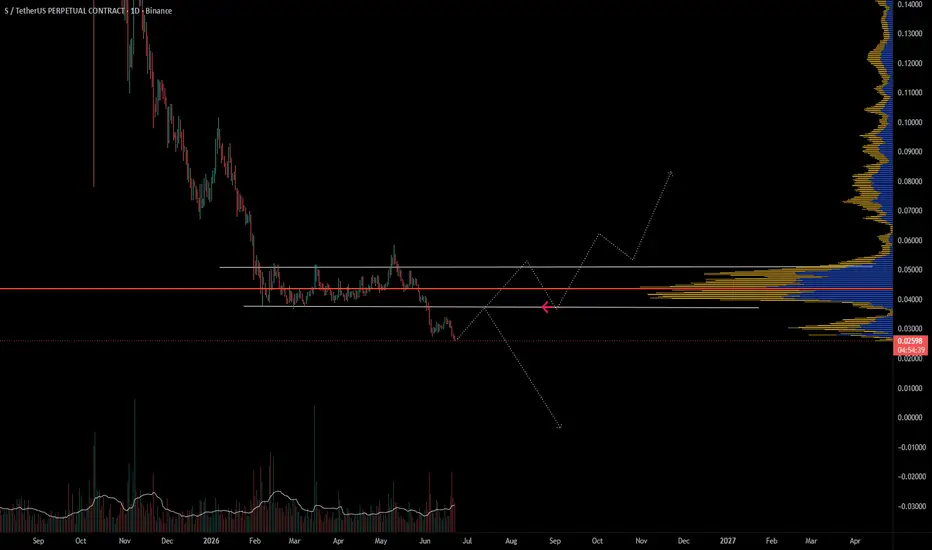
Sonic TA: $S is at a key decision pointSonic remains in a broader corrective trend after a sharp drop from prior highs. Price has broken below its previous consolidation range, so bulls need to reclaim that area to shift momentum.
The main level to watch is the former support zone overhead, which is now acting as resistance. If $S can move back into that range and hold, it would be the first strong sign of recovery.
For now, price is still trading below a heavy volume area, which suggests the market may either need a strong reclaim or one more sweep before a larger reversal can develop. Momentum looks weak overall, but the recent selloff may be starting to lose steam.
Bullish confirmation comes from reclaiming the broken range. Until then, the structure stays bearish and rallies may continue to face rejection.
Sonic is not in breakout mode yet, but it is approaching an important zone where the next larger move could begin. Patience and confirmation remain key.
SUSDT 1D#S is currently trading within a falling wedge pattern on the daily chart and has bounced from the wedge support.
In case of a breakout above both the wedge resistance and the daily EMA50, the following upside targets could come into play:
🎯 $0.04368
🎯 $0.05248
🎯 $0.05959
🎯 $0.06669
🎯 $0.07681
⚠️ Always remember to use a tight stop-loss and maintain proper risk management.
Sonic (S) Price Bearish Structure Continues Sonic (S) price action continues to display a strongly bearish market structure, with sellers maintaining firm control across both the higher and lower timeframes. Recent price action has established a new yearly low, breaking beneath the previous swing low and confirming the continuation of the prevailing downtrend.
This breakdown is significant because it reinforces the ongoing pattern of lower highs and lower lows, which remains the defining characteristic of the current market structure. With price continuing to trade below major support levels that have now flipped into resistance, there is little technical evidence to suggest that a sustainable bottom has formed at current levels.
Adding to the bearish outlook is the lack of meaningful support beneath the current trading range. As a result, the path of least resistance continues to favor the downside, with the probability of further weakness remaining elevated.
From a technical perspective, the next major area of interest is the 0.618 trend-based Fibonacci extension, which now serves as a potential downside target should selling pressure continue. A move toward this level would be consistent with the current bearish trend and would maintain the broader market structure that has been in place for an extended period.
Until buyers can reclaim key resistance levels and invalidate the sequence of lower highs and lower lows, SonicS remains firmly bearish. For now, continued downside rotation appears to be the higher-probability scenario, with further price deterioration likely if current weakness persists.
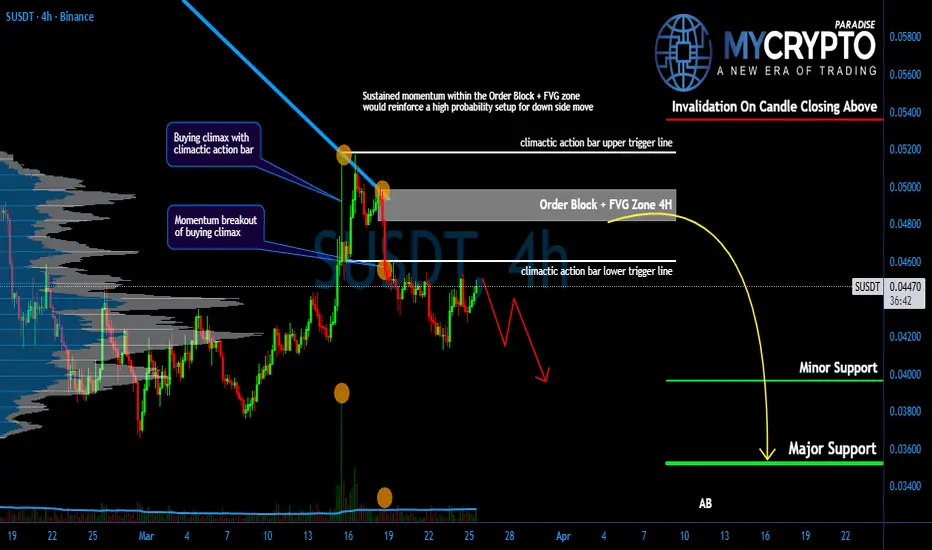
Is Smart Money Quietly Exiting #S Right Now?Yello Paradisers! Are you prepared for a potential sharp downside move on #S, or are you still calling this “just a healthy pullback” while smart money quietly distributes above you? At first glance, the structure may look harmless. But when we remove emotions and read the chart objectively, the story changes completely. This is not a random retracement. This is a high-risk zone where discipline matters more than opinions.
💎#S has formed a very clear buying climax followed by a climactic action bar, which is one of the most important early probability of potential distribution. In simple terms, these aggressive upward expansions often happen when inexperienced traders start chasing price higher out of FOMO, while institutions and experienced market participants begin unloading positions into that strength. This type of behaviour is extremely common before larger corrections.
💎#S has already swept above the upper trigger line of the Buying Climax and then sharply broke below the lower trigger line with strong bearish momentum. This is not a small technical detail. This is a major probability that supply may now be taking control of the market structure.
💎If bearish momentum continues and price confirms weakness around the Climactic Action Bar trigger zone, the next major high-probability downside target sits around the 4300. And if fear begins accelerating across the market, this move could happen significantly faster than the majority currently expects.
💎#S continues respecting the descending resistance trend-line perfectly and has once again failed to reclaim higher levels. This rejection further confirms the ongoing structural weakness in the market.
💎#S momentum has gradually shifted to the downside, while RSI divergence adds additional bearish confluence. These confirmations together significantly increase the probability of continuation lower as long as price sustained momentum with in order block zone. The immediate support level to monitor sits around 4515, which now acts as the first downside magnet if sellers continue dominating short-term price action.
💎If #S manages to break above the key resistance at 5100 with a strong momentum candle, this whole bearish probability would be invalidated, and we could instead see a bullish continuation. As always, we let price confirm our bias.
Discipline is key, Paradisers! The charts may look volatile, but this is where professionals thrive and amateurs panic. Don’t let emotions guide your trades. Wait for clear confirmation and manage risk like a pro. Strive for consistency, not quick profits. Treat the market as a businessman, not as a gambler.
MyCryptoParadise
iFeel the success🌴
SUSDT: Trend in daily time frameThe color levels are very accurate levels of support and resistance in different time frames.
A strong move requires a correction to major support and we have to wait for their reaction in these areas.
So, Please pay special attention to the accurate trend, channels, colored levels, and you must know that SETUP is very sensitive.
BEST,
MT
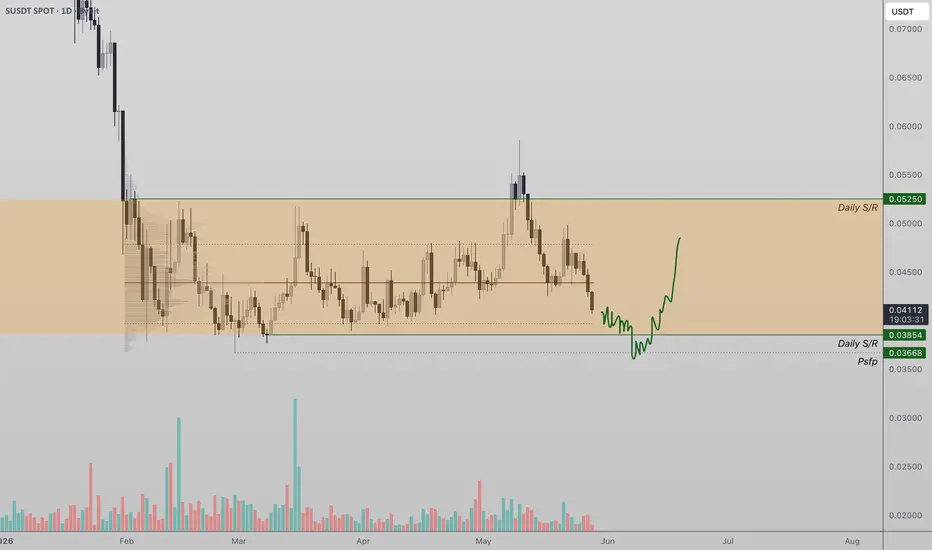
Sonic Price Appraches Key Support Sonic (S) price action continues to trade within a rotational market structure, moving between key higher timeframe support and resistance levels. Recent price action has shown weakness after losing acceptance above the point of control, with the market now trading below this key level and beginning to rotate toward the value area low. This shift suggests that sellers currently have short-term control as price continues its broader range-bound auction.
From a market structure perspective, a move into the value area low would confirm a full market auction rotation from the higher end of the range back toward major support. This region now becomes the most important technical level to monitor in the immediate short term. Holding the value area low on a closing basis would increase the probability of price stabilizing and rotating back toward higher resistance levels within the range structure.
However, failure to hold this support region could significantly weaken the current structure and open the probability of a deeper corrective move developing. A breakdown below the value area low would suggest that bearish momentum is beginning to expand beyond simple consolidation.
At this stage, Sonic remains rotational overall, with no confirmed directional breakout yet established. The next major move will likely depend on whether buyers can defend the value area low or whether sellers force a continuation lower.
SUSDT Compression Above PMH — Surfing the 10/20
SUSDT is showing a clean higher-timeframe continuation structure after breaking above Prior Month High.
The key detail is that price is not just sitting above PMH, it is compressing above that level while surfing the daily 10/20 EMA. That keeps this on watch for a potential continuation move if participation returns.
HTF Context:
On the daily, SUSDT has been coming out of a larger downtrend and is now starting to show a change in behavior.
Price broke above Prior Month High and has continued to build structure above it instead of immediately rejecting back below. That is the first sign of acceptance.
The second important detail is the daily 10/20 EMA surf. Price is tightening while the short-term averages catch up underneath, which means the setup is no longer just an extended impulse. It is starting to build value above a major HTF level.
That is the type of context I want to see before looking for continuation.
LTF Structure:
On the 1H, price had the initial expansion through the PMH area, pulled back, and is now holding the breakout zone.
The pullback has been controlled so far. Price is still above the key level, still holding the higher structure, and still consolidating near the upper portion of the move.
Current sequence:
Breakout above PMH
Acceptance above the level
Pullback into structure
Compression while EMAs catch up
Potential continuation if participation returns
Cycle Position:
This looks like a Base & Break continuation setup forming after the first expansion leg.
The first impulse already happened. Now the market is deciding whether that move can turn into a broader continuation phase.
The cycle read:
Reversal Extension complete
Crossback / reclaim
HTF compression above PMH
Potential Base & Break continuation
Scenarios:
🟢 Continuation
For continuation, I want to see price break the local compression and start accepting above the current short-term highs.
The clean version would be:
Daily continues holding the 10/20 EMA
PMH remains accepted
1H holds higher lows
Volume expands on the break
Candles close near highs
Price starts pushing toward the next HTF resistance zone
Upside areas I’m watching are 0.05017 first, then 0.05161 / 0.05216 / 0.05409 / 0.05486 if momentum expands.
🔴 Failure
The failure scenario is a loss of PMH acceptance.
If price loses PMH and cannot reclaim it, the setup weakens. That would suggest the breakout was not true acceptance and participants are no longer defending the higher structure.
Warning signs:
Loss of PMH
Loss of daily 10/20 EMA surf
LTF lower highs forming
Failed breakout above compression
Heavy rejection wicks into resistance
Execution Mindset:
This is not a chase setup.
The idea is to wait and see whether the compression resolves higher with participation.
Trigger: Break above the local compression / 1H highs
Confirmation: Acceptance above the break with volume expansion
Support: PMH holding as the key HTF level
Invalidation: Loss of PMH and failure to reclaim
Best entry style: LTF compression, bull flag, or reclaim after the break
Closing Line:
SUSDT has the right ingredients: HTF reclaim, acceptance above PMH, daily compression while surfing the 10/20, and a lower-timeframe base forming after the first expansion.
Now the question is simple:
Does this compression resolve into continuation, or does PMH acceptance fail?
Not a signal. Just how I’m reading structure and participation.
Sonic Token Tests Key Fibonacci Resistance, Rejection Risk BuildSonic Token is currently approaching a critical decision point as price action tests the 0.618 Fibonacci retracement, a level often associated with strong resistance in corrective structures. Despite the recent push higher, the move is occurring on relatively low volume, raising concerns about the strength and sustainability of this rally.
Key Highlights:
- Price testing 0.618 Fibonacci resistance 🔺
- Low volume on the move higher signals weak conviction ⚠️
- Loss of Value Area High (VAH) could trigger downside rotation 📉
From a technical perspective, the lack of strong bullish volume suggests this move may be more of a liquidity grab rather than a true breakout. When price approaches a key Fibonacci level without sufficient volume backing, it often leads to rejection, especially within a broader range-bound environment. This aligns with the current structure, where Sonic Token continues to respect its established trading range.
If price fails to hold above the Value Area High, it would confirm acceptance back within the range. This scenario increases the probability of a rotation towards lower support levels, potentially revisiting the Point of Control or even the range lows. Traders should remain cautious here, as this region often acts as a turning point.
Overall, unless strong volume steps in to support a breakout above the 0.618 level, the bias leans toward a rejection and continuation of the broader consolidation range.
Sonic (SONIC) Weak Structure — $0.03 in FocusSonic price action is showing clear signs of weakness following its recent pump, with momentum beginning to fade and structure shifting bearish. Despite the initial surge, the move lacks sustained bullish volume, which is often a key requirement for continuation in trending markets.
The absence of strong follow-through buying suggests that the recent upside may have been driven more by short-term speculation rather than genuine demand. As a result, price is now at risk of rotating lower as the market seeks stronger areas of support.
From a structural standpoint, the next key level to watch sits around the $0.03 region, where previous support and potential demand could come into play. This zone will be critical in determining whether price can stabilize or continue its decline.
If bearish pressure persists, a move toward this level becomes increasingly likely. However, the reaction at $0.03 will be the deciding factor. A strong bounce supported by volume could signal a temporary bottom and potential reversal, while a weak response would open the door for further downside continuation.
For now, Sonic remains in a corrective phase, with the market leaning toward a lower support retest before any meaningful recovery.
S Distribution in Play – Downside Risk Building...!Yello Paradisers! Are you watching what smart money is doing on #S right now, or are you about to get trapped in the next downside flush? At first glance, this move may look harmless. Many inexperienced traders see “just a pullback.” But when we read the structure correctly, the chart is telling a completely different story and this is definitely not the place to trade emotionally.
💎#S has formed a classic buying climax followed by a climactic action bar. This type of behaviour typically shows distribution. In simple terms, institutions use these aggressive upward spikes to offload their positions into retail buying pressure. When the majority feels confident, smart money is quietly exiting, preparing for a potential downside move based on volume spread analysis.
💎#S has already broken below the lower trigger line of the buying climax with a strong momentum candle and is now retesting that area. This is a critical sign of weakness. When price fails to hold above such key levels, it confirms that supply is in control. If bearish continuation follows through, the next major downside target sits around 3525, aligning with a key Fibonacci level as well. This move could happen faster than most traders expect.
💎#S price has respected the descending resistance and failed to break above it. That rejection confirms ongoing structural weakness. Overall structure of the market is also bearish adding more weight for downside probability. As long as price sustained momentum within the order block and FVG Zone 4H, the probability favours continuation lower toward the minor support around 3960.
💎If #S manages to break above the key resistance at 5360 with a strong momentum candle, this whole bearish probability would be invalidated, and we could instead see a bullish continuation. As always, we let price confirm our bias.
Discipline is key, Paradisers! The charts may look volatile, but this is where professionals thrive and amateurs panic. Don’t let emotions guide your trades. Wait for clear confirmation and manage risk like a pro. Strive for consistency, not quick profits. Treat the market as a businessman, not as a gambler.
MyCryptoParadise
iFeel the success🌴
Sonic Price Aggressive Sell Pressure Sonic price action is currently experiencing continued aggressive selling pressure, with the market approaching a critical inflection point. The Value Area Low (VAL) is now at risk of being lost, which is a key structural level within the current range.
From a technical perspective, losing the VAL would signal acceptance at lower prices, often leading to an expansion move to the downside. This increases the probability of a capitulation-style move toward untapped daily support, where liquidity is likely resting.
So far, price action reflects a weak market structure, with sellers maintaining control and buyers showing limited strength. The inability to hold key support levels suggests that the current environment remains fragile.
However, despite the bearish pressure, Sonic is still technically operating within a broader range structure. Until a decisive breakout occurs, the market is likely to continue rotating between key levels.
The next significant move will be driven by volume expansion. A surge in bullish volume could support a reclaim of lost levels, while continued bearish volume would confirm downside continuation.
For now, Sonic remains range-bound with downside risk, and traders should watch closely for a break of VAL, which could trigger the next major expansion.
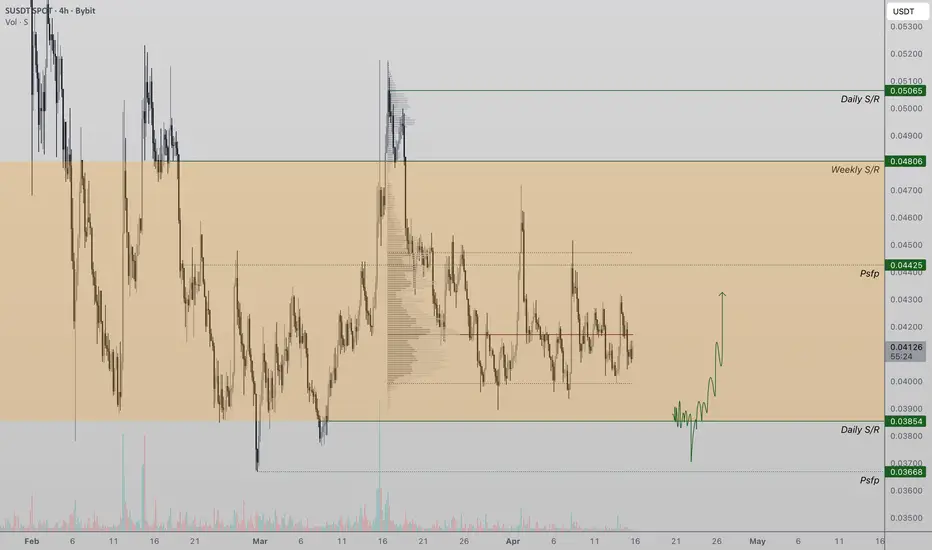
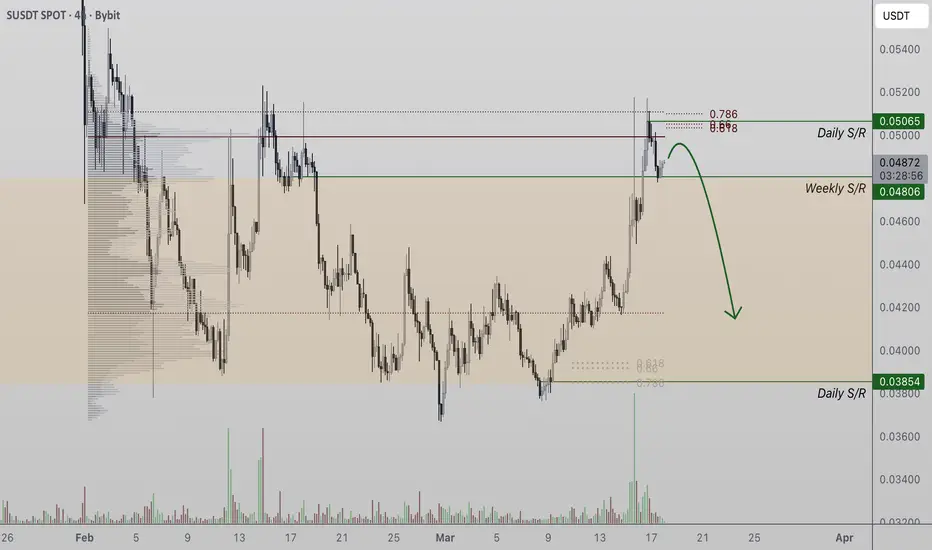
Sonic Price Remains Range Bound Sonic price action has recently experienced a clear technical rejection from a key confluence zone, where the 0.618 Fibonacci retracement aligned with the Point of Control (POC) near daily resistance. This area acted as a strong supply region, leading to a decisive shift in momentum toward the downside.
Following the rejection, price has now broken below weekly support, which is a significant structural development. More importantly, price has found acceptance back within the previous trading range, indicating that the market has transitioned back into a rotational environment rather than trending.
From a technical standpoint, this breakdown opens the probability of a full rotation toward lower daily support levels. This move would likely coincide with a loss of the Value Area Low (VAL), further confirming bearish pressure and acceptance at lower prices.
Market structure currently remains range-bound, with no clear signs of bullish continuation. The rejection at resistance and breakdown of support suggest that sellers are in control in the short to medium term.
As a result, Sonic is likely to continue rotating within this range over the coming weeks and months, with downside levels being tested unless key resistance zones are reclaimed with strong volume.
Sonic (SUSDT) Update, Range Rotation?Sonic (SUSDT) is currently trading below the Point of Control (POC), a key level that aligns with the 0.618 Fibonacci retracement, creating a strong zone of technical confluence. Price action is attempting a bullish retest of weekly support, but the reaction so far has been relatively weak.
Although we’ve seen a local bounce, it has occurred on low volume, which raises concerns about the strength and sustainability of this move. In market structure, volume is a key confirmation tool—without it, bullish attempts often lack conviction and are prone to failure.
This current setup suggests that while buyers are attempting to defend the level, there is insufficient participation to drive a meaningful breakout above the POC. If volume does not increase in the short term, the probability shifts toward a rejection from this region.
A failure to reclaim the POC and hold above the 0.618 Fibonacci level would likely result in continued range-bound behaviour, with price rotating back toward lower support zones within the broader structure.
Traders should closely monitor volume expansion at this level, as lack of demand may trigger further downside, continuing the overall rotational nature of Sonic’s current trading range.
SUSDT Multi-Month Downtrend + Accumulation Zone ApproachingSUSDT showing price action moving firmly in a descending channel since February 2025 highs with previous peak formed at ($0.9176 → $0.6196 → $0.3053).
Price rejected multiple times at descending resistance
Recent drop formed wave 1-5 structure lower
Price now approaching key accumulation area $0.032–$0.04 as shown on the chart
Bullish case: Hold accumulation zone → reversal toward 0.14975 or higher channel retest.
Bearish risk: Breakdown below 0.04668 opens lower extension.
Bias: Watch for reversal signs at accumulation, this will give high R:R long setup possible.
Sonic Attempts Market Structure Shift — Bullish RSI Divergence Sonic (S) price action is currently trading near the value area low, where a clear bullish RSI divergence has formed. While price recently printed lower lows, the RSI has begun forming higher lows, signaling that bearish momentum may be fading.
This divergence is often seen during the late stages of a downtrend when selling pressure begins to weaken and buyers start stepping in. As a result, Sonic is now attempting to shift market structure as the current rally develops from this key support region.
A critical level to monitor is the $0.03 support zone, which has now emerged as a strong technical level on the chart. As long as price continues to hold above this support and respects the 0.618 Fibonacci retracement, the probability increases for a corrective rally.
If buyers maintain control above this level, the next logical upside target sits at the high-timeframe resistance near $0.04.
Failure to hold the $0.03 support would invalidate the bullish setup and suggest that bearish momentum remains dominant.