SWARMS/USDT H2: Strong bearish trend in the absence🎯 TP1: $0.006663 (+2.72%) │ TP2: $0.006436 (+6.03%)
🛑 SL: $0.007397 (-8.00%) │ R/R: 1 : 0.75
⚠️ Stop is wider than TP2 target (R/R < 1) — the closer target is hit more often, but adjust position size according to the stop
FUNDAMENTAL BACKGROUND
SWARMS continues to move in line with the broader crypto market, lacking its own drivers. The Fear Index (35) confirms investor caution. Yesterday's US PPI added pressure to risk assets, including altcoins. The Fed's decision on 16.09.2026 remains a key
In-depth trading ideas
SWARMS BREAKING OUTSWARMS smashing out of its long-term downtrend on the higher timeframes, technicals firing on all cylinders with pure bullish conviction. This isn't some weak fakeout, price action is screaming reversal potential, but only if technicals backs it and no higher resistance caps the move. Eyes locked, size controlled, risk managed or sit this one out before it turns on the late crowd
SWARMUSDTP Daily Reversal & Compression at HighsSWARM has already put in a strong expansion off the lows, and now price is spending time near the highs instead of fully giving it back. That usually matters because acceptance after expansion is what keeps continuation in play.
HTF Context:
On the daily, this looks like a reversal extension that has transitioned into a real push higher. Price reclaimed the short-term trend measures and participation improved on the move up. The bigger picture is no longer about catching the bottom — it is abou
SLong
swarms · High volume bullish continuationThe October 2025 crash has been fully recovered on SWARMSUSDT. After this recovery, now we are seeing an increase in bullish momentum.
First, all gains were being maintained. Next, a bullish continuation supported by high volume and increasing momentum.
The low? 6-February 2026.
The rounded bottom (cup) pattern on the chart is the space that is likely to never be visited again. The current range is where support will be found on any strong correction in the future or long-term bear market.
SWARMS/USDT - Continuation The first buy setup delivered an impressive +92% profit, and now the chart is setting up for round two. Price structure is showing renewed bullish momentum, preparing for another leg toward higher levels. With buyers stepping back in and key supports holding firm, the stage is set for continuation toward fresh highs.
SWARMS Breaks Out of Descending ChannelSWARMSUSDT has been trading within a descending channel since February, with price consistently respecting both the upper resistance and lower support trendlines. Recently, the market broke above the channel’s resistance with a strong bullish candle, backed by a noticeable increase in buying volume. Once the breakout confirms, we can expect a 150%- 500% move in the coming weeks.
Resistance 1: $0.040
Resistance 2: $0.075
Resistance 3: $0.16
Support level: $0.017
Cheers
Hexa
swarms · Opportunity Buy Zone · 1,100% - 4,700% Growth PotentialI like it. It might not look like it but this is a great chart. SWARMSUSDT is trading at bottom prices within the accumulation zone but with the possibility that the bottom is already gone. That is, no new shakeouts or lows. From here on, growth.
There was a low in April followed by a lower low in June. The lower low in June was nothing more than a liquidity hunt event. There is no real depth on that last low. Seeing how SWARMSUSDT is now trading back above support (the April low), opens up man
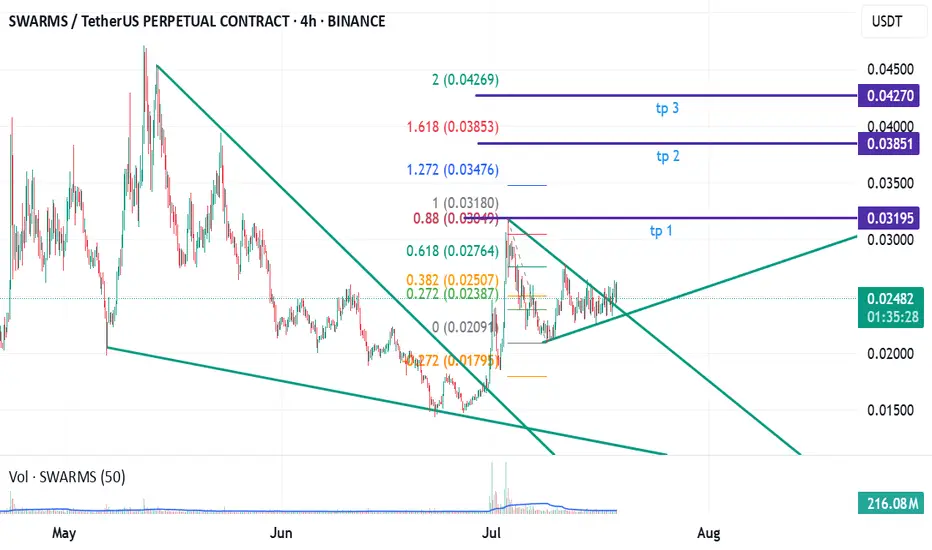
swarms is COMING! continuation triangle breakoutafter breakout from falling wedge, the continuation pattern is forming symmetrical triangle in the past 1 month.
today is the day, he is just breakout from symmetrical triangle.
watch out for the pump.
may do a retest on saturday.
try to seek for entry when market is low volume if have minor pullback.
tp 1: 0.3195
tp 2: 0.3851
tp 3: 0.4271
give me a like and boost or send me a gift if u like mine ideas.
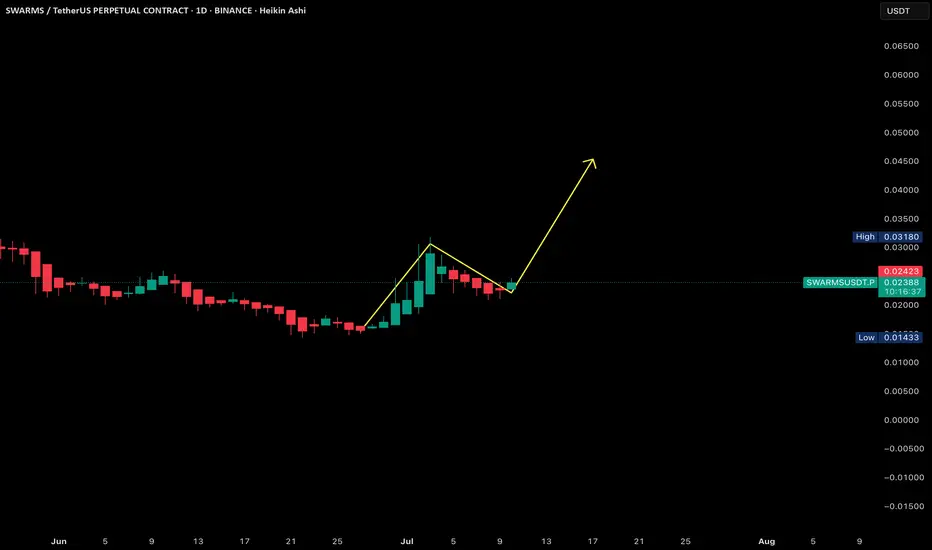
SWARMSUSDT.P - LONG RecommendationSWARMSUSDT.P - LONG Recommendation
Peak Tracking: Daily timeframe (D1)
Entry: Around current price: $0.02425
Fixed Target: $0.045 or follow D1 peak signals to exit positions.
Reasoning: The D1 timeframe correction has completed, signaling potential for a new peak.
Strategy: Enter position incrementally, allocating capital based on D1 peak cycles.
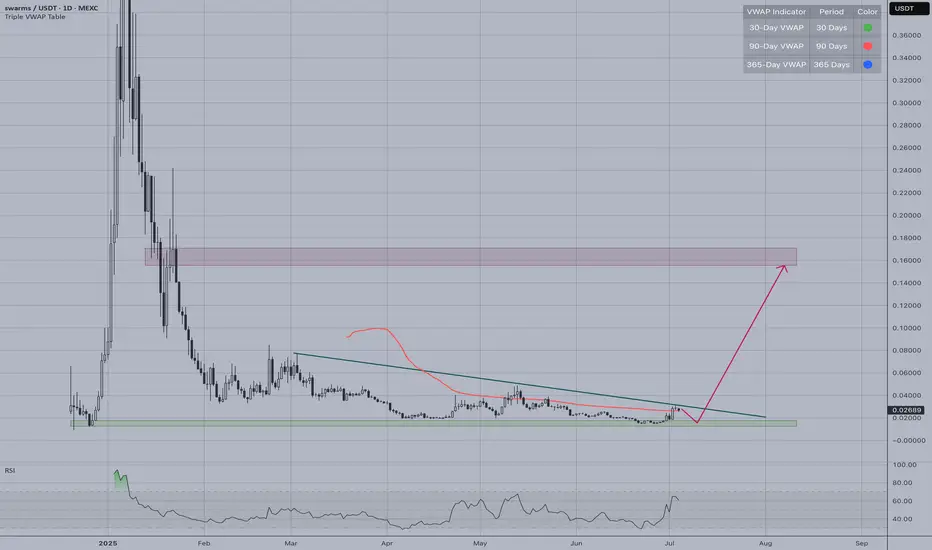
SWARMS | High Risk Microcap PlayThe AI agent token SWARMS presents a compelling bullish opportunity after breaking above its long-term descending trendline.
Entry Options:
Option 1: Aggressive entry on trendline break confirmation around $0.027
Option 2: Conservative entry on pullback to green support zone near $0.02
Targets & Risk:
Target Zone:
Pink resistance box around $0.16-$0.18 (500%+ upside potential)
Stop Loss:
Below $0.02 to invalidate breakout
Risk Considerations:
Microcap volatility requires careful p
SWARMS/USDT buy setupAfter a prolonged downtrend since its listing on Binance, SWARM/USDT has dropped over 97%, forming a long accumulation base. The price has now broken out of the daily trendline, signaling a potential trend reversal.
Entry Zone (DCA): Green Box
Breakout Confirmation: Daily trendline breakout
Potential Move: Preparing for a strong upward leg after deep correction
ideal for strategic DCA entries.
SWARMS Is Bulish (12H)A key flip zone on the SWARMS chart has been reclaimed.
The trigger line has been broken, and we have a bullish CH (Change of Character) on the chart.
As long as the flip zone holds, price may move toward the identified targets.
A daily candle close below the invalidation level would invalidate this analysis
Do not enter the position without capital management and stop setting
Comment if you have any questions
thank you
Swarms further dump to $0.02448 Swarmsusdt short
Target: $0.02448
Stop: $0.03 or higher
Roughly 2.5R
Expecting further drop as we approach weekly closure.
SShort
SLong
SWARMS/USDT Analysis: Continued DeclineThis asset continues its downward movement. A strong volume cluster has now formed, allowing for position building and participation in further movement.
We consider the $0.0287–$0.0302 zone as a short opportunity upon its retest, provided there is a seller reaction.
If no reaction occurs and price consolidates above this zone, we will view it as a mirror support level.
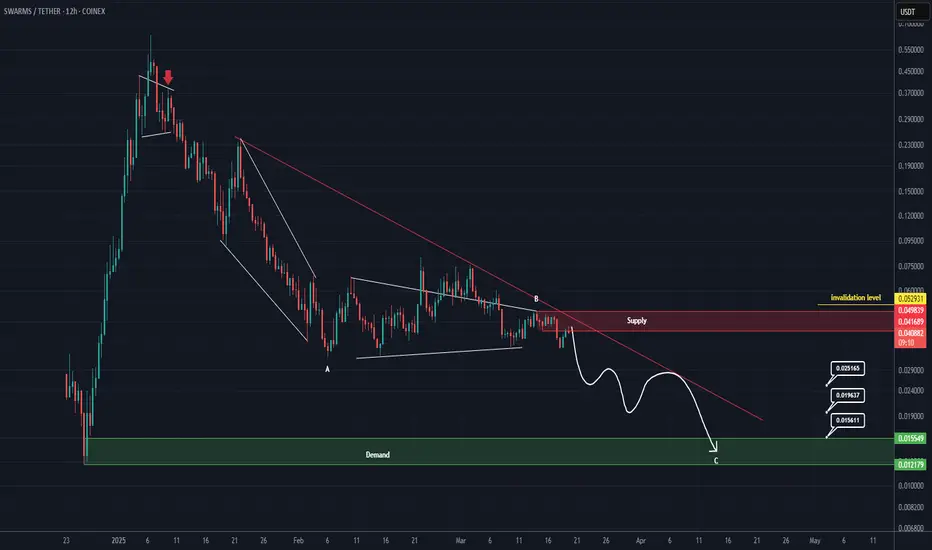
Short opportunity for SWARMS (8H)The correction of SWARM has started from the point where we placed the red arrow on the chart.
It appears that wave B has just completed, and the price is currently forming a pivot for another drop.
We expect to enter wave C soon, with the price moving towards the targets.
The closure of a daily candle above the invalidation level will invalidate this analysis.
For risk management, please don't forget stop loss and capital management
When we reach the first target, save some profit and then