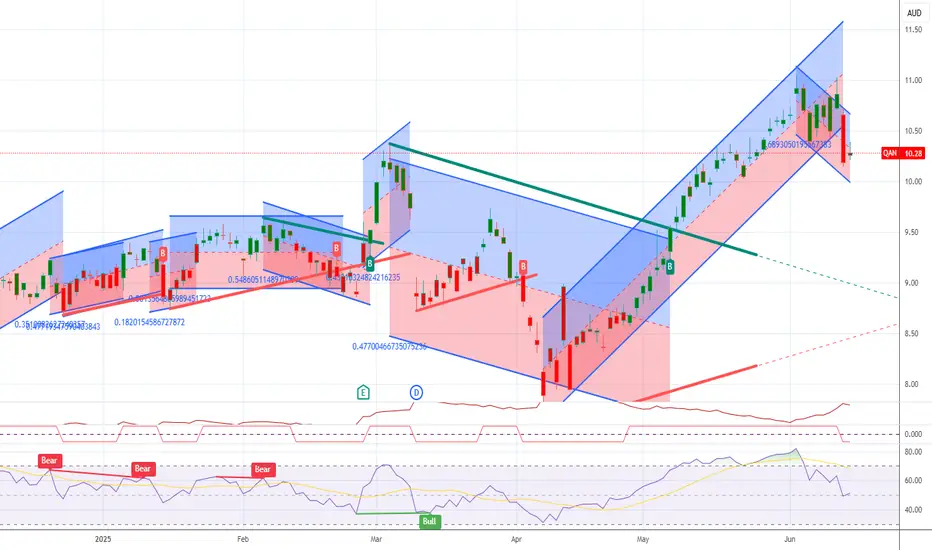
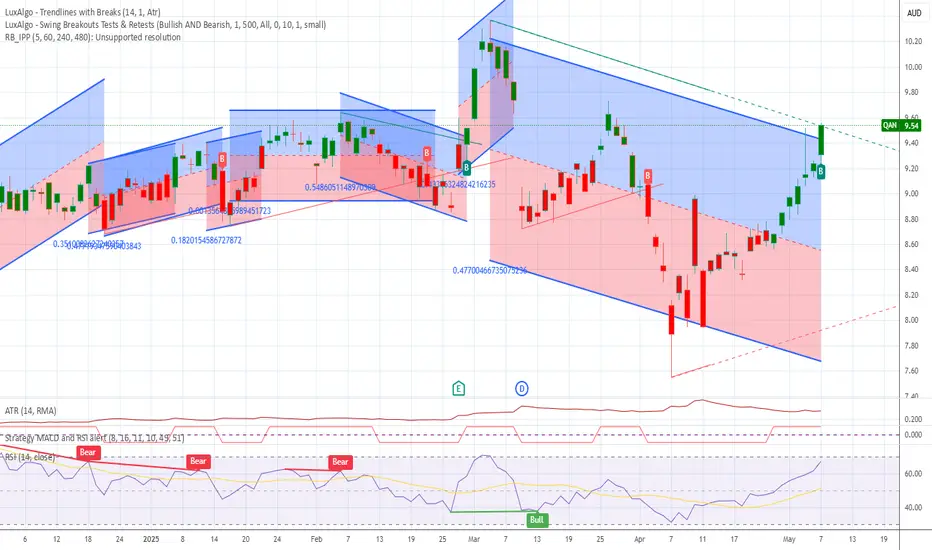
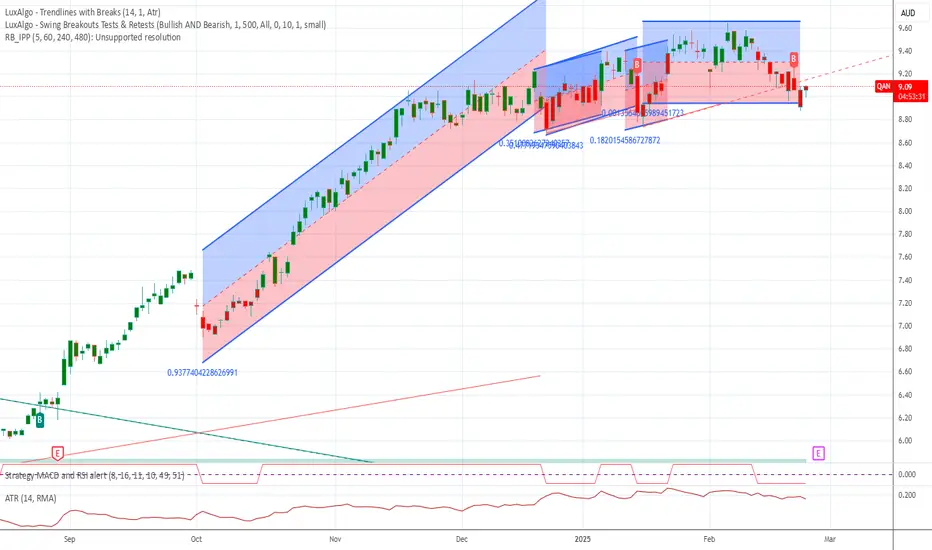
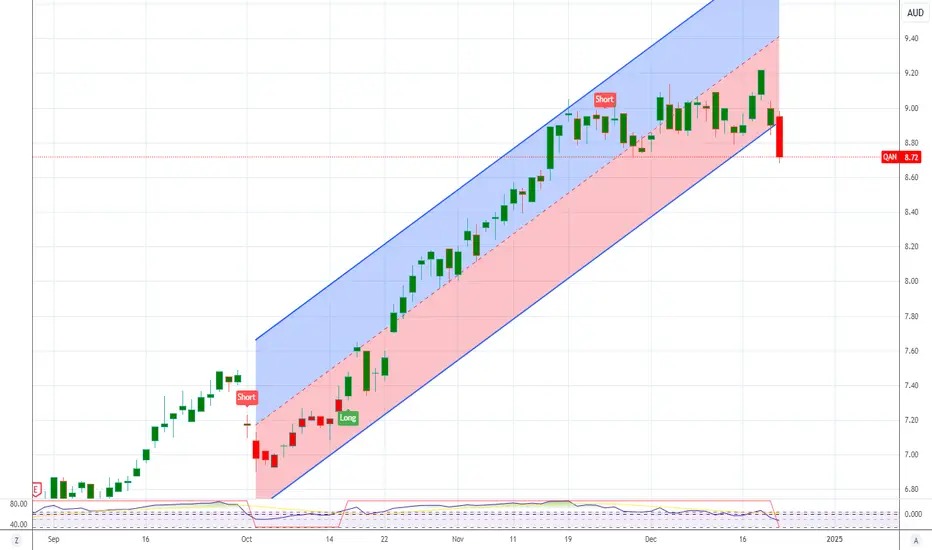
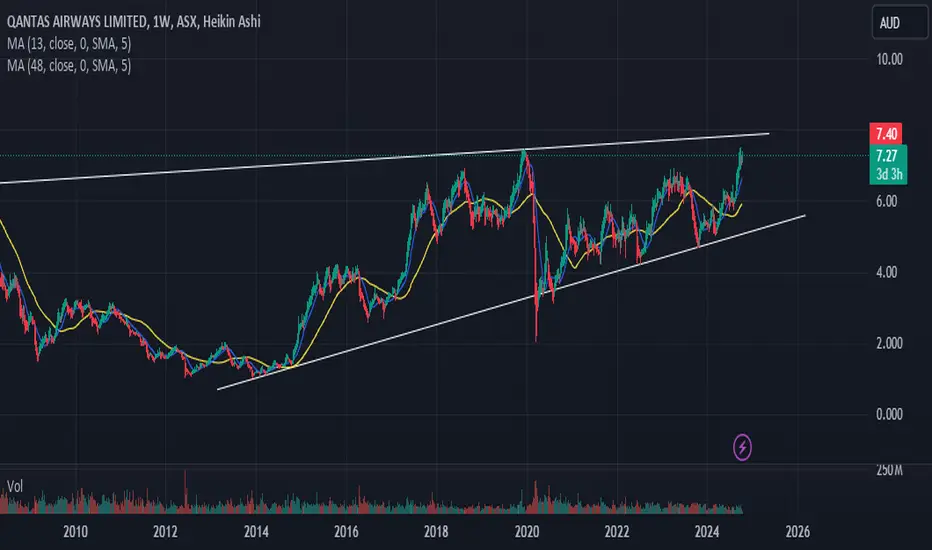
QAN - Triangle Breakout This triangle that has formed will likely lead to further upsides
The vertical lines show the beginning, middle and end of the large structure forming, id like to call this a inverted head and shoulders on a really big timescale
Bull run until the timeframe of the left shoulder is equal to the right shoulder
Weekly timeframe
In-depth trading ideas
ASX:QAN - 13 AUG, 2025 - ELLIOTT WAVE ANALYSISConclusion: Wave 5)-blue could move higher.
Key Points: Wave 4))-purple ended at 7.55 and wave 5))-purple has been moving higher since then. It is subdividing into wave 1)-blue to wave 5)-blue. Now wave 5)-blue is extended and subdividing into wave 1-red to wave 3-red.
Basically its wave 3-red will move higher, targeting targets around 11.90 - 12.68.
While price must remain above 10.63 to keep this Bullish view valid.
QANTAS - Rising Wedge -Weekly chartCan buy for short term at CMP. But need to sell it at the top line. High chances of falling down in upcoming weeks/months after touching the above line. Chance of going down by breaking the lower line is also possible. If in that can see a good correction in Qantas - nearly 30%.
Cheers!
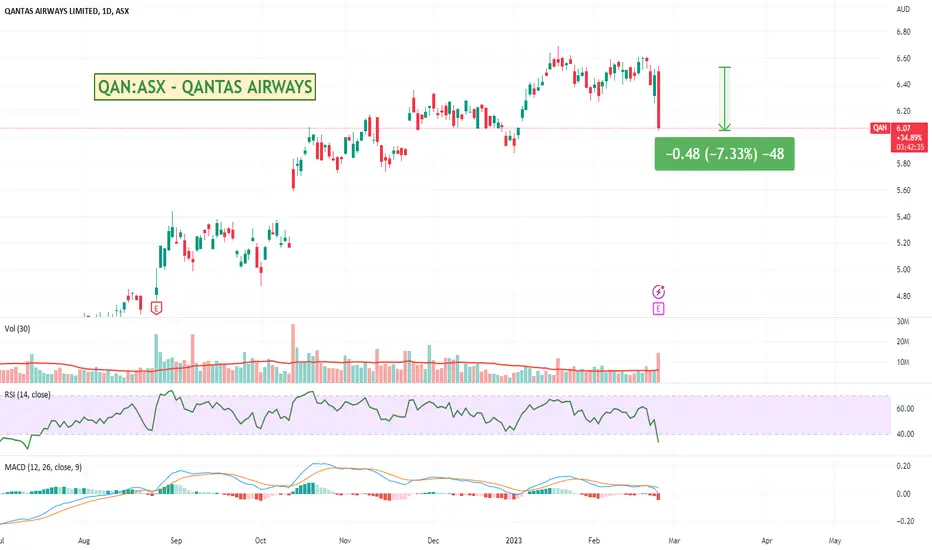
Australia Qantas Announces Great Results. Price drops 7%.Qantas has announced an interim underlying pre-tax profit of $1.43 billion in its first return to profitability since the coronavirus pandemic started. The airline's record first-half result was at the top end of its forecast , with revenue of $9.9 billion. All segments of its business turned profitable during the half year, led by Qantas Domestic, which recorded $785 million in earnings before interest and tax. Qantas expects travel demand to continue driving the recovery in 2023 and 2024, w
QAN @ 9 NOV 2021Text me if you have any questions/comments for me.
-----
QAN
- Previous analysis was done on 26 Oct (red arrow) - Suggested waiting for a successful rebound at 5.80 levels before plotting entry
- Since then, the stock has successfully recovered and looks to be trading at a resistance
- Another retracement from here would create a strong Triple Top resistance
- R is borderline 10%
- Strategy-to-buy (DYOR) – Suggest entry at current levels if believe that breakout will be successful
QAN @ 26 OCT 2021Text me if you have any questions/comments for me.
-----
QAN
- Previous analysis was done on 26 Aug (red arrow) - Suggested waiting for a series of HHs and HLs to form before plotting entry
- Since then, the stock has created a series of HHs and HLs
- A support zone is forming at 5.50 levels –> a successful rebound to around 5.80 levels would strengthen the support zone
- R is less than 10%
- Strategy-to-buy (DYOR) – Suggest waiting for a successful rebound before plotting entry
QANTAS LEVELSfor dad, mapped out important levels on the chart of QAN:ASX
- blue lines are areas where the price “gapped” up or down historically, also proved to be resistance for an entire year across 2015-2016, also made way for the recent bounce off the top of this range last month
- green lines are resistance/support that has been respected multiple times in the trading history of Qantas shares in 1999, 2002, 2017. Price is sitting just under the upper green line meaning it may want to return to the lo
QAN - Is the pullback Over?QAN had been retracing lower since the last two months and have found support just at the lower edge of the Parallel Channel (Trendline) ($4.40 - $4.50 Zone), coupled with Above Average Volume and a MACD Cross. It has retraced to exact 50% Fib Retracement and is showing some Bullish Price Action. This Bullish price action off Support suggests that the current pull back may be over and it could move higher to towards the Strong Resistance Zone of $5.20 - $5.30 for a potential 10% gain.
Please n
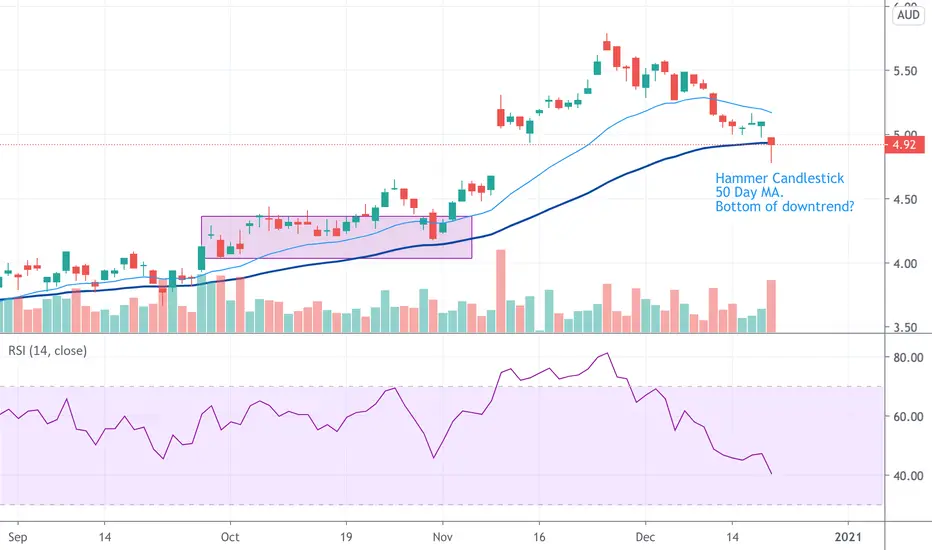
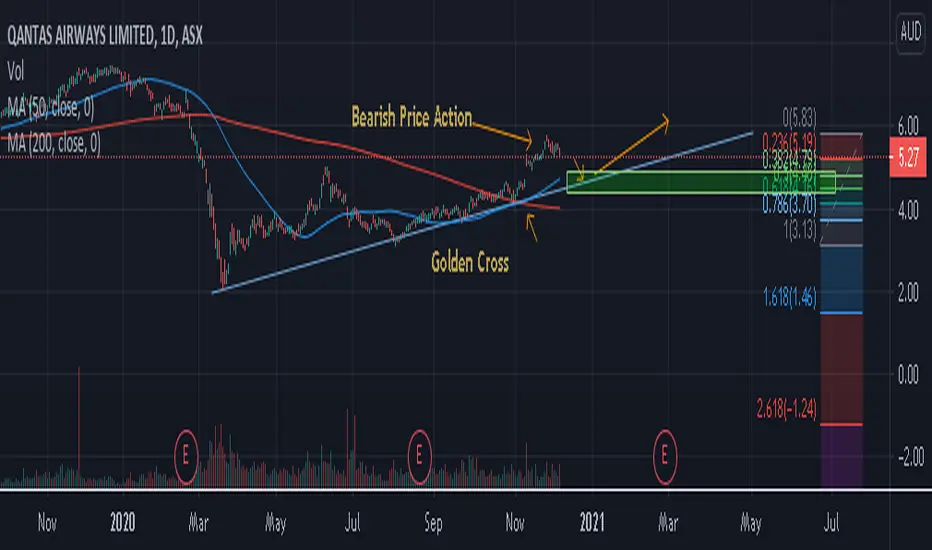
QAN - Nothing goes up in a straight line - Buying Opportunity QAN - another stock to suffer during the pandemic, but recent price action has confirmed a reversal by rocketing upwards and forming a higher high.
1. Price has formed a higher high
2. It has formed a Golden Cross
3. Recent sessions' price action, (Bearish Candles) indicates a pullback
4. I will be confident to buy in the $4.97 - $4.49 region (Buy Zone) as it is the 50% Fib Retracement Zone.
5. There is a gap window between 4.95 - $4.68 region (another confluence of Support)
6. There is a tren