How did you perform for the first half of 2026?A rough guide to see where your portfolio stands if you invested in Asia over the last 2 years.
Yes, both South Korea and Taiwan are mainly lead by 1-2 companies with exceedingly good performance!
It is one thing to diversify and it is also important NOT to spread oneself too thin and wasted ammunition and awaits empty hope and promises that it will turn around in time to come.
Please DYODD
Straits Times Index
No trades
No trades
In-depth trading ideas
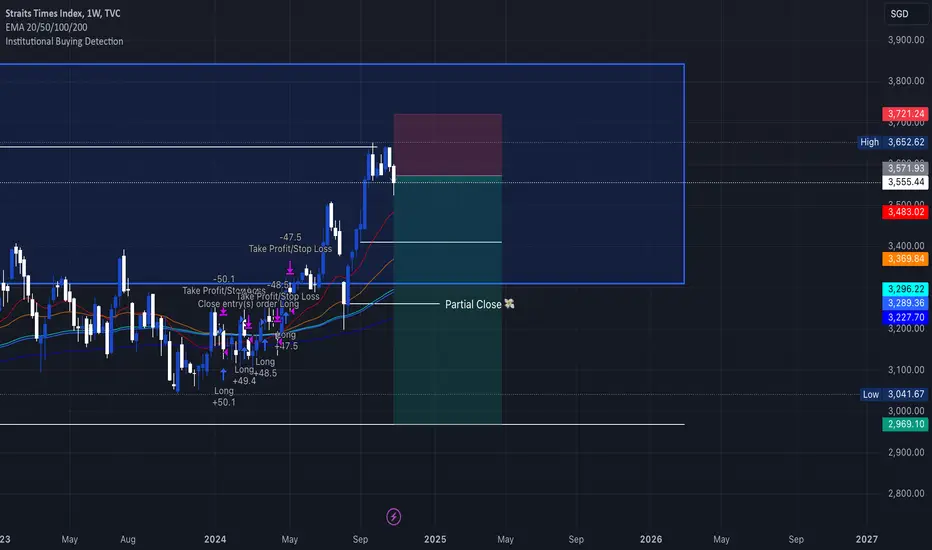
A new dawn awaits the Singapore Stock Market, STIWow, this is going to be making history! Since the late 90s to now, we have finally break the 4000 price point. Question is will it continue to rally higher and break out of the channel?
With the 3 local banks taking a lion share of the index and they have been enjoying a superb rally more than 12-14 months , a pull back will be expected. The SG government is now putting more attention to this stock market and wanted to attract more foreign companies to list here.
So, on hindsight, even a bor
Strategy: Propnex has the potential for a special dividendThe Singapore market remains supported by strong financial sector earnings.
We continue to favor property-related and transport stocks, which have more resilient earnings growth.
Banking sector remains a stronghold, while industrial REITs and logistics-related stocks face pressures.
Our Alpha Picks strategy focuses on selective, high-quality names with clear earnings visibility and defensive characteristics.
Additions:
PropNex (PROP SP)
PropNex is expected to benefit from sustained property dem
The STI has reached its 16 years high.....Closer to home, we also witnessed an all time high for the Singapore stock market. The last time it hits 3573 price level was in 2007, almost 16 years ago.............
With the banks taking up close to 50% of the index, it is also evident from the chart that DBS bank has been rallying 2016 till its current price of 37.60........ It could continue the rally and climb towards 40 or even higher........
I am a little concerned with the rate hikes for the remaining months and 2025 onwards..... This
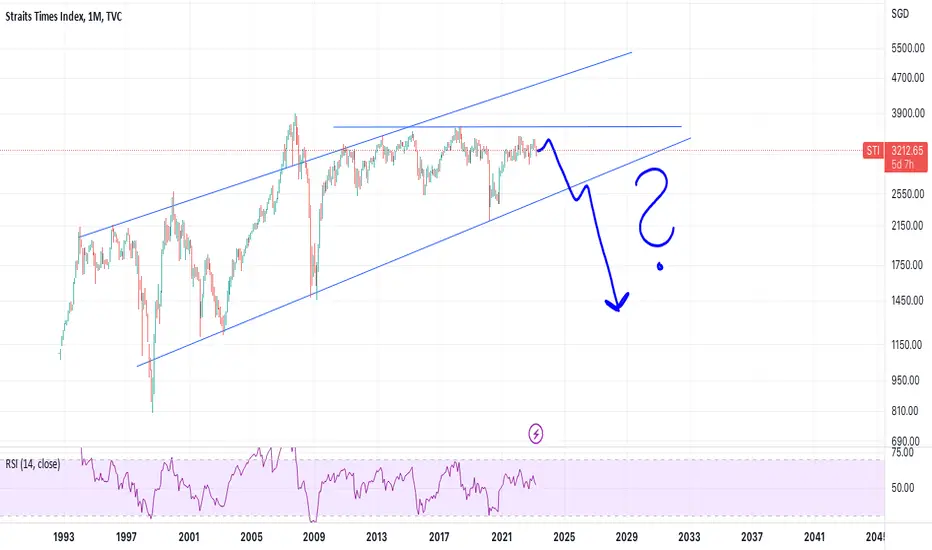
STI: Possible topping in '24-'25 ??Interestingly, the wave relationship fitted nicely from 1999 to 2008 where wave 'a' was equal to wave 'c' to form the primary wave A(red). Wave C @ 0.618 of wave A from wave B projects towards 3877 together with other minor clusters in that range suggesting a probable resistive band. A 3-4 year cycle is also present which suggests year 2024 and 2025 likely.
Buy the dip for STINow with the ongoing war between Russia and Ukraine, will the Feds still consider the interest rates hike ? Will this war escalates the already skyhigh inflation rates further ?
Or perhaps the Fed will use this news and temporarily halt the rates hike ?
STI is still on a bullish move and I see this dip as a buying opportunity. How about you ?
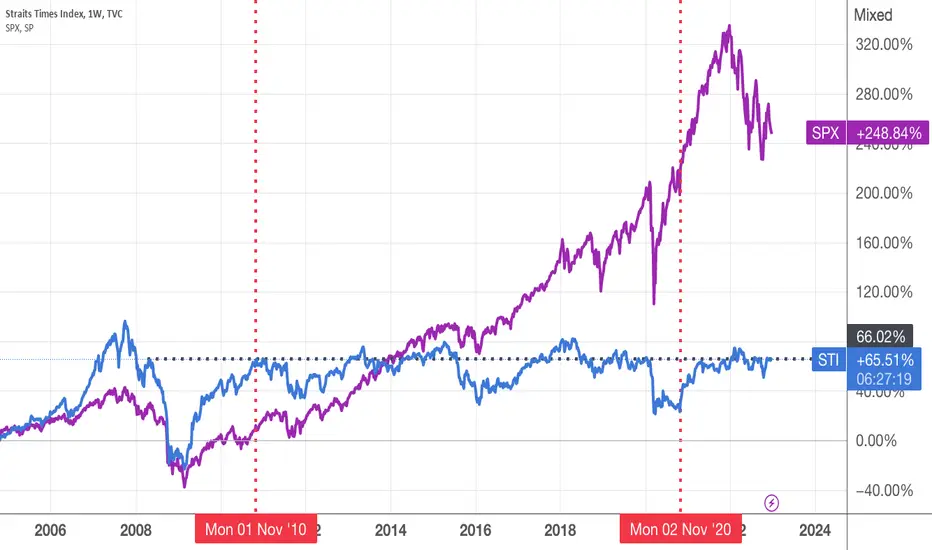
Is it difficult to make money in STI ?Plotting a line graph over this random 10 years period, we can see that if one invest money into the STI, he made a loss of around 26% (if he sells out but breaks even at best if he holds till now).
Conversely, in the same time frame of 10 years, if he would diversify into US and invest in the SPX index (as often encouraged by legendary investor, Warren Buffett), he would make a good profits of 171% profits or roughly 17% per year.
However, it is not really fair to compare this two index sin
STI heading towards 3300 by year end !Those who did not take advantage of STI index when it went down below 3000 , there is another opportunity. Likely, there would be a retracement to the right shoulder towards 3096 level before I think it starts to rally towards 3300 level.
I am bullish on banks, some REITS and a few stocks which I have already covered.
Please DYODD.
STI INDEX - AT INFLUX WITH UPWARD BAISSTI Long term index charts are trading at influx point. Caught in the bull and bear fight index is hovering around 3200 mark. See a reverse head and shoulder pattern appearing on the long term charts which may unfold in next few months when the neckline is confirmed breakout. This is a long term chart so view is mid to long term. Since STI index has over 40% weightage of 3 large banks hence any rally should be supported by banks moving higher. Likely trigger may happen when there is pause in FED
STI Sneak Peek Noted the current Double Top formation on the STI (Straits Times Index, Singapore)
Oddly, 4 April was the advanced marked date for a top (hence, red time line).
Previous marked dates (thing lines) and forward marked dates (thick dotted lines) are there. It is intriguing to see the uncanny accuracy over the years.
STI RESUMES UPTREND, TARGETS 3442The STI resumes UPTREND in the short term from the long signal at 170322 at 3299. A break of the weekly pivot at 3442 to the upside will confirm a bullish multiple uptrend scenario that may test 3641.
LONG TERM UPTREND since 010321
MEDIUM TERM PULLACK since 280222
SHORT TERM UPTREND since 170322
PIVOT 3296
Long positions above 3296 for 3442 and 3641
Short positions below 3296 for 3251 and 2814
10 components of the STI are now in a multiple time frame UPTREND
STI PULLS BACK AND TARGETS 3226A short signal has been issued on 240222 at 3362 that targets the weekly pivot at 3226. A pullback below 3226 will target the monthly pivot support at 2857 which will put the STI back into a broad trading range between 2600 and 3600 since 2009.
The bank rally in DBS OCBC and UOB has stalled with pullbacks to the weekly supports and only 4 component stocks in the STI are in multiply time frame uptrends by the month ending Feb 2022.
LONG TERM UPTREND since 010321
MEDIUM TERM UPTREND since 07112
STI STARTS 2022 WITH AN UPTREND TO 3415/3641A long signal on 040122 at 3168 on the day charts puts the STI on a multiple time frame UPTREND to start 2022. the targets are now illustrated on the monthly charts at 3415 and 3641 respectively.
This uptrend move may break the downtrend drought of the STI since October 2018.
There are only now 6 COMPONENTS in the STI index that are in an UPTREND led by the banks and the property sectors.
LONG TERM UPTREND since 010321
MEDIUM TERM UPTREND since 071120
SHORT TERM UPTREND since 040122
PIVOT
STI HOLDS 2021 GAINS, 3067 KEY SUPPORTThe STI gains 32% from its pandemic lows to close 2021 at 3123.
The short term pullback since 261121 will continue till 3167 is broken to the upside.
Medium term support for further gains is the weekly pivot support at 3067
There are only 2 COMPONENTS in the STI index that are in an UPTREND.
LONG TERM UPTREND since 010321
MEDIUM TERM UPTREND since 071120
SHORT TERM PULLBACK since 261121
PIVOT 3167
Short positions below 3167 for 3067 and 2747
Long positions above 3167 for 3415 and 3641
what will happen to the STI market towards end of 2021?Currently, we are seeing some resistance at the price level.
If the market does correct in US, it is likely that STI will follow suit and we may see some correction. Alternatively, if the US market remains bullish, then it is possible that STI may breach the resistance level and continue to head up.
Short term traders can take profits while those who wish to long be patient and await right opportunity to enter .
STI BREAKS 3183, NEXT SUPPORT 3067The STI broke day Supertrend Support at 3183 and a short signal is issued on 261121 targeting 3067 on the weekly supertrend line. The pullback sits on the congruence of the week Tenken and Kijun lines which will provide mini support in the short term.
The Medium uptrend that started in 071120 last year still provides buyers on the dip.
7 components in the STI constituents are in multiple uptrend.
PIVOT 3256
Short positions below 3256 for 3067 and 2762
Long positions above 3256 for 3273 and
STI UPTREND ON ALL TIME FRAMES AS LONG AS 3183 IS SUPPORT, TARGE7 components of the STI are now in strong UPTREND.
DBS
UOB
OCBC
HONGKONG LAND
SEMBCORP IND
ST ENGINEERING
SINGAPORE AIRLINES
LONG TERM UPTREND since 010321
MEDIUM TERM UPTREND since 071120
SHORT TERM UPTREND since 141021
PIVOT 3120
Long positions above 3183 for 3415 and 3641
Short positions below 3183 for 3024 and 2747
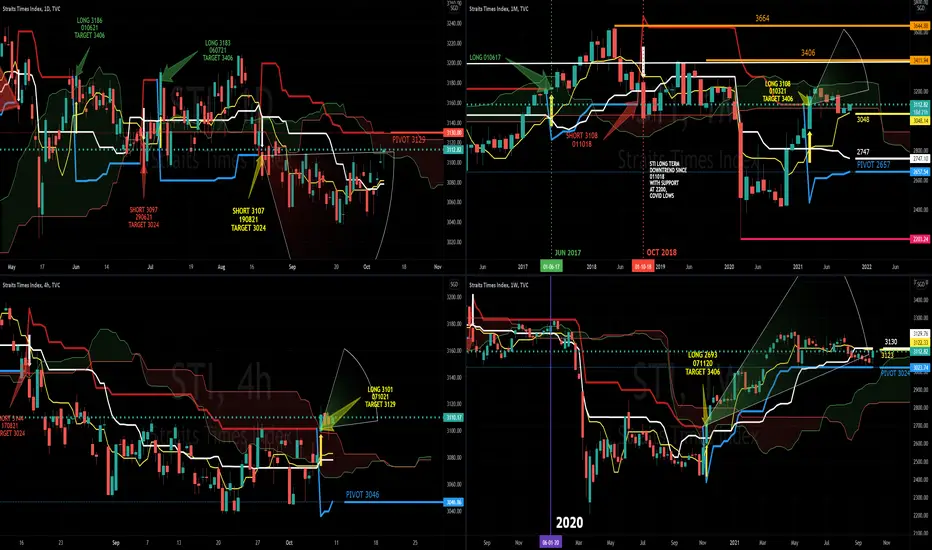
STI HOLDS 3024The STI positively bounced of the 3024 pivot on the weekly charts for the first trading week of October 2021.
The day short signal on 190821 is still active targeting 3024. A break above 3129 on the day charts will resume the short term trend to the upside.
LONG TERM UPTREND since 010321
MEDIUM TERM UPTREND since 071120
SHORT TERM PULLBACK since 190821
PIVOT 3129
Long positions above 3129 for 3406 and 3664
Short positions below 3129 for 3024 and 2747