US500 Breaks Above the Channel – Bulls Stay in ControlUS500 Breaks Above the Channel – Bulls Stay in Control
Yesterday, after White House Counselor Hassett said that inflation is continuing to decline, we saw all the indices rise further and also the stock market turned green.
Currently, the US500 has broken out through a large channel pattern and t
US SPX 500 Index
No trades
No trades
S&P500 Is a correction to the 1M MA50 technically inevitable?The S&P500 index (SPX) has been trading within a Channel Up since the March 2009 U.S. Housing Crisis bottom. Within this pattern, the market has periodically peaked and then pulled-back to test at least the 1M MA50 (blue trend-line).
The first line of Support has been the 1W MA100 (red trend-line),
S&P 500 Weekly Outlook – Neckline Breaking. Bears Gain ControlS&P 500 Weekly Outlook – The Neckline Is Breaking. Bears Gain Confirmation (July 29, 2026)
Jul. 29 – The bearish setup we’ve been tracking is now taking another step forward.
After the rising wedge broke, price has continued lower and is now breaking below the double-top neckline around 7,351.81
SP 500 Forecast panic cycles 8/5 and 10/16 The Sp 500 is nearing the end of the decline in wave C for wave B low The last advance should see above the last high likely 7641 to 7710 focus 7660 july 10th . Then THE start The first leg of the panic is ugly into 8/5 low from there we should see a ABC rally into sept 2nd Then The n
ABC and {A] x 1,618 = [C] 7489 I moved back to 90 % short SPYThe chart posted is the sp 500 I was flat early and now have moved back to 90 % long in the money puts The spiral from march 9th is 8/5 and The 10yr yield is doing what the 20 and 30 yr have been doing and The us /yen finally turned down from my 161.8 target I am NOT sure what is holding
S&P 500 Weekly Outlook Bulls Fight Back. Recovery Confirmed?Last week, we were asking a simple question:
Dead Cat Bounce or Real Recovery?
At the time, the S&P 500 had bounced sharply after breaking below the rising wedge and losing the double-top neckline. The bearish setup was still in play, but the market had begun fighting back.
This week, the pictu
We may rally at open but then turnIts hard to say if the market is done with the countertrend rally. We'll know it's over if they get under 7440 and hold. In the meantime, dips may get bought. We stopped at the 18ma in futures, they may want to test it in cash as well.
The VIX looks like it could pullback at open, but again it's i
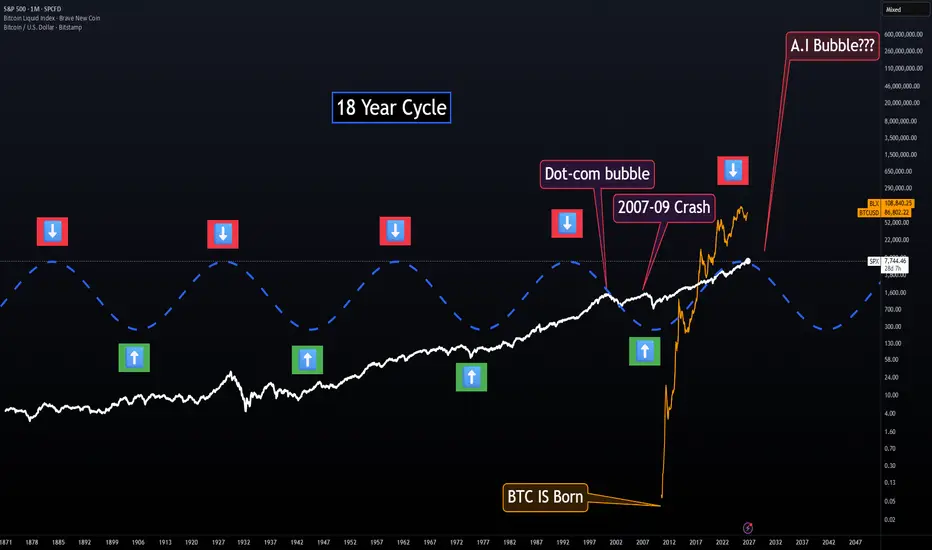
Rollover "Into The Realm" Part 2Now the market is seeing the costs
associated with the AI Bubble.
You see as long as the market was going straight up,
company CEO's have had a free ticket to spend TRILLIONS
to bolster their commitment to AI,
least they fall behind the curve.
But now you see the market,
the ultimate decider of p
See all ideas
Displays a symbol's value movements over previous years to identify recurring trends.
Frequently asked questions
US SPX 500 Index reached its highest quote on Jun 2, 2026 — 7,618.67 USD. See more data on the US SPX 500 Index chart.
The lowest ever quote of US SPX 500 Index is 1,347.90 USD. It was reached on Nov 15, 2012. See more data on the US SPX 500 Index chart.
US SPX 500 Index is just a number that lets you track performance of the instruments comprising the index, so you can't invest in it directly. But you can buy US SPX 500 Index futures or funds or invest in its components.