US500 :Bond Market Stress Builds-7,645 Is the Key LevelUS500 :Bond Market Stress Builds-7,645 Is the Key Level
Today, 10-year Treasury yields briefly hit 5.31% earlier in the day, the highest since 2007. That leaves borrowing costs at uncomfortable levels for stocks, as Treasuries suffered their worst quarter since 1994.
The pressure on US Treasury yields is starting to show more clearly in stocks.
The current situation is already critical and I would say it is very strange that US indices are not reacting at all to all this chaos at a time when
US SPX 500 Index
No trades
No trades
In-depth trading ideas
SP500 Consolidation Bearish Pressure Pattern SP500 is showing repeated rejection from the 7,700–7,750 resistance/trading-range area, keeping short-term price action under pressure.
Tecnically current weakness is also supported by the broader macro environment. On September 29, 2026, U.S. Treasury yields pushed to multi-year highs, with the 10-year yield reaching around 5.28%, while weaker consumer-confidence and job-openings data added to concerns about the economic outlook. Higher yields can pressure equity valuations and keep investors
S&P 500 Looks Very Bullish (3H)From the point where we placed the red arrow on the chart, a corrective structure has been developing on the .
Based on the current price action and the internal structure of the correction, this movement appears to be forming a Double Combination. The market has already completed a significant portion of this corrective phase, and price is now approaching what could be the final stages of the entire structure.
The key area to monitor from here is the green demand zone highlighted on the char
S&P500 This break-out can drop it to 7100 by Midterms.The S&P500 (SPX) is at a critical bearish break-out point where in early February made a decisive drop that kick-started the Feb-March U.S. - Iran War correction to the 1W MA70 (red trend-line).
As you can see both fractals started within a Channel Up and the latest common characteristic has been last Thursday's 1D MA100 (green trend-line) rebound, which on February 06 was the last bounce before a series of Lower Highs started. Notice how both bounces took place on the 0.5 Fibonacci retracement
SPX – Investors Are Still Willing to Pay for GrowthSPX continues to display an investment-driven bullish structure rather than simply a short-term rally . Recent pullbacks have yet to show any meaningful signs of capital leaving the market. Instead, buyers continue to step in at lower prices, suggesting that investors are using weakness to adjust and rebuild equity exposure.
From a fundamental perspective, the key story remains the earnings growth potential of U.S. companies, particularly within technology and AI . As continued investment in
S&P 500: The 12-Month Target of Institutional InvestorsIn an analysis published on TradingView last week, I explained the main reason behind the continuation of the stock market’s underlying uptrend: valuation.
Corporate profits and earnings prospects for S&P 500 companies are so substantial that, despite the index reaching new record highs, the stock market is becoming increasingly cheap in terms of valuation, according to the P/E ratio and forward P/E.
You can click on the chart below to read my analysis on this topic again.
You may now be a
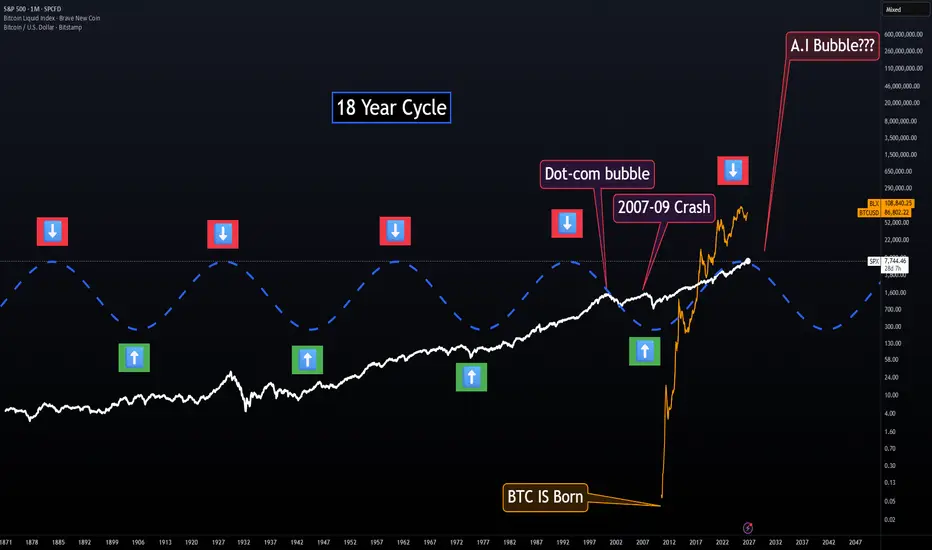
18-Year Cycle — Visual ModelThis is an easy-to-read visual version of my 18-Year Cycle model.
If you’re a visual person like me, this unfinished version makes the cycle much easier to see. The green arrows represent the stronger/good periods of the cycle, while the red arrows represent the higher-risk periods where major market stress and crashes have historically occurred.
Based on the way this model is lining up, it’s pointing toward another major risk window ahead. One possibility I’m watching is whether the current A
Five Bubbles, One ChartEvery Bubble Peaks Near 40%
This chart puts five manias side by side on one scale. Utilities and industrials in the 1920s, the Nifty Fifty, Japan, the dot-com era, and AI (Artificial Intelligence). Each curve is the share of the market held by that era's leaders: the climb, the peak, the collapse. Four of them are finished mountains. The green one on the right is still climbing.
Line them up and one number keeps coming back. The leaders top out near 40% of the index, and then their share fall
Lets get ready for next week 10/4/26 PT1In this video were recapping with subscribers the recent price action and were mapping different scenarios that could happen and get prepared for what is to come next. We had our move up like we expected but what was not in our bingo card was to see the US10Y reverse like it did on Friday! This is telling me that the smart money knows something and I believe i know what it is and its the Japanese 10Y as that has a nasty negative divergence with reversal signals on the weekly this is warning us a
S&P 500 ($SPX) 15m Intraday Bearish BiasS&P 500 ( SPCFD:SPX ) 15m Intraday Bearish Bias: Overhead Resistance Cluster at 7,684–7,721 vs Elliott Wave 3 Downside Projection to 7,617
### 🇺🇸 S&P 500 ($SPCFD / SPX) 15-Minute Intraday Technical Matrix (Ref: SPX_2026-10-02_09-00-14.png)
We are issuing an intraday technical update for the S&P 500 Index ($SPCFD) heading into the US Non-Farm Payrolls (NFP) macro release. Price action is trapped under heavy structural supply, establishing a asymmetrical risk/reward layout for intraday traders.
SPX: Macro Cycles | Elliott Wave Count on Log Scale (1976 → 2270📌 SPX, MACRO CYCLES
Elliott Wave study on a logarithmic scale, 6-month chart, with a fractal projection of the next cycles. This is a tracking post: I will update it over the years to record what was confirmed and what was invalidated.
📅 Date of record: Sep 29, 2026
💵 SPX: 7,683.69 (all-time highs)
---
🔢 TECHNICAL COUNT
Grand Wave 1 (teal), subdivided into 5 waves (orange):
- 1: impulse up to ~1929 ✅
- 2: correction from 1929 into the 1930s/40s ✅
- 3: the great extension, 1940s → today ⚠️ la
If Rally Continues Today, All Bear Ideas Likely WrongSPX has a solid support bounce and is now in pending intraday uptrend patterns.
If these succeed we will have pushed through a cluster of resistance levels/patterns which would annul my bear ideas at this level.
Just a little note on probable pivot of plans.
Market Tone: High Yield, High Growth, High VolatilityUS Treasury yields are back near levels last seen in 2002. Similar yield levels were seen in 2007 and before the early 2000s.
I believe three major forces are driving the current bond sell-off:
1. Persistent inflation concerns (geopolitical tensions, energy prices, and the post-QE environment);
2. Massive borrowing by governments (US, Europe, Japan) and large technology companies (GOOG, META, ORCL, AMZN, etc.);
3. Growing investor concerns that government deficits continue to expand without a c
SPX Time@Mode #4: second bar held, minutes nextGM gents,
Follow-up to #3. Last Monday the weekly signal had just fired on the 9/25 close and PCE and NFP were next. Both came in soft, core PCE +0.2% on the month against +0.3% expected and September payrolls +29K, and the second bar of the signal closed Friday at 7,722.72. Thursday traded down to 7,616.78, through 7,641.70, and closed back above it at 7,666.45, so the support held where it counts, on the close.
Two things changed on the chart since then. The daily trend turned bullish on Fri
Going over todays price action on the markets 10/05/26On todays video I go over with subscribers my levels of support and resistance and what I make out of the price action today. There are warning signs in the charts and also something isn't right and something is a miss in the markets, I believe we will find out soon!
SPX: 4-Hour Rebound Requires a Support Reclaim and RetestSPX has a conditional bullish rebound thesis on the 4-hour chart, centered on a return to 7477-7559. The setup depends on support forming within that zone; the supplied reference price of 7674 does not itself provide a zone-based entry.
The supplied volume calculation identifies 7477-7559 as the largest shelf, containing 17% of the profile and supported by chart extremes. The chart also shows a sharp recovery after the recent pullback into the broader support area. However, repeated reversals b