USDCAD Market View: Bearish – Selling from a Key Resistance ZoneUSDCAD SELL SETUP | 1H TIMEFRAME
Market View: Bearish – Selling from a Key Resistance Zone
USDCAD remains under bearish pressure on the 1-hour timeframe. Price has retraced into a significant resistance zone around 1.41200, where sellers may regain control and continue the prevailing downtrend.
E
U.S. Dollar / Canadian Dollar
No trades
No trades
Compare with USD to CAD
Details
The US Dollar vs. the Canadian Dollar is a very popular currency pair due to the extremely large amount of cross border trading that occurs between the U.S. and Canada. The CAD is considered to be a commodity currency because of the large amount of natural resources, especially oil, that are mined and exported to southern neighbors. The USDCAD is one of the most traded currency pairs in the world.
USDCAD: Trendline Continues to Support Upward MomentumUSDCAD is maintaining a clear bullish structure on the H1 timeframe, consistently forming higher lows and finding support from both the rising trendline and the Ichimoku Cloud. Following a pullback to the 1.4090 area, buying pressure quickly returned, indicating that the bulls remain in control of t
USD/CAD BEARS ARE GAINING STRENGTH|SHORT
Hello, Friends!
USD/CAD is trending down which is evident from the red colour of the previous weekly candle. However, the price has locally surged into the overbought territory. Which can be told from its proximity to the BB upper band. Which presents a beautiful trend following opportunity for
USD/CAD: THE 1.40100 SUPPORT REBOUND! 🇨🇦 🚀
Drifting down toward the 1.40100 support floor at 1.40644. Are you panic-selling into this local pullback, or preparing to buy the ultimate trendline bounce? 🤔
The Loonie is attempting to find footing amid shifting energy markets, but the U.S. dollar is eyeing a key demand retest. On this 1-ho
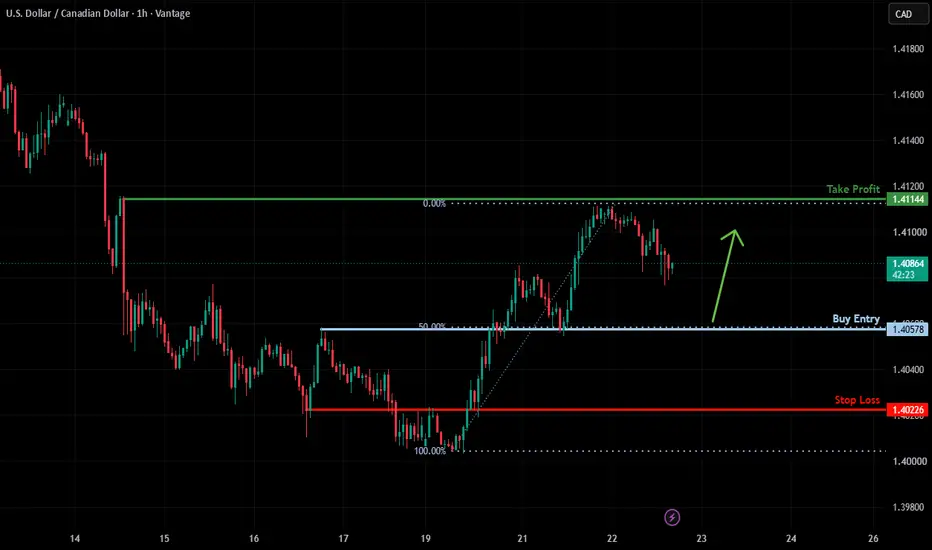
Falling toward 50% Fib support?USD/CAD is falling to the support level, which is an overlap support that aligns with the 50% Fibonacci retracement and could bounce from this level to our take profit.
Entry: 1.4057
Why we like it:
There is an overlap support level that aligns with the 50% Fibonacci retracement.
Stop loss: 1.4022
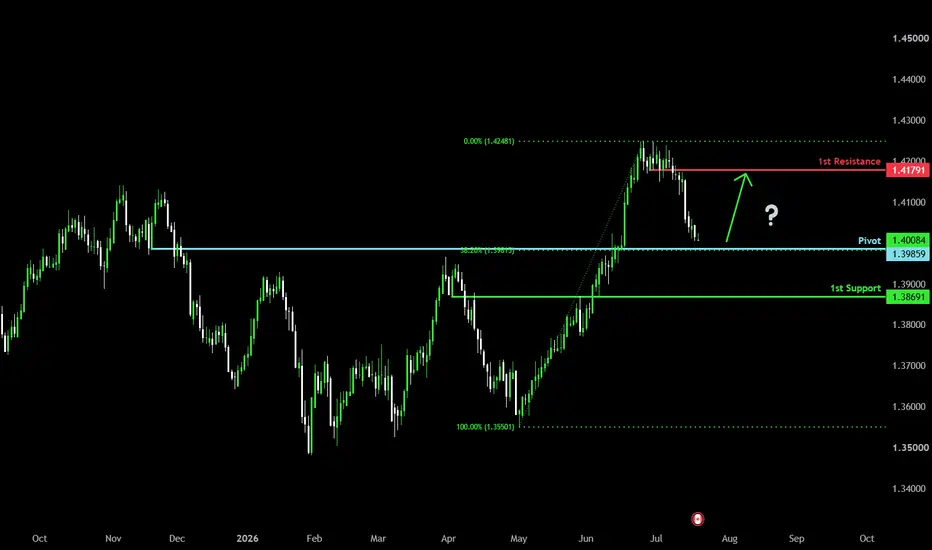
Falling towards pullback support?Loonie (USD/CAD) is falling toward the pivot, which acts as a pullback support that aligns with the 38.2% Fibonacci retracement and could bounce towards the 1st resistance.
Pivot: 1.3985
1st Support: 1.3869
1st Resistance: 1.4179
Disclaimer:
The opinions given above constitute general market com
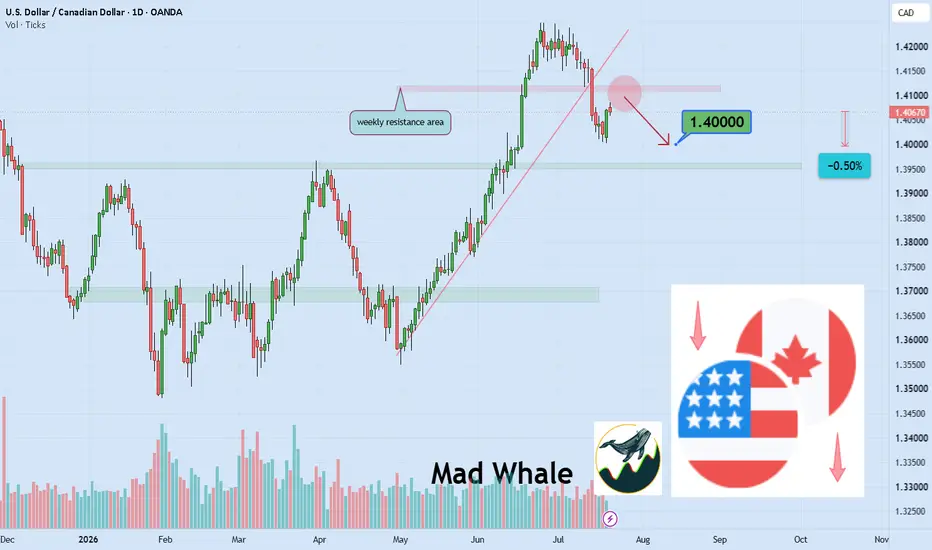
USD/CAD Faces Key Weekly Resistance as Short-Term PullbackHi,
Despite its long-term bullish trend, USD/CAD could see a short-term pullback due to the recent weakness in the U.S. dollar and its proximity to a major weekly resistance level. A move toward the next daily support around 1.4000 remains a likely scenario, representing a potential decline of abo
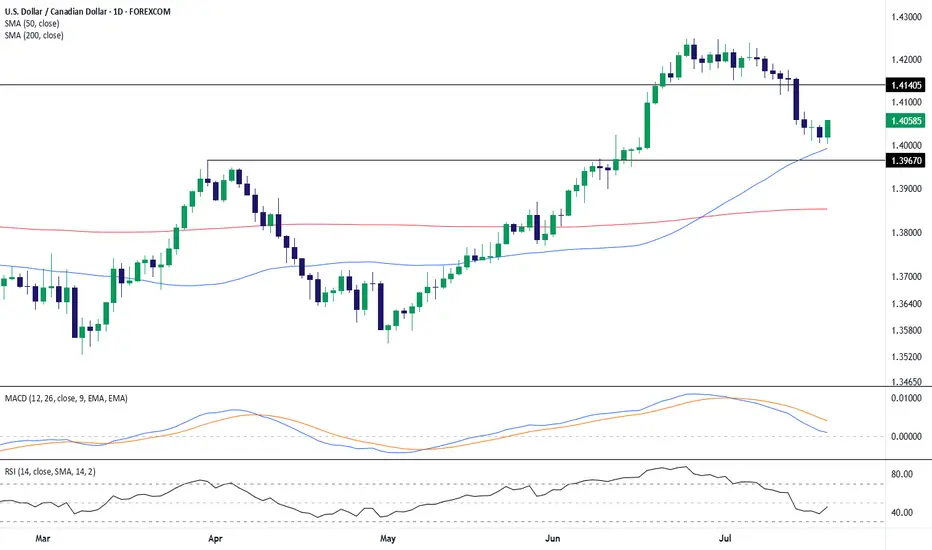
USD/CAD Pullback Tests Rising Trend SupportUSD/CAD remains in a broader bullish structure on the daily chart, although recent price action shows a clear loss of short-term momentum after rejection from the 1.4200–1.4250 region.
Price has pulled back beneath the 1.41405 resistance level and is now approaching an important confluence zone aro
50% Fib resistance ahead?Loonie (USD/CAD) is rising toward the pivot, which is a pullback resistance that aligns with the 50% Fibonacci retracement and could reverse toward the pullback support.
Pivot: 1.4125
1st Support: 1.4065
1st Resistance: 1.4176
Disclaimer:
The opinions given above constitute general market commen
See all ideas
Summarizing what the indicators are suggesting.
Oscillators
Neutral
SellBuy
Strong sellStrong buy
Strong sellSellNeutralBuyStrong buy
Oscillators
Neutral
SellBuy
Strong sellStrong buy
Strong sellSellNeutralBuyStrong buy
Summary
Neutral
SellBuy
Strong sellStrong buy
Strong sellSellNeutralBuyStrong buy
Summary
Neutral
SellBuy
Strong sellStrong buy
Strong sellSellNeutralBuyStrong buy
Summary
Neutral
SellBuy
Strong sellStrong buy
Strong sellSellNeutralBuyStrong buy
Moving Averages
Neutral
SellBuy
Strong sellStrong buy
Strong sellSellNeutralBuyStrong buy
Moving Averages
Neutral
SellBuy
Strong sellStrong buy
Strong sellSellNeutralBuyStrong buy
Displays a symbol's price movements over previous years to identify recurring trends.
Frequently asked questions
The current rate of USDCAD is 1.40934 CAD — it has increased by 0.06% in the past 24 hours. See more of USDCAD rate dynamics on the detailed chart.
The value of the USDCAD pair is quoted as 1 USD per x CAD. For example, if the pair is trading at 1.50, it means it takes 1.5 CAD to buy 1 USD.
The term volatility describes the risk related to the changes in an asset's value. USDCAD has the volatility rating of 0.35%. Track all currencies' changes with our live Forex Heatmap and prepare for markets volatility.
The USDCAD showed a 0.35% rise over the past week, the month change is a −0.80% fall, and over the last year it has increased by 3.67%. Track live rate changes on the USDCAD chart.
Learn how you can make money on rate changes in numerous trading ideas created by our community.
USDCAD is a major currency pair, i.e. a popular currency paired with USD.
Currencies are usually traded through forex brokers — choose the one that suits your needs and go ahead. You can trade USDCAD right from TradingView charts — just log in to you broker account. Check out the list of our integrated brokers and find the best one for your needs and strategy.
When deciding to buy or sell currency one should keep in mind many factors including current geopolitical situation, interest rates, and other. But before plunging into a deep research, you can start with USDCAD technical analysis. The technical rating for the pair is buy today, but don't forget that markets can be very unstable, so don't stop here. According to our 1 week rating the USDCAD shows the buy signal, and 1 month rating is strong buy. See more of USDCAD technicals for a more comprehensive analysis.