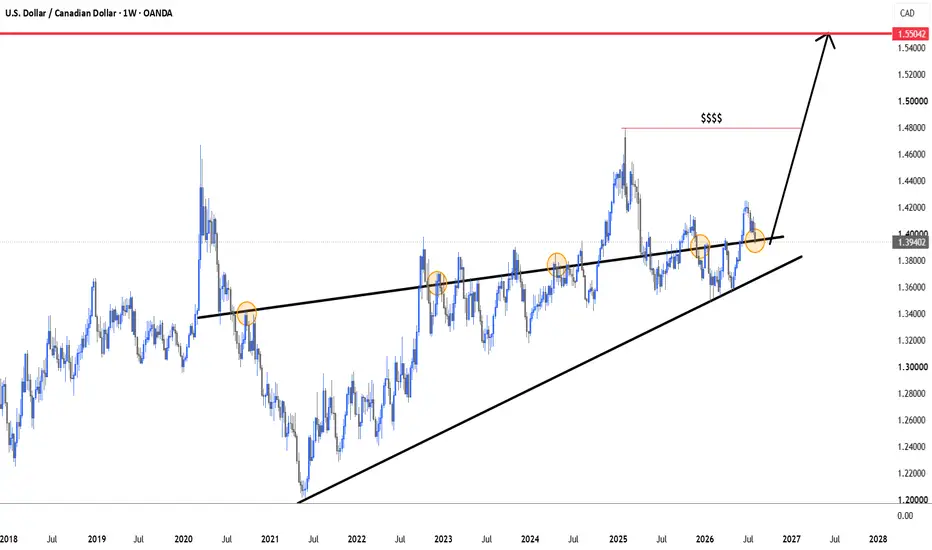
#USDCAD:+850 Pips Buying Opportunity, Ready To Launch! 🔺The USDCAD has fallen after reaching 1.42. The price has dropped approximately 350 pips due to the DXY’s bearish trend reversing. The price is likely to reverse and we are approaching a new week.
🔺During the new week the DXY could retrace from last week’s strong sell-off on the price index. CAD could be dominant and it is likely to touch our entry point before reversing.
🔺There are two take-profit targets with a total potential profit of +850 pips. There is a clear entry and stop-loss point. Use this as a guide to take a possible buying entry.
🔺Please use accurate risk management while trading USDCAD. We anticipate a strong bullish reversal. Entry criteria are strong bullish characteristics. If you agree with our idea please like and comment. We also encourage you to follow us for more information.
The Setupsfx_ Team ❤️
U.S. Dollar / Canadian Dollar
No trades
No trades
In-depth trading ideas
USD/CAD: THE 1.42700 TRIANGLE BREAKOUT RALLY! 🚀
Bouncing off triangle support near 1.40268! Are you panic-selling this consolidation, or getting ready to ride the multi-wave breakout rally to macro resistance? 🤔
The US Dollar is coiling tightly near the apex of a multi-week Triangle pattern on this 4-hour OANDA chart. USD/CAD is trading around 1.40268, holding firm above its primary Support line and gathering institutional buy volume for a higher-timeframe breakout expansion. 📈💥
Look closely at the black blueprint trajectory mapping out the upcoming sessions. The algorithm projects a powerful multi-wave breakout and retest sequence:
• Initial impulse push breaking cleanly above the descending Resistance line toward 1.40700. ⚡
• A healthy retest pullback dipping to 1.40400 to flip broken triangle resistance into solid support. 🧹
• A secondary expansion wave surging up toward 1.41500. 🧱
• A minor consolidation dip back to 1.41250 to solidify a higher-low base. 🌊
• Final high-velocity acceleration driving straight into the macro Strong resistance line target near 1.42700. 🎯🏹
Maintaining technical patience and aligning with the primary breakout structure remains your ultimate advantage here. Trying to short directly into a confirmed triangle support bounce holding above local demand is an easy way to get caught in an aggressive short squeeze. Smart money is accumulating long position blocks right off this support floor. 🧘♂️⚡
🛠 Trade Parameters:
🛒 Long Zone: 1.40000 - 1.40300 🛍️
🛑 Stop-Loss: 4h close below 1.39700 ❌
💰 Take-Profit: 1.42700 🎯
The retail bears trying to short the apex of this triangle pattern are about to get caught on the wrong side as institutional buy volume takes total control. Stay focused, strictly manage your risk, and let the algorithm carry the trade up to our target.
Maintain your composure through the waves, and we will see you up at the 1.42700 resistance ceiling! 🚀💎
13.08.26 Daily ForecastGood day guys!
I am currently travelling and will be home later this evening, so normal video forecast will resume tomorrow morning.
Main focus for me today is FX:USDCAD for the sell. We have a clear value area to work with so all we need now is for price to reach that area and hold, once the 1H commits from here we can look for an insurance entry on the 15M with either a risk entry or reduce risk entry depending on what forms; managing into the first inflection point.
An update on the FX:COPPER daily limit position I took on Monday, still holding this position and we can see it is now starting to roll over towards the end of the week. I will monitor this more so tomorrow afternoon to see whether it makes sense to continue holding over the weekend, will keep you guys updated!
Have a great day and catch you all tomorrow!
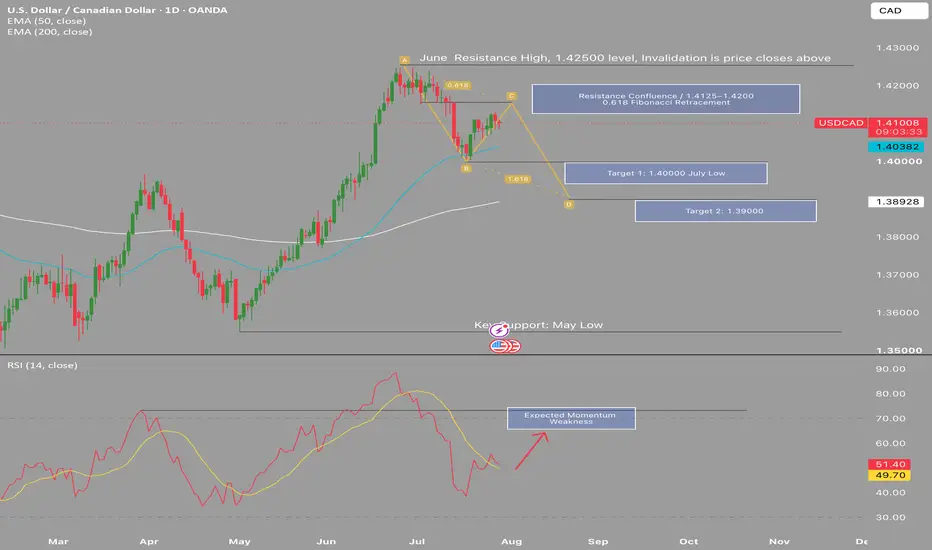
USDCAD- Resistance Confluence Signals Potential Bearish ReversalUSDCAD is approaching a significant technical inflection point following a corrective rally into a high-confluence resistance zone between 1.4125 and 1.4200. This area combines the June resistance high, the 61.8% Fibonacci retracement of the recent decline, and the projected completion of an ABCD harmonic pattern, creating a technically compelling area for sellers to regain control. Despite the recent recovery, price continues to trade below the 1.4250 June swing high, which remains the key invalidation level, with a sustained daily close above this resistance suggesting that bullish momentum has resumed. Should price reject from this confluence zone, initial downside objectives remain the psychological 1.4000 level and the July swing low, followed by 1.3900, where the 200-day EMA provides additional dynamic support and technical confluence. Momentum has also begun to recover following the recent rally, although I will be monitoring for expected momentum weakness and bearish price action before considering short exposure, as this remains a forecast rather than a confirmed reversal.
From a fundamental perspective, this outlook is supported by the potential for relative Canadian dollar strength should the current macroeconomic environment continue to favour CAD over USD. Softer US inflation, weaker labour market data, or a more accommodative Federal Reserve could reduce support for the US dollar, while resilient Canadian economic data, a comparatively hawkish Bank of Canada, and stronger crude oil prices may continue to underpin demand for the Canadian dollar. Market participants should also remain attentive to upcoming Federal Reserve and Bank of Canada policy decisions, inflation releases, employment reports, and developments in the energy market, as these events are likely to influence the next directional move. While price action will ultimately determine whether this scenario develops, the current combination of technical confluence and macroeconomic factors presents a compelling case for a bearish continuation should resistance between 1.4125 and 1.4200 be successfully defended.
USDCAD is approaching a significant technical inflection point following a corrective rally into a high-confluence resistance zone between 1.4125 and 1.4200. This area combines the June resistance high, the 61.8% Fibonacci retracement of the recent decline, and the projected completion of an ABCD harmonic pattern, creating a technically compelling area for sellers to regain control. Despite the recent recovery, price continues to trade below the 1.4250 June swing high, which remains the key invalidation level, with a sustained daily close above this resistance suggesting that bullish momentum has resumed. Should price reject from this confluence zone, initial downside objectives remain the psychological 1.4000 level and the July swing low, followed by 1.3900, where the 200-day EMA provides additional dynamic support and technical confluence. Momentum has also begun to recover following the recent rally, although I will be monitoring for expected momentum weakness and bearish price action before considering short exposure, as this remains a forecast rather than a confirmed reversal.
From a fundamental perspective, this outlook is supported by the potential for relative Canadian dollar strength should the current macroeconomic environment continue to favour CAD over USD. Softer US inflation, weaker labour market data, or a more accommodative Federal Reserve could reduce support for the US dollar, while resilient Canadian economic data, a comparatively hawkish Bank of Canada, and stronger crude oil prices may continue to underpin demand for the Canadian dollar. Market participants should also remain attentive to upcoming Federal Reserve and Bank of Canada policy decisions, inflation releases, employment reports, and developments in the energy market, as these events are likely to influence the next directional move. While price action will ultimately determine whether this scenario develops, the current combination of technical confluence and macroeconomic factors presents a compelling case for a bearish continuation should resistance between 1.4125 and 1.4200 be successfully defended.
USDCAD: Bullish Momentum Building — Buy Setup in FocusUSDCAD 2H | Bullish Reversal Setup — Buyers Defending Key Support 📈
USDCAD is showing a potential bullish reversal after a sharp sell-off into the 1.3935–1.3940 area. Price is attempting to stabilize near the marked weak-low/support zone, while the latest candles suggest buyers are stepping in. The key question now is whether this recovery can develop into a sustained move back toward the 1.4020–1.4030 target area.
📈 Trading Perspective
The current setup favors a cautious bullish approach while price holds above the 1.3935–1.3940 region. A successful recovery above 1.3970–1.3980 would strengthen the bullish structure and could open the way toward 1.4000 and then 1.4020–1.4030.
The marked target zone around 1.4020–1.4030 is important because it represents the first major upside objective after the recent decline. Traders should watch price action closely as it approaches this area.
🟢 Bullish Scenario
If USDCAD continues holding the 1.3935–1.3940 support area and starts forming higher lows, buyers could regain control.
Potential upside targets:
• TP1: 1.3970–1.3980
• TP2: 1.4000
• TP3: 1.4020–1.4030
• TP4: 1.4060
• Extended target: 1.4080–1.4100
A clean break and 2H close above 1.4020–1.4030 could provide further confirmation for continuation toward the 1.4060–1.4080 region.
🔴 Bearish Scenario
The bullish setup becomes weaker if price fails to recover and breaks below the 1.3935–1.3940 support area with strong bearish momentum.
Potential downside targets:
• TP1: 1.3920
• TP2: 1.3900
• TP3: 1.3880
• TP4: 1.3850
A sustained break below the recent weak low would indicate that sellers remain in control and could invalidate the expected bullish recovery.
🎯 Key Levels
• Major support: 1.3935–1.3940
• Recovery zone: 1.3970–1.3980
• Psychological level: 1.4000
• Main target/resistance: 1.4020–1.4030
• Higher resistance: 1.4060
• Major supply: 1.4080–1.4100
• Strong high: around 1.4120
📊 Trade Plan
For a buy setup, traders can look for confirmation around the 1.3935–1.3940 support zone and a clear shift toward higher highs and higher lows. A move back above 1.3970–1.3980 would add strength to the recovery setup.
The safer approach is to wait for confirmation rather than buying immediately after a sharp decline. If price reaches 1.4020–1.4030, consider securing partial profits because this is the marked target/resistance area.
⚠️ Risk Management
Keep position size controlled and place the invalidation level below the important support/weak-low area according to your trading plan. Avoid chasing large candles, especially after a volatile move. USDCAD can react quickly to USD strength, oil-price movements and Canadian/U.S. economic data.
🔑 Overall Bias
The chart presents a potential bullish recovery setup from the 1.3935–1.3940 support zone. As long as this area holds, the upside path toward 1.3970 → 1.4000 → 1.4020–1.4030 remains in focus. However, a decisive breakdown below support would shift the bias bearish and expose lower levels.
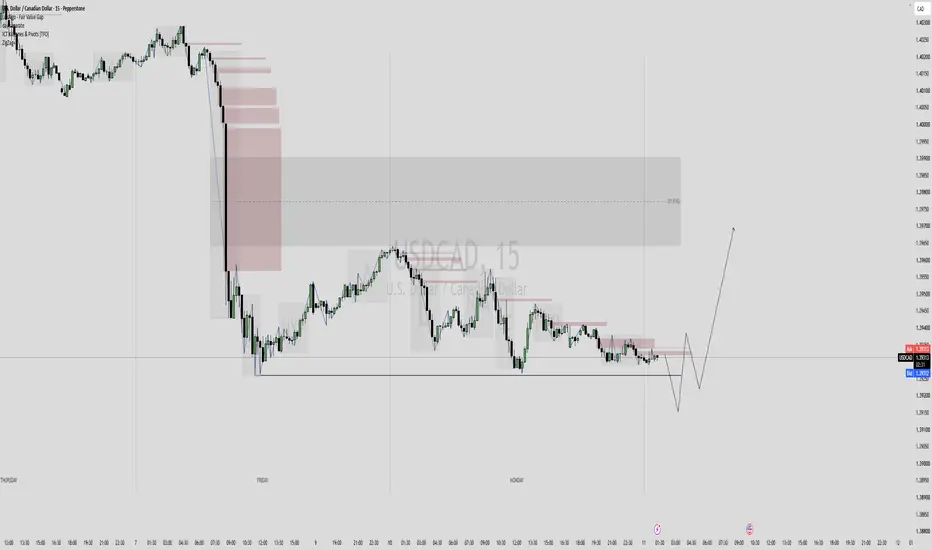
USDCAD | Fresh Demand Zone in Focus (15m)Overview
USDCAD is trading close to a Demand Zone on the 15-minute chart, making it an area of interest for a potential long opportunity if price reacts according to my trading plan.
The highlighted zone is a Rally-Base-Rally (RBR) structure and stands out due to its fresh nature and strong departure from the base. While these characteristics can make the zone noteworthy, I will only consider a trade if price reaches the zone and my predefined entry criteria remain valid.
A minimum reward-to-risk ratio of 2:1 is required before considering any position. As always, confirmation and disciplined risk management remain essential.
Key Observations
Fresh Rally-Base-Rally (RBR) Demand Zone on the 15-minute chart.
Price is approaching the zone and may attract buying interest.
The zone is supported by a strong leg-out, indicating a decisive move away from the base.
A trade will only be considered if all predefined entry conditions are satisfied.
Minimum reward-to-risk requirement: 2:1.
Trading Plan
Wait for price to reach the marked Demand Zone.
Observe price action for confirmation before considering an entry.
Only enter if the setup aligns with the trading plan.
Manage risk according to predefined rules throughout the trade.
Disclaimer
This publication is shared for educational purposes only and reflects a rule-based market analysis. It is not financial advice or a recommendation to buy or sell any financial instrument. Always conduct your own analysis and apply appropriate risk management before making trading decisions.
𝗨𝗦𝗗/𝗖𝗔𝗗 𝗗𝗮𝗶𝗹𝘆 𝗔𝗻𝗮𝗹𝘆𝘀𝗶s| 𝗔𝘂𝗴𝘂𝘀𝘁 𝟭𝟭 - 26𝗨𝗦𝗗/𝗖𝗔𝗗 𝗗𝗮𝗶𝗹𝘆 𝗔𝗻𝗮𝗹𝘆𝘀𝗶 | 𝗔𝘂𝗴𝘂𝘀𝘁 𝟭𝟭, 𝟮𝟬𝟮𝟲
USD/CAD is currently **strongly bearish** and has already moved significantly to the downside.
Yesterday, Monday, **Friday’s low was not taken out**. Price traded almost exactly at the same level, leaving the liquidity below potentially intact.
Above the current price, we can identify several **imbalances**, including multiple **H4 Fair Value Gaps (FVGs)** and a **D1 FVG**.
This creates an interesting potential setup for today.
If price shows a clear **bullish Market Structure Shift (MSS)**, the bearish inefficiencies above could become potential targets for a **retracement**.
The important point is that I am **not changing my overall bearish bias** on USD/CAD.
Instead, I am looking for a short-term counter-trend move to rebalance some of the inefficiencies created during the strong bearish displacement.
𝗠𝘆 𝘀𝗰𝗲𝗻𝗮𝗿𝗶𝗼:
**𝗕𝘂𝗹𝗹𝗶𝘀𝗵 𝗠𝗦𝗦 → 𝗥𝗲𝘁𝗿𝗮𝗰𝗲𝗺𝗲𝗻𝘁 → 𝗛𝟰 𝗙𝗩𝗚𝘀 / 𝗗𝟭 𝗙𝗩𝗚 𝗮𝘀 𝗽𝗼𝘁𝗲𝗻𝘁𝗶𝗮𝗹 𝘁𝗮𝗿𝗴𝗲𝘁𝘀**
No MSS, no trade.
**𝗡𝗼 𝗿𝗮𝗶𝗱, 𝗻𝗼 𝘁𝗿𝗮𝗱𝗲.**
*Disclaimer: This content is for educational and informational purposes only and does not constitute financial or investment advice. Trading financial markets involves substantial risk, and past performance is not indicative of future results. CFDs are complex instruments and come with a high risk of losing money rapidly due to leverage. Always conduct your own research and consider your individual risk tolerance before making any trading decisions.*
Employment Data "Tipped The Cup" on USD/CADToday, Employment Data was released for both USD and CAD and the results showed themselves as a Breakout of an Inverse Cup and Handle Pattern on the Daily, lets break it down!
OANDA:USDCAD was finding Support in the 1.4000 area and with the 23K job loss for USD and almost 60K job increase for CAD, we can see price finally broke down through this Support Zone, confirming the Cup and Handle Pattern.
- This will put the Federal Reserve in a position to Hold rates longer instead of a Hike.
Now we can see the decline in price seems to be slowing down, so we should expect price to make a Retracement back to the Breakout of the Cup and Handle for a Retest!
If successful, price could continue falling further and based on the Extension Measurement of the Cup, price could look to find Support around 1.3780 - 1.3750.
Bearish continuation setup?USD/CAD is rising to the resistance level, which is a pullback resistance that aligns with the 38.2% Fibonacci retracement and could reverse from this level to our take profit.
Entry: 1.3984
Why we like it:
There is a pullback resistance level that aligns with the 38.2% Fibonacci retracement.
Stop loss: 1.4042
Why we like it:
There is a pullback resistance.
Take profit: 1.3920
Why we like it:
There is a pullback support level.
Enjoying your TradingView experience? Review us!
Please be advised that the information presented on TradingView is provided to Vantage (‘Vantage Global Limited’, ‘we’) by a third-party provider (‘Everest Fortune Group’). Please be reminded that you are solely responsible for the trading decisions on your account. There is a very high degree of risk involved in trading. Any information and/or content is intended entirely for research, educational and informational purposes only and does not constitute investment or consultation advice or investment strategy. The information is not tailored to the investment needs of any specific person and therefore does not involve a consideration of any of the investment objectives, financial situation or needs of any viewer that may receive it. Kindly also note that past performance is not a reliable indicator of future results. Actual results may differ materially from those anticipated in forward-looking or past performance statements. We assume no liability as to the accuracy or completeness of any of the information and/or content provided herein and the Company cannot be held responsible for any omission, mistake nor for any loss or damage including without limitation to any loss of profit which may arise from reliance on any information supplied by Everest Fortune Group.
USDCAD Bullish Reaction Expected from Discount ZoneUSD/CAD has pulled back into the 0.5–0.6 Fib discount zone, aligning with a key demand area that previously triggered a strong bullish reaction in June. Price structure shows a BOS followed by ChoCH on the way down, suggesting the recent bearish leg may be losing momentum near this zone.
Looking for buys from the 1.3850–1.3930 area, targeting:
TP1: 1.4130 (recent structure high)
TP2: 1.4280 (prior swing high / ChoCH level)
USDCAD H4 | Buyers Defend Key SupportThe price is falling to our buy entry level at 1.3916, which is an overlap suport.
Our stop loss is set at 1.3860, a pullback support that is slightly below the 78.6% Fibonsaci retracement.
Our take profit is set at 1.3993, a pullback resistance.
High Risk Investment Warning
65% of retail investor accounts lose money when trading CFDs with this provider. You should consider whether you understand how CFDs work and whether you can afford to take the high risk of losing your money.
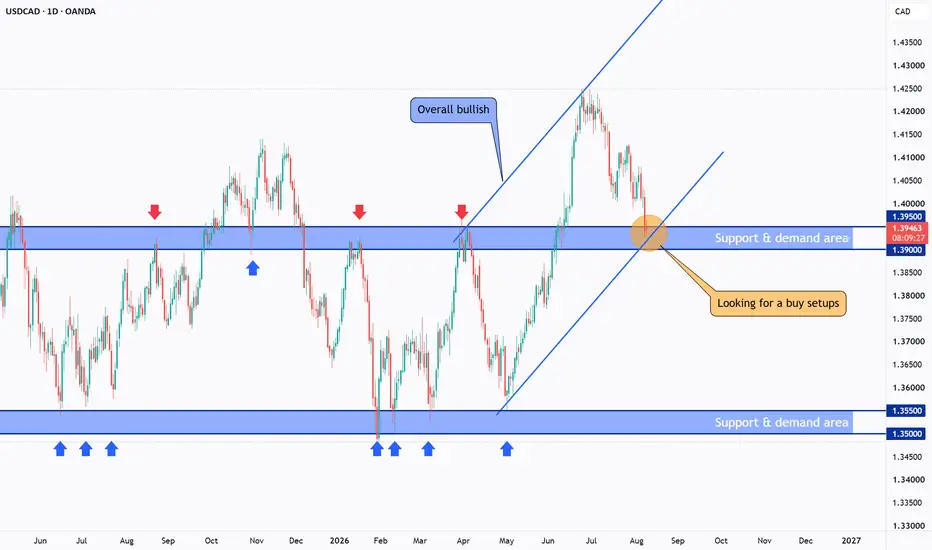
USDCAD - Buyers Testing Key Support Area!USDCAD remains bullish from a broader perspective, continuing to trade inside the blue ascending channel that has guided price higher for an extended period.
Price is now testing an interesting technical area where the blue support and demand zone aligns with the lower boundary of the ascending channel, creating a strong confluence area to monitor.
⭕As long as this area continues to hold, we can start looking for buy setups on lower timeframes, anticipating another bullish reaction within the broader ascending structure.
⭕However, if price breaks below the blue support and demand area and the lower boundary of the channel, it would provide an important indication that bullish momentum is weakening, with the focus shifting toward the next lower support area.
The reaction around this confluence zone may reveal whether buyers can defend the broader bullish structure, or if sellers are ready to push price below the channel.
⚠️Disclaimer: This analysis reflects my personal market view and is not financial advice.
Rayan Nasser
#USDCAD #USD #CAD #Forex #TechnicalAnalysis #PriceAction #Trading #MarketStructure
𝗨𝗦𝗗/𝗖𝗔𝗗 𝗗𝗮𝗶𝗹𝘆 𝗔𝗻𝗮𝗹𝘆𝘀𝗶𝘀 𝗨𝗦𝗗/𝗖𝗔𝗗 𝗗𝗮𝗶𝗹𝘆 𝗔𝗻𝗮𝗹𝘆𝘀𝗶𝘀 | 𝗔𝘂𝗴𝘂𝘀𝘁 𝟭𝟯, 𝟮𝟬𝟮𝟲
Yesterday’s **CPI release initially showed USD weakness**. Liquidity below the market was taken once again, followed by a strong counter-move to the upside.
Fundamentally, the USD may remain **bearish**.
However, price sometimes needs **fuel** before it can continue its larger move lower.
Therefore, I can see a potential **bullish retracement within the broader bearish trend**.
There are **equal highs** sitting almost exactly around the **equilibrium of the current bearish trend**. This liquidity could become an attractive target for a retracement.
Yesterday, USD/CAD also delivered a **bullish MSS on H1**, while the **H1 FVG was only partially touched**.
If price returns to this area, fills the H1 FVG and reacts within the **OTE zone**, a long setup becomes interesting.
𝗠𝘆 𝗽𝗿𝗲𝗳𝗲𝗿𝗿𝗲𝗱 𝘀𝗰𝗲𝗻𝗮𝗿𝗶𝗼:
**𝗟𝗼𝗻𝗱𝗼𝗻 𝘀𝗲𝘀𝘀𝗶𝗼𝗻 → 𝗟𝗶𝗾𝘂𝗶𝗱𝗶𝘁𝘆 𝗿𝗮𝗶𝗱 → 𝗛𝟭 𝗙𝗩𝗚 𝗿𝗲𝘁𝗿𝗮𝗰𝗲𝗺𝗲𝗻𝘁 → 𝗢𝗧𝗘 𝗿𝗲𝗮𝗰𝘁𝗶𝗼𝗻 → 𝗟𝗼𝗻𝗴**
Ideally, London would establish the **low of the day**, followed by a move higher.
The distance to the equal highs is approximately **150 pips**, providing a substantial potential draw on liquidity.
The broader trend remains bearish — I am simply looking for the **fuel for the next move lower**.
**𝗡𝗼 𝗢𝗧𝗘, 𝗻𝗼 𝘁𝗿𝗮𝗱𝗲.**
*Disclaimer: This content is for educational and informational purposes only and does not constitute financial or investment advice. Trading financial markets involves substantial risk, and past performance is not indicative of future results. CFDs are complex instruments and come with a high risk of losing money rapidly due to leverage. Always conduct your own research and consider your individual risk tolerance before making any trading decisions.*
USDCAD My Opinion! BUY!
My dear friends,
Please, find my technical outlook for USDCAD below:
The instrument tests an important psychological level 1.4012
Bias - Bullish
Technical Indicators: Supper Trend gives a precise Bullish signal, while Pivot Point HL predicts price changes and potential reversals in the market.
Target - 1.4038
About Used Indicators:
Super-trend indicator is more useful in trending markets where there are clear uptrends and downtrends in price.
Disclosure: I am part of Trade Nation's Influencer program and receive a monthly fee for using their TradingView charts in my analysis.
———————————
WISH YOU ALL LUCK
USDCAD Falling Wedge: Is a Bullish Breakout Taking Shape?USDCAD is trading within a falling wedge as price action gradually compresses between two converging trendlines. Although the current structure remains bearish, this pattern often suggests that selling pressure is weakening and a potential bullish reversal may be developing.
Price has bounced from the lower boundary of the wedge and is now testing its upper edge. The next move will depend on whether this resistance can be broken decisively.
If price breaks above the wedge and holds after a retest, the bullish scenario will gain strength, with 1.39570 becoming the next key area to watch.
Until the breakout is confirmed, I will remain patient and let the price reveal its direction first.
USDCAD TP 1.3770On the daily chart, USDCAD is trading below the downtrend line, with the bearish trend prevailing. Attention should be focused on the resistance near 1.395; if a rebound stalls there, further short positions could be considered. The downside target is around 1.3870, with further support located near 1.3770 should that level be breached.
USDCAD Bearish ModelWe're back and this time it's USDCAD we're reviewing. As you can see, UCAD has been producing some pretty clean price action over the past several weeks to a month.
After last weeks NFP move, I expect price to continue it's temporary downtrend after first retesting broken structure.
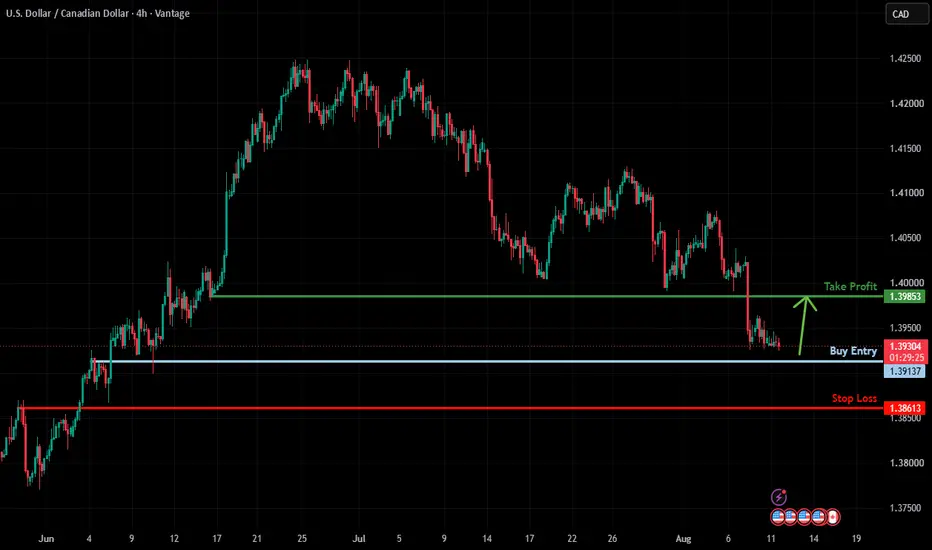
Could we see a rebound from here?USD/CAD is falling towards the support level, which is an overlap support and could bounce from this level to our take profit.
Entry: 1.3913
Why we like it:
There is an overlap support level.
Stop loss: 1.3861
Why we like it:
There is an overlap support level.
Take profit: 1.3985
Why we like it:
There is a pullback resistance.
Enjoying your TradingView experience? Review us!
Please be advised that the information presented on TradingView is provided to Vantage (‘Vantage Global Limited’, ‘we’) by a third-party provider (‘Everest Fortune Group’). Please be reminded that you are solely responsible for the trading decisions on your account. There is a very high degree of risk involved in trading. Any information and/or content is intended entirely for research, educational and informational purposes only and does not constitute investment or consultation advice or investment strategy. The information is not tailored to the investment needs of any specific person and therefore does not involve a consideration of any of the investment objectives, financial situation or needs of any viewer that may receive it. Kindly also note that past performance is not a reliable indicator of future results. Actual results may differ materially from those anticipated in forward-looking or past performance statements. We assume no liability as to the accuracy or completeness of any of the information and/or content provided herein and the Company cannot be held responsible for any omission, mistake nor for any loss or damage including without limitation to any loss of profit which may arise from reliance on any information supplied by Everest Fortune Group.