USD/CAD Best Place For Sell Spotted , 250 Pips Waiting !Here Is My 8H USD/CAD Chart , If we checked the chart we will see that we have a a huge movement to upside without any correction since we entered 2 weeks ago from the low and the price moved more than 250 pips without any correction so the best place for sell spotted , we have a very strong res which forced the price to go down 3 times when it touch it for more than 500 pips so it will be our perfect place to sell this pair , this area between 1.42300 / 1.42500 , i`m waiting the price at this a
U.S. Dollar / Canadian Dollar
No trades
No trades
In-depth trading ideas
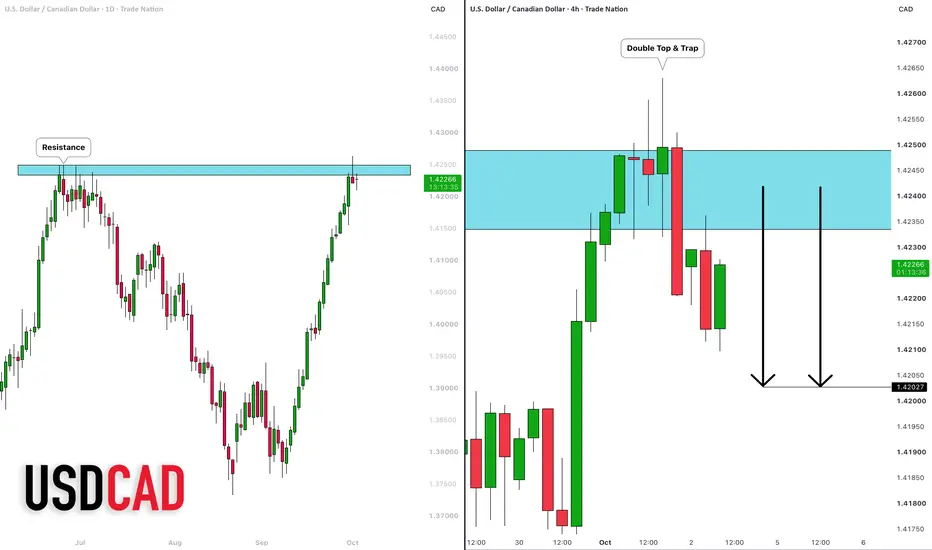
USDCAD: Time for Pullback 🇺🇸🇨🇦
USDCAD reached a major resistance based on the year's high this week.
I think that the price will likely retrace from that.
The closest strong support that I see is 1.4203 on a 4H time frame.
❤️Please, support my work with like, thank you!❤️
I am part of Trade Nation's Influencer program and receive a monthly fee for using their TradingView charts in my analysis.
USDCAD: Bearish Harmonic Setup in the Making#USDCAD is currently moving within an uptrend, but the 4H chart is showing signs of a potential reversal setup.
A Bearish Harmonic Pattern appears to be forming, while the RSI is showing the potential for bearish divergence. However, I’m not looking to enter short prematurely.
My confirmation plan:
Wait for a clear bearish RSI divergence
Monitor the 1H support level closely
Wait for a confirmed break and close below 1H support
Enter short only after confirmation
Apply strict risk management wi
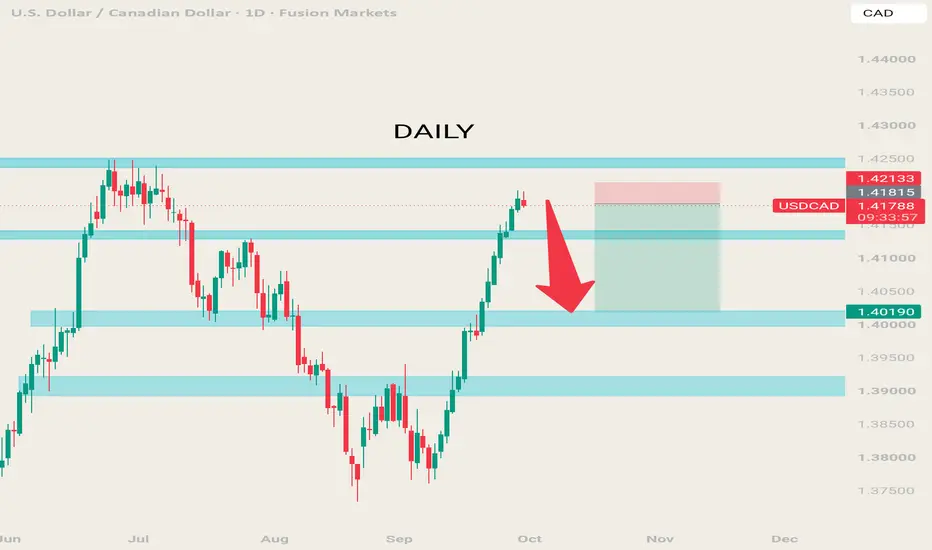
USDCAD SELL IDEAWe are selling USDCAD simply to capture a few pips from the retracement.
We can see a bearish harmonic pattern, which helps us enter a short position during the pullback.
It is also a strong zone on the daily timeframe, as we are within an Order Block that aligns with strong H4 resistance and the 78% Fibonacci level.
We are targeting a 230-pip gain with a 40-pip stop-loss.
Sometimes, a simple, straightforward approach is the best way to view the market—though it always helps to specialize in
USDCAD 4H: Major Trendline Test — Waiting for ConfirmationUSD/CAD is testing the descending green trendline around 1.4150 after a strong bullish advance. This is a decision area, and I’m waiting for price to confirm its next direction.
Bullish scenario
A clear 4H close above the trendline and the 1.4155 area, followed by a successful retest, would support bullish continuation.
Upside levels to watch:
1.4200
1.4250
A return below the broken trendline and a loss of the retest low would invalidate the breakout setup.
Bearish scenario — only after c
USDCAD Best Sell Signal n the past 3 years.The USDCAD pair is approaching the top of a Channel structure which in the past 3 years has offered the 4 most optimal sell opportunities, only breaking upwards once.
Given the recent rebound on its 1M MA50 (red trend-line), that should be the technical Target as the 5th Sell Signal at the top of this Channel emerged. Notice that the 1M MA50 is about to enter the 0.382 - 0.236 Fibonacci range, which is the zone that has offered the most buy opportunities. Our Target is 1.38000.
---
** Please
USDCAD: The Rally Is Starting to Lose Its GripUSDCAD is at one of those spots where the chart starts to ask a simple question: do buyers still have enough strength to keep pushing?
The pair has climbed well, but around 1.4195–1.4202, progress has become much harder. Price is still holding near the highs, yet each attempt upward is producing less follow-through. That changes the character of the move.
I’m now watching 1.4175–1.4180 as the first area that could expose weakness. If price loses that zone and fails to reclaim it, the market may
USD/CAD — Let’s Catch the Pullback | Resistance Rejection SetupTechnical Analysis :
USD/CAD has made a strong recovery from the 1.37588 area and is now approaching a major resistance zone around 1.4185–1.4201. Price action suggests that this area could become an important decision point after the recent bullish move.
🔹 Resistance: 1.4185–1.4201
🔹 Immediate pullback zone: 1.4032
🔹 50% Fibonacci: 1.3980
🔹 61.8% Fibonacci: 1.3928
🔹 Major support: 1.3900–1.3928
🔹 Swing low: 1.3759
The idea is to wait for confirmation of rejection near resistance rather than ch
Potential bearish reversal?Loonie (USD/CAD) is rising towards the pivot and could reverse towards the 1st support.
Pivot: 1.4257
1st Support: 1.3991
1st Resistance: 1.4504
Disclaimer:
The opinions given above constitute general market commentary and do not constitute the opinion or advice of IC Markets or any form of personal or investment advice.
Any opinions, news, research, analyses, prices, other information, or links to third-party sites contained on this website are provided on an "as-is" basis, are intended to
USD/CAD may be ready to surge even higherUSD/CAD is moving higher towards resistance near $1.42 and could consolidate or pull back in the near term, having reached overbought levels, before potentially making another move back towards the highs seen in 2024. The last time USD/CAD reached the $1.42 region, in June, it stalled and declined back to a support area around $1.375.
A rising USD/CAD rate means the US dollar is gaining against the Canadian dollar. Resistance around $1.42 has been strong since before 2025, when this area played
USDCAD — Relentless Bullish Momentum, 1.4239 Resistance in FocusUSDCAD continues to move higher with exceptionally strong bullish momentum. On the 4-hour timeframe, the advance has been remarkably one-sided, with only shallow pullbacks along the way.
4H Chart: click here
Macro-Fundamental Structure — Supporting the Bullish Bias
From a macro perspective, the current fundamental environment remains aligned with the bullish structure on USDCAD.
Geopolitical uncertainty in the Middle East continues to create demand for the U.S. dollar, while elevated oil-mark
USDCAD — Time to Go Down? 1.4215 Holds the KeyThis is a continuation of my previous USDCAD analysis:
Previous Analysis: USDCAD — Relentless Bullish Momentum; 1.4239 Resistance in Focus
Bullish momentum is facing an important test. The ascending channel has been broken, but one key support level still stands between a potential recovery and a deeper bearish correction: 1.4215 .
Higher-Timeframe Bias — 4H
On the 4H timeframe, USDCAD is developing a large ascending triangle . This broader structure could remain an important reference
USD/CAD - Is This Rally About to Reverse?USD/CAD has ripped from around 1.3760 to nearly 1.4150 in just a few weeks. That's an impressive run — but things on the chart are making me think this rally may be close to running out of road.
Zoom out to the monthly chart and USD/CAD is now testing a resistance zone that has rejected price sharply on multiple past occasions. A level that's turned price away before carries more weight each time it gets retested — and this rally is arriving at that exact shelf after barely pausing to breathe.
USD/CAD BEARS WILL DOMINATE THE MARKET|SHORT
Hello, Friends!
USD-CAD uptrend evident from the last 1W green candle makes short trades more risky, but the current set-up targeting 1.413 area still presents a good opportunity for us to sell the pair because the resistance line is nearby and the BB upper band is close which indicates the overbought state of the USD/CAD pair.
Disclosure: I am part of Trade Nation's Influencer program and receive a monthly fee for using their TradingView charts in my analysis.
✅LIKE AND COMMENT MY IDEAS
USDCAD Weekly CLS Range - Reversal ZoneHi Friends, New CLS Range has been created and Im looking for short Model 1 trade setup. As always after the manipulation in to the Key Level, below the CLS range and reaction, we need to see a confirmation switch from the manipulation phase - CIOD (change in order flow) in the the expansion.
⏳ Stay patient and enter only after candle close.
🎯 Target: 50% of the CLS range.
📍 COT - (CADUSD) shows how the shorts being closed and longs (CAD buys) being build while price been making a pullback.
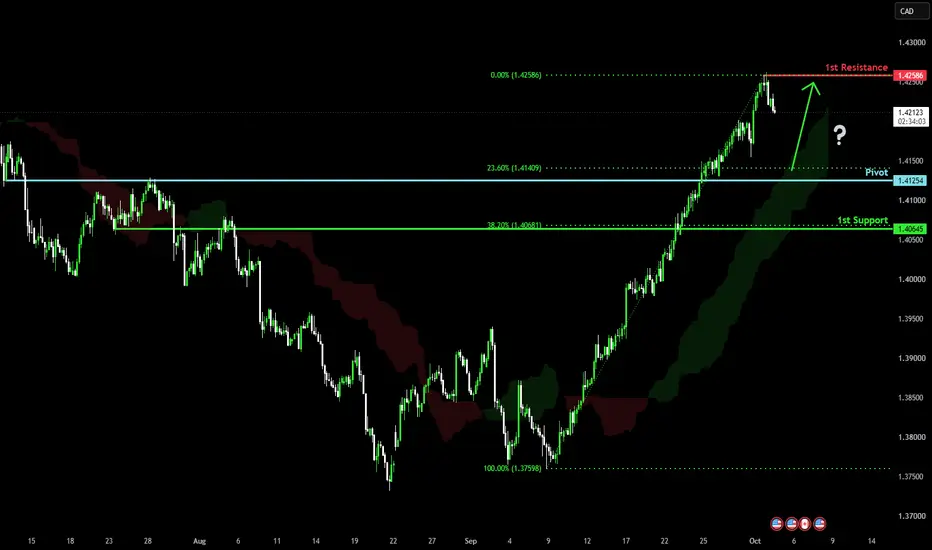
Bullish continuation setup?Loonie (USD/CAD) is falling towards the pivot, which has been identified as a pullback support that aligns with the 23.6% Fibonacci retracement and could bounce towards the pullback resistance.
Pivot: 1.4125
1st Support: 1.4064
1st Resistance: 1.4258
Disclaimer:
The opinions given above constitute general market commentary and do not constitute the opinion or advice of IC Markets or any form of personal or investment advice.
Any opinions, news, research, analyses, prices, other information,