USDJPY: 159 Resistance Rejection — Is Liquidity Below Next?🔹 USDJPY is consolidating below the 159.00 resistance area after a strong recovery from the 153.00–154.00 region. Price has been forming higher lows along the rising trendline, while the recent rejection near 159.00 shows sellers remain active around resistance. The current structure is holding abov
Compare with USD/JPY
Crypto info
Also known as trading the “gopher” the USDJPY pair is one of the most traded pairs in the world. The value of these currencies when compared to each other is affected by the interest rate differential between the Federal Reserve and the Bank of Japan.
USDJPYHello Traders! 👋
What are your thoughts on USDJPY?
This currency pair is trading below a descending trendline and has currently reached a key resistance zone.
The recent bullish move has brought price into the important 158.40–159.70 resistance area. This zone overlaps with the 0.5–0.618 Fibonacc
USD/JPY H1 - Bearish Toward 155.00 !USD/JPY is showing signs of a bearish shift after forming a change of character (CHoCH) near the 157.70 area. Price is currently consolidating below the previous bullish structure, while the marked fair value gap (FVG) around 158.00–158.20 and bearish order block near 158.65–158.80 remain important
USDJPY 30Min Engaged ( Bearish Reversal Detected )HANZO MARKET LIQUIDITY REPORT
USDJPY
Timeframe: 30min (Volume Basis)
Scale: Higher Timeframe Context / Deep Volume analysis
━━━━━━━━━━━━━━━━━━━━━━
Market Observation
This analysis is focusing on structural behavior, liquidity zones, Volume analysis
and key areas of interest within the current range
USDJPY - Bearish triangle breakdown
USDJPY shows a structural 🔺 reversal after consecutive failed breakouts. Price is currently trapped in a 🧭 bearish bias following a clear rejection at the upper boundary. The inability to sustain higher levels confirms that selling pressure is dominating the current 4H price action.
Momentum is no
USD/JPY - Rounding Bottom Holds, Bulls Comes BackOANDA:USDJPY is holding above the 155.70–157.02 buy zone after completing a clear rounding-bottom recovery from the 153 area. Price has also rebuilt above the Ichimoku structure, showing that buyers have regained short-term control after the previous breakdown.
Around 157.4, I would prefer a cont
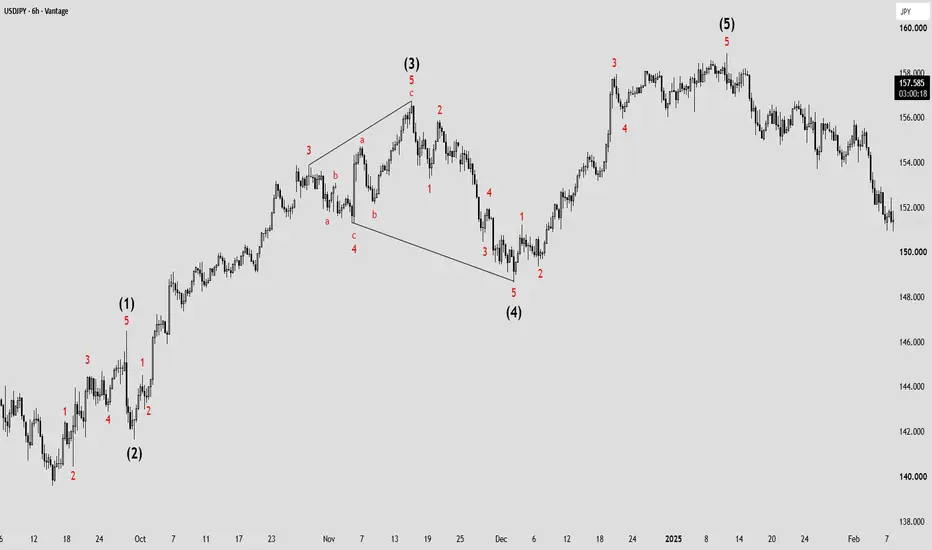
Deep Elliott Wave Lesson🇺🇸🇯🇵 USDJPY – 6H | Deep Elliott Wave Lesson | From the Simple Chart to the Full Count Step by Step
Today we have a very detailed and deep lesson in Elliott Wave.
My goal is not just for you to see the numbers on the chart. My goal is for you to understand why the count looks like this, how to b
USDJPY - Bearish wedge continuation 🧭
USDJPY is evolving within a broad descending 🔺 triangle on the 4H timeframe. Price has repeatedly failed to breach the primary overhead trendline, confirming a persistent bearish market bias as rallies are met with aggressive selling pressure near the structure’s ceiling.
The pair is currently
USDJPY: Potential Head & Shoulders PatternUSDJPY: Head & Shoulders Pattern
USDJPY is showing a potential Head and Shoulders pattern on the 4H chart after failing to sustain the move toward the 159.00 area.
The structure is now developing with a clear left shoulder, higher head, and right shoulder. Price is approaching the neckline around
See all ideas
Displays a symbol's price movements over previous years to identify recurring trends.
Frequently asked questions
The value of the USDJPY pair is quoted as 1 USD per x JPY. For example, if the pair is trading at 1.50, it means it takes 1.5 JPY to buy 1 USD.
USDJPY is a major currency pair, i.e. a popular currency paired with USD.
Currencies are usually traded through forex brokers — choose the one that suits your needs and go ahead. You can trade USDJPY right from TradingView charts — just log in to you broker account. Check out the list of our integrated brokers and find the best one for your needs and strategy.