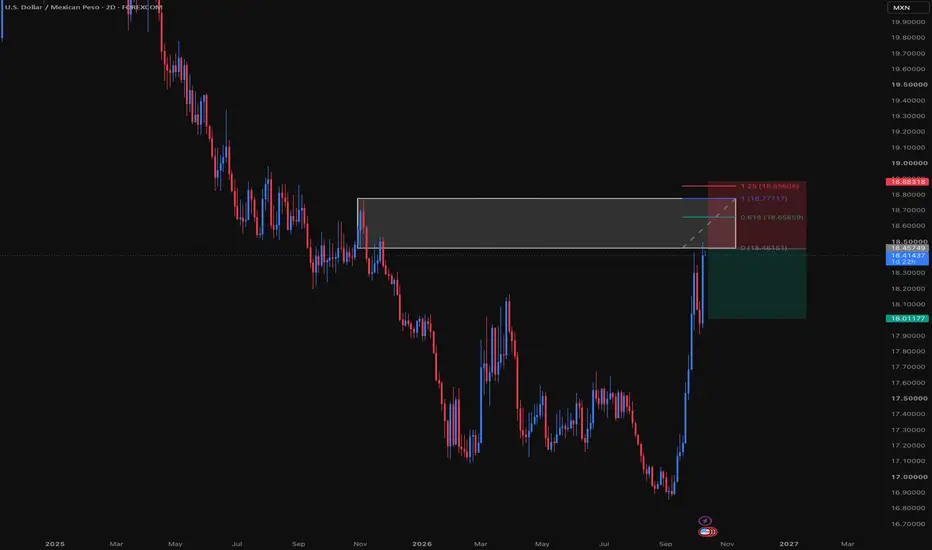
USD/MXN: lower highs into supply, short back towards 18.41USD/MXN surged from below 18.00 in early October to a spike high near 18.97 after the Bank of Mexico (Banxico) surprised markets with a rate cut on 5 November. Since then, the rally has been losing steam. Each bounce has stalled at a lower level, from 18.97 to 18.81 and then around 18.70, a classic
U.S. Dollar / Mexican Peso
No trades
No trades
Peers for comparison
USDMXN — Peso pulls back below the 50 EMA after rejecting 19.00
USDMXN is at 18.58862, down 0.35% on the session, having retreated from the 19.00 area tested in early November.
The advance that began at 16.97 in September reached the upper horizontal near 18.95 and stalled there. Price has since slipped back below the 50 EMA at 18.64862 — the first 4H close
Mexican Peso Continues to Show Neutrality Even After the Fed Recent sessions have remained relatively neutral for USD/MXN price action. Over the last three trading sessions, the pair has recorded a move of barely 0.3%, highlighting that the lack of a clear directional bias continues to be one of the most important characteristics of the market in the short te
USDMXN — Peso extends to 18.80 as the trend holds every level on
USDMXN is at 18.66571, consolidating after reaching 18.87 last week — roughly 1,900 pips above the September low near 16.97.
This is the third time I’ve mapped this pair, and the structure has done exactly what the levels said it would. The breakout from the 2026 range held its retest at 17.98.
Is the Mexican Peso Still Losing the Battle?The Mexican peso continues to face a challenging environment in the short term. Heading into the end of the week, USD/MXN is posting gains of roughly 0.5% during the latest session, a move that continues to highlight persistent buying pressure around the pair and reflects the lack of strength still
USDMXN — Bullish moving-average crossover in progressThe 50-day moving average is crossing above the 200-day moving average, a technical signal that may indicate a shift in the medium-term trend.
The last time we saw this crossover in USDMXN was in June 2024.
The setup is particularly interesting after the strong rebound from the 17.00 area and the br
USDMXN — Peso breakout confirmed: the 17.98 retest held
USDMXN is at 18.32977, back at the upper boundary of the structure after the pullback into 17.98 held exactly where it needed to.
This is a follow-up to last week’s chart. The pair had broken out of its 2026 range and pulled back into the confluence at 17.98 — the 50 EMA, the rising trendline fr
USDMXN SELL TRADEI am going short on USD/MXN because the Commitment of Traders (COT) report shows that commercial positions are at extreme levels on both the 3-year and 1-year timeframes. This suggests that the market may be approaching a turning point, increasing the likelihood of a reversal toward a bearish bias i
See all ideas
Summarizing what the indicators are suggesting.
Oscillators
Neutral
Oscillators
Neutral
Summary
Neutral
Summary
Neutral
Summary
Neutral
Moving Averages
Neutral
Moving Averages
Neutral
Displays a symbol's price movements over previous years to identify recurring trends.
Frequently asked questions
Today, USD/MXN rate is 19.14136 MXN.
For broader market analysis, dive into the technicals on the USDMXN live chart and read the latest USDMXN news:
– Latam stocks tumble to one-year low, FX falls on rate worries
– LatAm stocks hit one-year low, FX slips on tighter Fed bets
– LatAm stocks hit 11-month low, most FX slips on tighter Fed bets
For broader market analysis, dive into the technicals on the USDMXN live chart and read the latest USDMXN news:
– Latam stocks tumble to one-year low, FX falls on rate worries
– LatAm stocks hit one-year low, FX slips on tighter Fed bets
– LatAm stocks hit 11-month low, most FX slips on tighter Fed bets
Markets don't sleep, here's what's going on with USDMXN at the moment:
– Latam stocks tumble to one-year low, FX falls on rate worries
– LatAm stocks hit one-year low, FX slips on tighter Fed bets
– LatAm stocks hit 11-month low, most FX slips on tighter Fed bets
See more updates in real-time with our News Flow.
– Latam stocks tumble to one-year low, FX falls on rate worries
– LatAm stocks hit one-year low, FX slips on tighter Fed bets
– LatAm stocks hit 11-month low, most FX slips on tighter Fed bets
See more updates in real-time with our News Flow.
The safest way to trade USDMXN is through a reliable broker. Create an account, fund it, and place a buy order.
You can trade USDMXN directly from TradingView:
– Choose a broker: Explore our supported trading partners and pick one that fits your needs
– Compare options: View available brokers side by side to evaluate fees and features
– Connect your account: Open Supercharts, click "Trade", select your broker, and log in
– Start trading: Place orders without leaving the chart
Tip: If you're new to trading, try paper trading first — it lets you practice strategies in real market conditions without risking funds.
You can trade USDMXN directly from TradingView:
– Choose a broker: Explore our supported trading partners and pick one that fits your needs
– Compare options: View available brokers side by side to evaluate fees and features
– Connect your account: Open Supercharts, click "Trade", select your broker, and log in
– Start trading: Place orders without leaving the chart
Tip: If you're new to trading, try paper trading first — it lets you practice strategies in real market conditions without risking funds.
It's worth checking USDMXN rate change for various periods to get the full picture:
– 1 day — +0.34%
– 1 week — +2.97%
– 1 month — +2.63%
USDMXN's all-time low was 8.91850 MXN (May 20, 2001), and its highest price is 25.76938 MXN (Apr 6, 2020). Track the dynamics with the latest forex news right on TradingView.
– 1 day — +0.34%
– 1 week — +2.97%
– 1 month — +2.63%
USDMXN's all-time low was 8.91850 MXN (May 20, 2001), and its highest price is 25.76938 MXN (Apr 6, 2020). Track the dynamics with the latest forex news right on TradingView.
When trading USDMXN, one should keep in mind many factors.
First, analyze the fundamentals:
– Macroeconomic data: Inflation, GDP, employment, and other key indicators in the economies behind both currencies
– Central bank policy: Interest rate decisions and monetary policy from the respective central banks
– Market sentiment: Check what other traders anticipate
– News flow: Geopolitical events and economic releases
Then check technical ratings:
– Today — strong buy
– 1-week — strong buy
– 1-month — buy
Identify the trend, watch key levels (support and resistance), consider volatility and upcoming economic events. Then, you'll be closer to an informed decision.
First, analyze the fundamentals:
– Macroeconomic data: Inflation, GDP, employment, and other key indicators in the economies behind both currencies
– Central bank policy: Interest rate decisions and monetary policy from the respective central banks
– Market sentiment: Check what other traders anticipate
– News flow: Geopolitical events and economic releases
Then check technical ratings:
– Today — strong buy
– 1-week — strong buy
– 1-month — buy
Identify the trend, watch key levels (support and resistance), consider volatility and upcoming economic events. Then, you'll be closer to an informed decision.
USDMXN volatility measures how much the exchange rate fluctuates over time, i.e. how quickly and how strongly it moves up or down.
The current volatility rating is 1.24%.
What it means for traders:
– Higher volatility: Larger and faster price swings → higher risk and opportunity
– Lower volatility: More stable price movement → smaller trading ranges
– Market behavior: Volatility often increases during major economic news or central bank decisions
Volatility helps traders estimate risk and position sizing. It's also useful for adapting strategies to market conditions.
How to use volatility:
– Compare volatility across other currency pairs
– Combine with technical analysis (trends, support/resistance)
– Monitor economic events that may increase market movement
The current volatility rating is 1.24%.
What it means for traders:
– Higher volatility: Larger and faster price swings → higher risk and opportunity
– Lower volatility: More stable price movement → smaller trading ranges
– Market behavior: Volatility often increases during major economic news or central bank decisions
Volatility helps traders estimate risk and position sizing. It's also useful for adapting strategies to market conditions.
How to use volatility:
– Compare volatility across other currency pairs
– Combine with technical analysis (trends, support/resistance)
– Monitor economic events that may increase market movement
USDMXN is quoted as how many MXN (quote currency) it takes to buy one USD (base currency).
For example, if the pair trades at 1.50, it means 1 USD = 1.50 MXN.
What can influence the rate:
– Supply and demand: Driven by trade, investment flows, and speculation
– Economic data: Inflation, GDP, employment reports
– Central bank policy: Interest rates and monetary decisions
Follow these and more events in the Economic Calendar.
For example, if the pair trades at 1.50, it means 1 USD = 1.50 MXN.
What can influence the rate:
– Supply and demand: Driven by trade, investment flows, and speculation
– Economic data: Inflation, GDP, employment reports
– Central bank policy: Interest rates and monetary decisions
Follow these and more events in the Economic Calendar.