New FOMO entry: Cardano still good with 5X (PP: 3,575%)You know, timing is everything when it comes to leveraged trading. Trading is great.
There is a tendency to "run away," to escape some projects and chart setups just because the market is starting to move.
» I agree and understand about buying at support;
» I agree and understand about managing risk and patience;
» I agree, Cardano (ADAUSDT) is moving ahead but, it is not too late.
As the market changes, transitions; we are set to experience long-term growth. It is months of bullish action.
On a fluctuating and over-extended market, then no. Once resistance is hit, we look for new projects and new trading opportunities. While the action is still happening at support, we can enter again to win big (we can enter "late").
There is a catch though. We can go-in and still profit nicely from a long-term rising wave, but, leverage needs to be lowered to account for the higher prices.
ADAUSDT can start growing day after day after day, for months. The same with Bitcoin and Ethereum and the other altcoins. Knowing this, it is the best time now. Just buy and hold.
_____
LONG ADAUSDT
Leverage: 5X
Potential: 3575%
Allocation: 5%
Entry zone: $0.1650 - $0.1950
Targets:
1) $0.2222
2) $0.2686
3) $0.3461
4) $0.4748
5) $0.5788
6) $0.6827
7) $0.8300
8) $1.0193
9) $1.2222
10) $1.5635
Stop: Close weekly below $0.1600
_____
Thank you for reading, your continued support is highly appreciated but it is not over yet. If you enjoy the content, one second you must take. FOLLOW. That's all. Now we are in a win-win exchange situation.
Namaste.
In-depth trading ideas
Cardano (ADA) turns bullish: Bear market over, new bull marketThe most amazing development ever is happening now, today.
You know we are big on Cardano, ADAUSDT, me and you. You know we love this project and frequently track, analyze and trade this pair. You might also know that we jumped in a bit too early but we never give up. If the setup fails, try again.
The entire final flush has been recovered. ADAUSDT is now trading at the highest price since early June, two months ago. This development confirms the bottom and also the start of a new bull market.
Cardano peaked December 2024, together with thousands and thousands of projects. Here the previous bull market ended and a new bear market got started.
The descent truly intensified last year, August 2025. Notice that this is the same date Ethereum peaked and started to decline. An entire year of prolonged bearish action.
Cardano's bear market lasted between December 2024 and June 2026. In August 2026 we are now bullish confirmed.
So here we have another trading pair that shows the end of the bear market and now we can expect years of sustained bullish action. 2-4 years.
See the related publications for all of the leveraged trade-numbers. Visit my profile for more.
Your continued support is highly appreciated.
Namaste.
Cardano (ADA): 10X, Additional Growth, Cryptocurrency Trading & Very tricky. Should we take the local double-top as a bearish signal and call for lower prices in the coming months?
Cardano crashed reaching new lows exactly two months ago, 4-June. 4-August, we are doing better, looking better and moving up. We have been rising and recovering for months. "We." Me, you, us, them and the market.
Good evening my fellow Cryptocurrency trader, it is such a pleasure to right again for you today!
We have been looking at ADAUSDT on the daily timeframe. We have some active open-LONGs on this platform with 10X. The market is green but this signal I just mentioned now, is calling for a retrace; how will you approach the market?
The first target is yet to hit but, naturally, the trade can be secured after massive growth. The full numbers are here:
Short-term you can get your retrace and this would only be part of normal price fluctuations. Lower prices, bearish resumption and continuation to me, are out of the question.
The market has been recovering and challenging resistance for days. Long-term hold can yield outstanding results; leveraged trading —fast profit taking— open and close. Yes, it is valid to close a position to later open a new one. Yes, get in and get out but also buy and hold.
The situation is still mixed for the altcoins market. Mixed in the sense that strong bullish momentum is not here yet. Mixed because it is still sideways. The bigger, better and broader picture continues to point higher.
The current chart continues to support a bull market in the coming months. I saw something on Bitcoin, a signal that is pointing to an additional 60 days of bullish action—confirmation likely coming in in days.
Both Bitcoin and Cardano are trading at bottom prices, you know the big projects move in the same way. Both will recover. Both are looking great.
The mixture is up again. Bitcoin is rising but it can take months for 100K. Say, we can see the market continue consolidation with a bullish bias—slow and steady growth... Make of it what you will, Crypto is going up.
Namaste.
Dump this Pump in ADA for 1000% gainsHello Traders!
In the chart we can see there is a channel pattern facing towards upward.
At first ADA broke it towards downside and than formed a reversal pattern and it successfully pushed it upside. Now it is again forming a reversal pattern and this pattern is almost at its peak. Once its complete it will push ADA towards downside.
We are entering Short in ADA from 0.2070
Target 0.1636(+20.66%)
Stoploss 0.2201 (-6.7%)
My goal is to be recognized as one of the highest win-rate traders in the TradingView community. :)
Trade Analysis Based on
> Fibonacci Tool (A1000x Way) – Custom Fibonacci approach for precise market analysis
> Candlestick Patterns – Strong price action confirmation through key candle formations
> A1000x Breakout Strategy – Identifying and trading high-probability breakout setups
> HH, HL & LH, LL Strategy – Market structure analysis for clear trend direction
> Swing Points – Tracking key highs and lows for accurate price movement insight
> A1000x Stoploss Strategy – Strategic stoploss placement for effective risk control
> A1000x Target Strategy – Structured target setting based on price action
We trade using carefully developed strategies and disciplined market analysis, always seeking the best possible accuracy while remembering that ultimate success comes only by the will of Allah.
In some trades, you may notice a relatively larger stop loss or a risk-to-reward ratio that may appear unusual at first glance. However, every trade is taken with proper planning and calculated analysis, not random entries.
Before entering any position, we perform detailed calculations and market evaluation. Based on this analysis, we carefully determine our stop loss and target levels.
I personally apply one of my specialized stop-loss and target strategies, designed to place the stop loss at a logical market level where price is less likely to reach before moving toward the intended target — InshaAllah.
Trading always involves risk, but with discipline, patience, and proper strategy, we aim for consistent and responsible decision-making.
Feel free to share your thoughts or leave a comment.
ADA USDT SHORT SIGNAL#34.ADA/USDT – Trade Setup (SHORT)
📈 Position Type: SHORT
🕒 Timeframe: 1H
📊 Market: Futures
💰 Entry Zone:
0.1975
🛑 Stop-Loss:
0.2044
🎯 Take-Profit Targets:
• TP1: 0.1937
• TP2: 0.1879
• TP3: 0.1818
• TP4. 0.1750
Tp5.
⚙️ Leverage:
5*10
▫️ After TP1, move SL to Entry + 0.2%.
▪️ Exit Plan:
• 50% at TP1
• 25% at TP2
• 25% at TP3
📌 Risk Management:
Risk only 1–2% of your capital per trade.
⚠️ Always check and confirm the setup on your chart before entering the trade.
Cardano (ADA). Cardano (ADA)
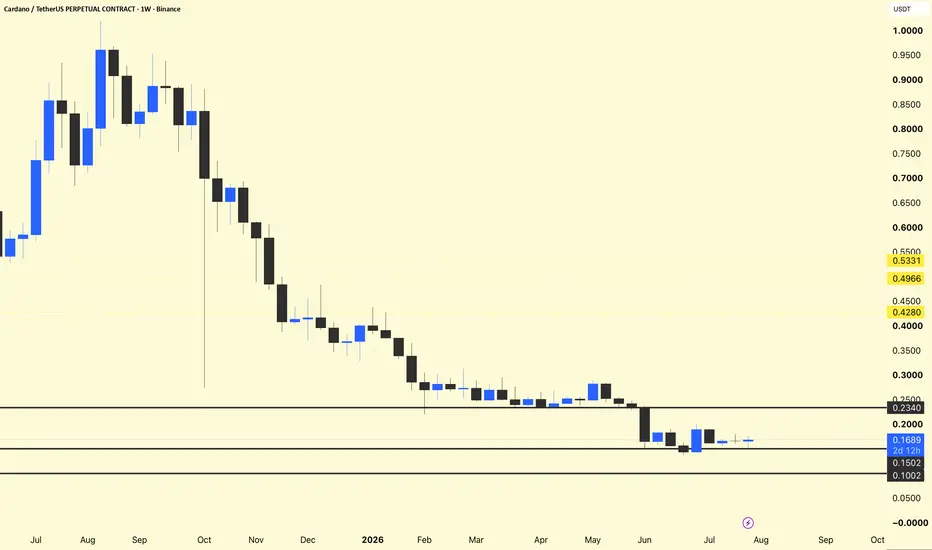
ADA managed to close this week in the green, albeit with only a 2% gain. Still, the support at $0.15 has been reconfirmed, and this cryptocurrency has a good shot at moving towards $0.20. Eventually, the $0.23 resistance must be reclaimed to turn bullish.
Because the most recent push higher has been on low volume, this shows buyers remain weary and will need to see more gains before they gather sufficient confidence to step up their presence on the orderbook.
Looking ahead, Cardano may be about to exit a very difficult period between 2025 and 2026 when the price went from $1.2 to $0.14. To do that, ADA will have to hold above $0.15 and aim for $0.23 next.
ADA | We Called The Sweep, +28.26% Delivered
By analyzing the #Cardano (ADA) chart on the 4H timeframe, we can see that the setup we published on 11 July has delivered in full — and it delivered through the exact mechanism we described, not by accident. We called the bullish structural shift, told you to buy the discount rather than chase, and named the Order Block as the reaction point. Price has since run +28.26% off that zone. You can revisit the original breakdown here:
⏱️ 4H Timeframe
Let's trace it, because the sequence is what matters here — not the outcome.
The market had been in a clean downtrend, a steady run of bearish BOS pressing against a descending trendline. That changed when price broke the Key Level with force and printed a bullish CHoCH — the first genuine signal that the character of the market had shifted. Price then returned to the OB + Key Level ($0.1631 – $0.1674) sitting inside it, and we published on that retest with price at $0.1719 , below the 0.5 equilibrium at $0.1691 — in the discount half of the range.
The specific thing we said would happen next was this: a liquidity sweep of the equal lows first, then the reaction, then the rally. That is precisely what the market delivered. Price flushed below the Order Block, cleared the stops resting under the lows, and reversed hard from that sweep — trapping the sellers who read the flush as a breakdown. From there it launched +28.26% .
And it did not just move — it hit the waypoints we named. Price reclaimed the 0.5 equilibrium at $0.1691 , drove through the 0.618 at $0.1763 , and tagged the 0.786 extension at $0.1866 that we listed as a target on the way up. Price is now trading around $0.1940 , sitting directly beneath the 1.0 extension at $0.1996 and the key structural high at $0.2002 .
That level is the whole story from here.
🎯 The Bias
Scenario A — the base case (structural continuation). A decisive close above $0.2002 is not a minor event on this chart. That high is the last swing standing between this move and a confirmed bullish BOS on the 4H — the break that converts what has been an impulsive recovery into a formally reclaimed uptrend. On that close, in my view the path opens meaningfully higher: first the buy-side liquidity at $0.2185 , and beyond it the deeper pools we mapped in the original idea at $0.2390 and ultimately $0.2888 . The reason I weight this scenario is that everything beneath it has already been proven — the sweep did its job, the Order Block held, and the market has spent this entire move making higher lows.
Scenario B — rejection at the high. I have to be realistic about the other side. Price has run more than 28% in a straight line and is now arriving at a major structural high — that is exactly where impulsive moves stall. If $0.2002 rejects without a close above it, expect a corrective pullback back into the range to rebalance before any second attempt. That would be normal digestion, not failure. Structurally, this idea only dies on a break of the Protected Low at $0.1384 , and price is nowhere near it.
The rule that decides which scenario you are in: a break is a candle close, not a wick . A level this obvious, sitting at a round number with this much attention on it, is precisely where the market prints a spike through and reverses to trap the crowd. Do not front-run the close — and after a 28% run, do not chase into the level either. Let it confirm.
📰 Fundamental Backdrop
The fundamental picture has strengthened materially since our last note, and two of the catalysts we flagged back then have now actually landed.
Start with the flow, because it is the cleanest evidence. Cardano has gained roughly 23% over the past week as whales accumulated around 240 million ADA in a five-day stretch. That matters because it is the continuation of exactly what we highlighted in July: large wallets were quietly increasing their share of supply through the selloff. They accumulated into weakness, and they are now accumulating into strength — that is the same cohort driving this move, not retail momentum.
Second, the Van Rossem hard fork activated on 20 July . We flagged it in the previous idea as a pending July catalyst, and it delivered: it made smart contracts cheaper and marked Cardano's first fully on-chain governed protocol change — a genuine technical milestone rather than a marketing one.
Third, and this is the big one sitting directly in front of us: the SEC's review period for a spot ADA ETF opens on 9 August , with filings pending from Grayscale, VanEck, 21Shares and Canary Capital. We named that August 9 window a month ago, and it is now six days away. Beyond it, the deployment of Leios later this year is the next development milestone that could finally connect Cardano's build activity to its price.
Now the honest counterweight, because a catalyst that large cuts both ways. A regulatory date is a binary — a delay, a rejection, or simply a "sell the news" reaction into an already-extended move could unwind a meaningful part of this rally quickly. And the move is extended: +28.26% off the Order Block and +23% in a week is a lot of ground covered in a short time, which leaves price vulnerable to a sharp shakeout if the headline disappoints. The setup is strong, but the calendar is the risk. Size for the possibility that 9 August does not go the way the market currently expects.
This analysis will be updated as the market evolves. If this breakdown added value, drop a like 👍 and a comment 💬 to support the work — and share where you see Cardano heading next! Best Regards, BigBeluga 🐳
#ADAUSDT 1 H Spot LONG#ADA
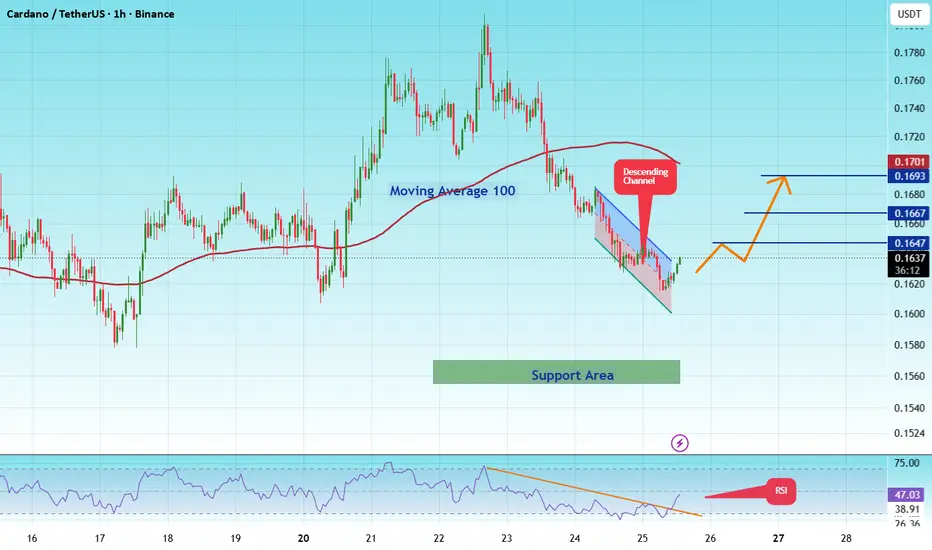
The price is moving within a descending channel on the 1-hour timeframe and has reached the lower boundary. It is now poised for a bounce and is expected to retest this boundary.
The Relative Strength Index (RSI) indicates a downward trend, which is likely to continue given the overbought conditions.
A key support zone has been identified in green at 0.1550. The price has bounced off this zone several times, making it a strong support level.
The price is trending towards the 100-period moving average, which we are approaching. This trend supports an upward move.
Entry Price: 0.1626
Target 1: 0.1647
Target 2: 0.1667
Target 3: 0.1693
You can close at the second target or wait for the third target. The choice is yours.
Stop Loss: At the resistance zone in green.
Remember this simple rule: Money Management.
Any questions? Please leave a comment.
Thank you.
Cardano Bullish RetestCardano is currently trading around a key daily support level after briefly deviating below the established range low. This type of price action is often viewed as a bullish deviation, where liquidity is swept beneath support before buyers step back into the market. The strong reaction from this region suggests demand is beginning to build, making this an important area to monitor over the coming sessions.
As long as ADA continues to hold above the $0.15 support level, the technical outlook remains constructive. Holding this level would confirm the deviation as a successful bullish retest rather than the beginning of a deeper breakdown. This significantly increases the probability of price rotating higher as buyers regain confidence.
The first major upside objective sits around the $0.23 region. This level represents a strong area of technical confluence, combining the Value Area Low from the previous trading range, the VWAP, and historical price acceptance. When multiple technical levels align within the same region, they often become magnets for price during recovery phases.
From a market structure perspective, Cardano appears to be attempting to establish a regional reversal after an extended period of weakness. Although confirmation is still required, the current price action suggests sellers are losing control while buyers gradually absorb supply around support.
If ADA maintains acceptance above the $0.15 support and momentum continues to improve, the probability increases for a rotational move towards the higher levels of the current range, with $0.23 becoming the primary upside target for the next phase of the recovery.
ADA READY TO EXPLODE?Yello Paradisers! Are you prepared for a potential sharp move on #ADA, or are you still underestimating what’s quietly building behind the scenes? At first glance, this structure might seem like a simple and healthy pullback. But when we strip away emotions and analyze the chart objectively, a completely different narrative emerges. This is not random price action — this is a high-risk, high-opportunity zone where discipline matters far more than opinions.
💎#ADA is forming a potential inverse head-and-shoulders pattern and the prices continue to respect its descending support trend-line, while the RSI is showing a clear bullish divergence. Together, these confirmations strengthen the probability of bullish scenario, as long as prices maintains momentum inside the OB + FVG zone, the structure remains constructive. The first major resistance level to monitor is 2330.
💎#ADA has recently printed a classic selling climax, followed by a climactic action candle supported by ultra-high volume. This is a textbook indication of accumulation. Historically, this exact behaviour appears when smart money begins positioning ahead of a larger move. While subtle to the untrained eye, this probability carries significant weight for experienced traders.
💎#ADA has swept the lower trigger line of the selling climax and followed it with a strong momentum candle that broke above the upper trigger line of climactic action bar. It suggests that weak hands are being forced out, while stronger participants are stepping in with conviction. If the prices sustain this momentum, the next upside path can open toward 2870, which is currently acting as a major structural resistance level.
💎If #ADA fails to hold bullish momentum and a momentum candle closes below 1285, the current bullish probability becomes invalid. In that case, we could see further downside pressure.
That is why Paradisers, we are playing it safe right now. If you want to be consistently profitable, you need to be extremely patient and always wait only for the best, highest probability trading opportunities only on confirmations.
MyCryptoParadise
iFeel the success🌴
Cardano (ADA) Price Hits 1-Month High as Whales Buy 240M Coins* ADA climbed above $0.19 for the first time since July after gaining more than 20% in a few days.
* Cardano whales accumulated over 240 million ADA, lifting combined holdings to roughly 14.5 billion ADA.
* The ADA price is testing the $0.198-$0.20 breakout zone, with $0.2575 as the next major resistance level.
The ADA price is finally showing some real signs of life after spending weeks under pressure, the price climbed back above $0.19 for the first time since early July, and the rebound has happened much faster than many traders expected.
In less than a week, ADA added roughly $1.5 billion to its market value, which is a pretty clear sign that fresh money has started flowing back into the market. What stands out even more is who seems to be doing the buying. Large Cardano holders picked up more than 240 million ADA over the past five days, taking combined whale holdings to around 14.5 billion ADA.
We had a look at the ADA charts, and the technical picture has definitely improved. The ADA price is trading around $0.194-$0.195 and is now pressing against a descending resistance trendline that has capped rallies since May.
ADA is already trading above the 4-hour 100-period moving average near $0.1705, and the next major hurdle is the 100-day moving average around $0.198. If buyers can push through the $0.198-$0.20 zone with conviction, the next meaningful target sits near $0.2575.
Momentum is strong, although it is starting to look a bit stretched in the short term. The 4-hour RSI is around 68.2 and the daily RSI is near 68.4, both getting close to the classic overbought threshold at 70. That does not automatically mean a reversal is coming, but it does mean a pause or a short-term pullback would be completely normal after such a quick rebound.
For now, the setup is pretty straightforward. A clean break above $0.20 could open the door to further upside, while a rejection there would put the $0.17-$0.18 support zone back in focus. CoinCodex’s one-month forecast places the ADA price around $0.1986, which lines up almost perfectly with the key breakout level traders are watching right now.
ADA USDT SHORT SIGNAL#.2 ADA/USDT – Trade Setup (SHORT)
📈 Position Type: SHORT
🕒 Timeframe: 1H
📊 Market: Futures
💰 Entry Zone:
0.19
🛑 Stop-Loss:
0.20
🎯 Take-Profit Targets:
• TP1: 0.1865
• TP2: 0.1811
• TP3: 0.1747
• TP4.
Tp5.
⚙️ Leverage:
5 *10
▫️ After TP1, move SL to Entry + 0.2%.
▪️ Exit Plan:
• 50% at TP1
• 25% at TP2
• 25% at TP3
📌 Risk Management:
Risk only 1–2% of your capital per trade.
⚠️ Always check and confirm the setup on your chart before entering the trade.
Cardano: Bulls Face Their First TestRecovery reaches key resistance
Cardano has recovered well from the June low at $0.1382, but the rally has now reached its first significant technical hurdle. Price is testing the $0.19-$0.20 resistance zone, where previous rebounds have stalled.
100/50-Day EMAs add confluence
The bearishly crossed 100/50-day EMAs are converging with the current resistance area, strengthening its importance. Bulls will need to overcome both the moving averages and horizontal resistance to signal a more meaningful recovery.
Breakout would improve the outlook
A convincing break and close above $0.20 would strengthen the bullish case and shift the focus towards the next resistance zone around $0.2312-$0.2350. That area also aligns closely with the 0.618 Fibonacci retracement.
Support remains important
The $0.1544 support level has held on multiple occasions since the June low. Failure to break resistance would increase the probability of another retest of this area.
Momentum improving
RSI has climbed above the 50 level while buying volume has picked up during the latest advance. Although StochRSI has reached overbought territory, momentum has improved compared with recent weeks.
In Summary
Cardano has produced an encouraging recovery from its June lows, but the rally is now facing its first major technical challenge. The $0.19-$0.20 resistance zone, combined with the bearishly crossed 100/50-day EMAs, is likely to determine the next move. A break above $0.20 would strengthen the recovery towards $0.2312-$0.2350, while another rejection would keep the broader bearish trend intact and refocus attention on the $0.1544 support level.
ADA Analyses-13, [July 21, 2026]Welcome to my page! I share daily technical analyses of crypto assets and other charts here.
BINANCE:ADAUSDT
💡Market Analysis:
ADA has broken above the descending trendline and key resistance level with a strong bullish momentum candle. A successful retest of this key level will confirm the continuation of the upward trend toward the next resistance targets.
Key Support & Resistance:
Key Resistance: 0.1943 - 0.2262
Key Support Area: 0.1735 (Key Level) / 0.1560
🎯 Trade Entry & Exit Plan:
Entry : Breakout/Pullback of trendline or key zones with >80% candle body and two waves outside.
Stop Loss : Behind the last wave or the last strong breakout candle.
Take Profit : Minimum R:R 2, with further targets at major horizontal levels (0.1943 & 0.2262).
⚠️Risk Management:
Maximum 1% risk per trade.
❤️Please share your thoughts and comments on this analysis!
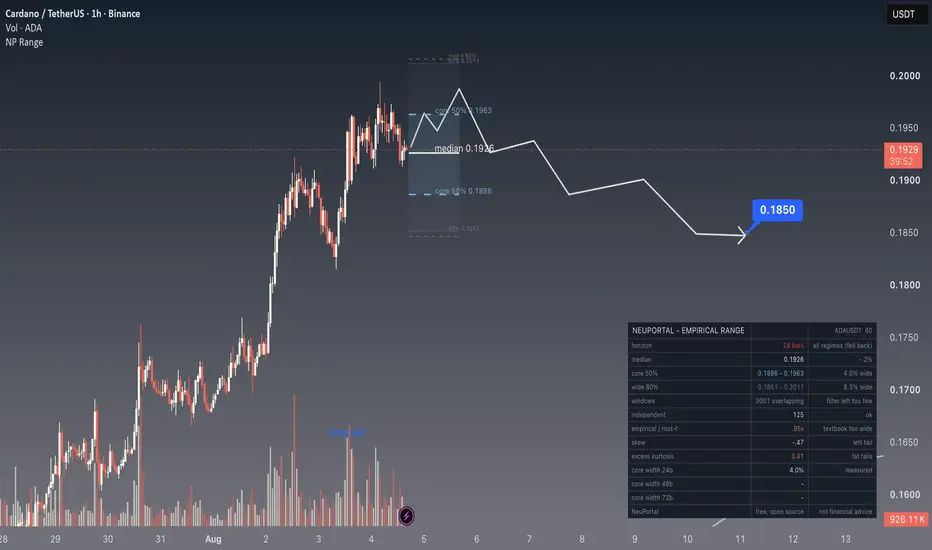
NeuPortal | ADA 24h - core 0.1886-0.1963, twice gold's widthMeasured rather than assumed. Every level here is a quantile of what ADA has actually done over the following 24 one-hour bars on this chart's own history. Nothing is fitted and no distribution is imposed on it.
Median 0.1926
Core 50% 0.1886 - 0.1963 (4.0% of spot)
Wide 80% 0.1851 - 0.2011 (8.3%)
THE CAVEAT PRINTS IN RED, SO IT GOES FIRST
Two rows are flagged. The horizon reads all regimes (fell back) and the window count reads filter left too few. The intent is to keep only windows that opened in conditions close to the present ones; not enough of those existed here, so the estimate reverted to the full sample of 3,001 overlapping windows.
The direction of that error is knowable even where its size is not. Pooling every regime pulls the calm stretches and the violent ones into one figure, which leaves a standing margin for conditions today has not necessarily produced. Our published scoring shows precisely that outcome on our own record: stated fifty per cent intervals holding far more than fifty per cent of results, which is a failure of calibration and the quiet kind. Treat what follows as likelier loose than tight.
The width-scaling cells are empty for the same reason. 4.0% is measured at 24 bars; at 48 and 72 the matched history ran out, and a blank is the correct contents of a cell nobody measured.
TWO INSTRUMENTS, TWO OPPOSITE ERRORS
Worth setting side by side, because the same indicator produced both readings within the hour.
Width. The fifty per cent core here spans 4.0% of spot across twenty-four hours. On gold at the same horizon and resolution that figure is 2.1%. Close to double, and nobody had to decide that a token moves more than a metal - the windows said so.
Error direction of the textbook. Empirical width on ADA is 0.95x the sigma-root-t band, so the conventional formula runs slightly wide. On gold the same ratio prints 1.31x, meaning it runs narrow there. One equation, two markets, errors in opposite directions, which is a fair argument for reading the sample rather than the formula.
Tails are present and unremarkable by the standards of this asset class: skew -0.47, excess kurtosis 3.41. The left side carries more weight, though less lopsidedly than on several instruments we follow.
NO DIRECTIONAL LEAN
The median sits 0.2% under spot, which is a rounding distance rather than a view, and it is published as one.
What this post contains is a distance and the caveats attached to measuring it. No entry, no exit and no level worth defending is proposed anywhere in it.
Educational content - not financial advice.
ADA USDT SHORT SIGNAL#154. ADA/USDT – Trade Setup (SHORT)
📈 Position Type: SHORT
🕒 Timeframe: 1H
📊 Market: Futures
💰 Entry Zone:
0.1779
🛑 Stop-Loss:
0.1835
🎯 Take-Profit Targets:
• TP1: 0.1727
• TP2: 0.1654
• TP3: 0.1577
• TP4. 0.1485
Tp5.
⚙️ Leverage:
5 *10
▫️ After TP1, move SL to Entry + 0.2%.
▪️ Exit Plan:
• 40% at TP1
• 20% at TP2
• 20% at TP3
20% at. Tp4
📌 Risk Management:
Risk only 1–2% of your capital per trade.
⚠️ Always check and confirm the setup on your chart before entering the trade.
ADA: Selling Into a Major Resistance ZoneAfter a strong impulsive rally, **Cardano has reached an area where several technical factors begin to converge**, creating what I believe is an attractive location for a short position.
This trade isn't based on predicting the future.
It's based on probability, market structure, and disciplined risk management.
---
## Why I'm Short Here
Strong rallies often create excitement.
However, experienced traders understand that **location matters more than momentum.**
Rather than chasing higher prices, I prefer waiting for the market to reach areas where the probability begins to shift in favor of sellers.
That's exactly what happened here.
Price rallied directly into a major resistance zone after an impulsive move, offering a clear location to define risk.
---
## Reading the Volume Profile
One of the main reasons behind this trade is the **Volume Profile**.
The current price has reached a region where a significant amount of historical trading activity previously occurred.
These high-volume areas frequently become important decision points because they represent prices where buyers and sellers previously agreed on value.
As price approached this zone, buying momentum began to fade and rejection appeared almost immediately.
That reaction was enough for me to begin building a short position.
---
## Market Structure
Looking at the broader structure, the market remains inside a well-defined trading range.
Although buyers managed to produce a strong rally, they have not yet demonstrated acceptance above the current resistance.
Until that happens, I continue viewing this move as a test of supply rather than the beginning of a sustained breakout.
For now, sellers still have an opportunity to defend this area.
---
## Risk vs. Reward
Every trade begins with one simple question:
**Is the potential reward greater than the predefined risk?**
For this setup, I believe the answer is yes.
My stop sits just above today's rejection high.
If buyers reclaim this resistance and establish acceptance above it, my bearish thesis becomes invalid.
On the other hand, my initial target is the lower support zone around **$0.157**, where previous buying interest emerged.
That creates an attractive asymmetric setup with limited downside risk and meaningful profit potential.
---
## What Needs to Happen Next?
For this bearish scenario to develop, I would like to see:
- Continued rejection below the current resistance.
- Lower highs forming on the lower timeframes.
- Acceptance back below the Point of Control.
- Increasing selling volume.
- A move toward the lower support around **$0.157**.
If these conditions unfold, today's rejection may simply become the beginning of another rotation inside the current trading range.
---
## What Invalidates This Trade?
Every professional trade needs a predefined exit.
If ADA closes above the current resistance and buyers establish acceptance above this area, my short thesis is no longer valid.
There is no reason to argue with price.
Managing risk will always be more important than trying to be right.
---
## Final Thoughts
Markets rarely move in straight lines.
Strong rallies are often followed by periods of profit-taking, especially when price reaches major resistance levels.
That doesn't automatically mean a larger downtrend is beginning.
It simply means the probability of a temporary rejection increases.
From my perspective, ADA has reached one of those decision points.
The risk is clearly defined.
The reward is attractive.
Now it's simply a matter of allowing the market to decide whether this resistance holds or breaks.
---
*This publication reflects my personal interpretation of the current market structure and should not be considered financial advice. Always conduct your own research before making investment decisions.*
---
### What do you think?
**Do you believe ADA is ready to break above resistance, or is this the beginning of another move back toward support?**
I'd love to hear your perspective in the comments.
MAJOR ADA swing retrace [LONG]Crypto continues to hold despite repeated dumps. ADA is a strong candidate for a short squeeze as seen in dominance pair below.
--
🧠DATA DRIVEN signals
FOLLOW and LIKE for more high quality BACKTESTED signals from proprietary ML grade models, capable of accurately inferring phase, amplitude and likelihood unlike any mechanical indicator out there.
#ADA Key Price Range📊#ADA Key Price Range🚀
🧠From a structural perspective, we are still in a downtrend. The price is likely to consolidate sideways between $0.15 and $0.30. Therefore, we can buy low and sell high within this price range.
➡️Wait patiently for a pullback to the yellow zone for a long position!
⚠️Altcoins are highly volatile, so please prioritize risk management when trading!
🤜Follow me to stay informed about market changes. Remember to like💖 and share💬
BYBIT:ADAUSDT.P
NeuPortal | ADA - dip below the core, then a three-week climbThe view: a drop through the lower edge of the measured zone first, then a sustained climb that runs well past the horizon this band actually covers. Both halves of that sentence matter.
MEASURED, 24-bar horizon (about four days on this 4H chart):
Median 0.1551
Core 50% 0.1486 - 0.1625
Wide 80% 0.1416 - 0.1701
125 independent windows, not the 3,001 overlapping ones
FIRST, THE HORIZON MISMATCH, BECAUSE IT IS VISIBLE AND I WOULD RATHER NAME IT THAN LET SOMEONE ELSE: the shaded band ends around Jul 29. The drawn path runs to mid-August. So most of that arrow travels through territory the printed band says nothing about. The endpoint sitting above the band's ceiling is NOT a claim that price beats the 80% zone - it is a claim about a date three weeks past where the zone stops. Anyone reading the picture as "we expect a break of the band" is reading it wrong, and that is my fault for drawing across the edge.
THE PART THAT IS A REAL CLAIM: the dip. The path goes below the 50% core floor at 0.1486 before turning. That is inside the band's own horizon and it is a genuine directional assertion - the model's sealed read for today is a SHORT lean with a median at 0.1569, so the down leg agrees with the engine while the recovery is my own.
WHERE THIS BAND IS WEAK, AND WE FOUND OUT HOW WEAK THIS WEEK: out-of-sample coverage here reads 58.5% in the core against a 50% target and 89.3% wide against 80%. Too wide, not too narrow.
That is not a footnote today. We audited our whole live board this week and found the same defect at scale: 31 of 36 resolved 24-hour forecasts landed inside a stated 50% band. Eighty-six percent. A walk-forward test over 20,058 observations showed the cause was not history length but the absence of regime conditioning - an unconditional band carries an allowance for turbulence that a quiet market has not earned. Conditioning the sample on today's volatility brings coverage to 50.8%.
Our forecast engine now does that. The band you see plotted here still comes from the unconditional script, so read these zones as generous. Fixing the chart is next.
Also on the panel: empirical width is 0.93x the sigma-root-t band, so the textbook formula is too wide on this instrument as well, and the tails are fat (excess kurtosis 1.95) with a mild left skew (-0.14).
Invalidation for the down leg: acceptance back above the core top at 0.1625 before the dip happens.
The forecast is the band. The drawn path is one illustration of a route, and a band is scored on coverage across many calls - which, as of this week, is a number we have publicly failed and publicly fixed.
Educational content - not financial advice, and not a betting tip.
ADAUSD: Accumulation Breakout & Target at 1.618 POIContext: Price successfully broke out of the accumulation zone via BOS and held the broken resistance as local support around 0.1700.
Key Driver: There is an unmitigated Key Imbalance aligning with the upper POI (1.618 Fib Extension) at 0.1780–0.1790.
Scenario: Expecting a continued push toward the 1.618 POI. A local correction into the 0.5 equilibrium area will collect the needed liquidity for the final expansion into the target zone.
🎯 Target Zone: 0.1780 – 0.1790 (1.618 POI / Unmitigated Imbalance)
🛡️ Key Support: 0.1700 – 0.1710