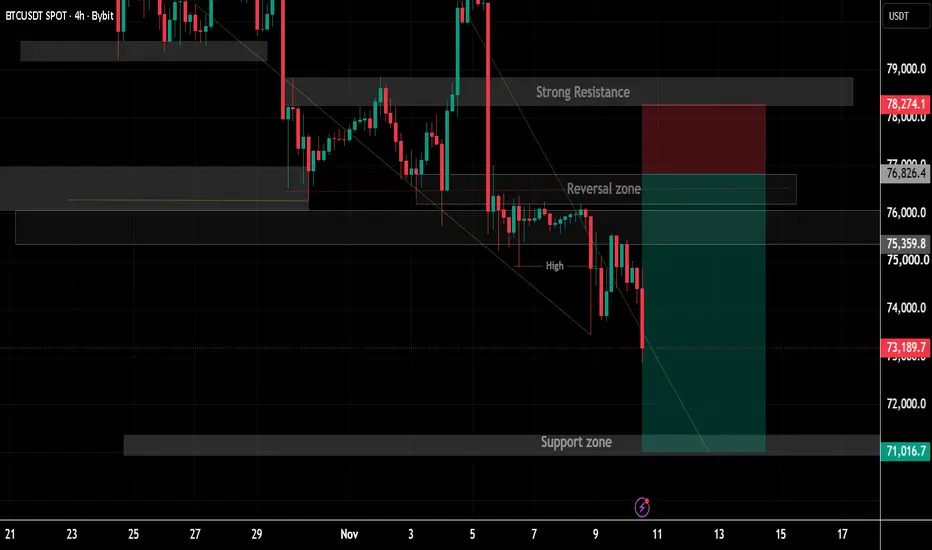
BTCUSDT – Bearish Triangle Breakdown & Downside Expansion Setup📊 BTCUSDT – Bearish Triangle Breakdown & Downside Expansion Setup
🔍 Market Overview
Bitcoin has experienced a decisive breakdown from its previous symmetrical triangle formation on the 4H timeframe. Price failed to maintain the ascending support trendline and subsequently moved below the Ichimoku
Tether USD / Bitcoin
No trades
No trades
Peers for comparison
Open interest
Open interest
Price
Bitcoin (BTC) turns bullish faster than expected · $100,000 nextLadies and gentlemen... Great news today, yesterday, tomorrow and forever more. Bitcoin is turning bullish after the confirmation of the April 2025 low as support.
Two attempts now at this level, yesterday and today; the market is turning green and there is no going back... We are ready for 100K.
BTCUSDT Weekly Analysis | Bearish Outlook Key Support & Downside BTCUSDT – MEGA BEARISH WEEKLY ANALYSIS | WHY BITCOIN COULD DROP FURTHER | GLOBAL POLITICAL & ECONOMIC RISKS
BITCOIN (BTCUSDT) – WEEKLY TIMEFRAME
MARKET BIAS: BEARISH BELOW KEY RESISTANCE
Bitcoin is facing multiple technical and macroeconomic challenges. Our weekly analysis focuses on market str
BTCUSDT Bitcoin is showing early signs of a possible bullish recovery after an extended bearish move within a descending channel. Recent price action indicates that buyers are attempting to defend the key demand zone around 73,500–74,000. The market has reacted positively from this area, suggesting that sel
BTCUSDTHello Traders! 👋
What are your thoughts on Bitcoin ?
Bitcoin continues to trade within a well-defined descending channel, with the broader market structure remaining bearish. Recently, price reached the upper boundary of the channel but faced significant selling pressure and was rejected, reinforc
Bitcoin Price Update – Clean & Clear ExplanationBitcoin is currently showing strong bearish momentum and facing a clear rejection from the 78,000–79,000 strong resistance zone. Price failed to sustain the bullish move above this area and quickly reversed, creating a strong sell-side reaction.
Any unexpected macro news, USD strength, risk-off sen
Bitcoin’s Declining Structure Keeps the 72,300 Scenario RelevantHello traders! Here’s my technical outlook based on the current BTCUSDT (1H) chart structure. BTCUSDT previously formed a Rounding Top near the highs and started to decline under the Trend Line. Price then entered a descending structure and tested the Seller Zone with breakouts.Currently, BTCUSDT is
BTCUSDT Short: The Latest Reaction Favors a Test of Lower PricesHello traders! Here’s my technical outlook based on the current BTCUSDT (4H) chart structure. BTCUSDT previously formed a Double Top near the highs and entered a descending channel. Price then tested the Supply Zone and was rejected.
Currently, BTCUSDT is trading below the 75,100 Supply Zone while
BTCUSDT: An Expanding Wedge Puts the Next Move Up in FocusHello everyone, here is my breakdown of the current BTCUSDT setup.
Market Analysis
BTCUSDT previously traded inside a downward channel before entering an expanding wedge structure. Price then tested the Support Zone near 72,700 with a fake breakout and rebounded, showing signs of buyers defending
BTCUSDT Short: Faces Another Test as the Market Drifts To 73KHello traders! Here’s my technical outlook based on the current BTCUSDT (3H) chart structure. BTCUSDT previously declined inside a descending channel and tested the Supply Zone near 76,600. Price then rejected and continues lower within the channel.
Currently, BTCUSDT is trading below the 76,600 Su
See all ideas
Summarizing what the indicators are suggesting.
Oscillators
Neutral
Oscillators
Neutral
Summary
Neutral
Summary
Neutral
Summary
Neutral
Moving Averages
Neutral
Moving Averages
Neutral
Displays a symbol's price movements over previous years to identify recurring trends.