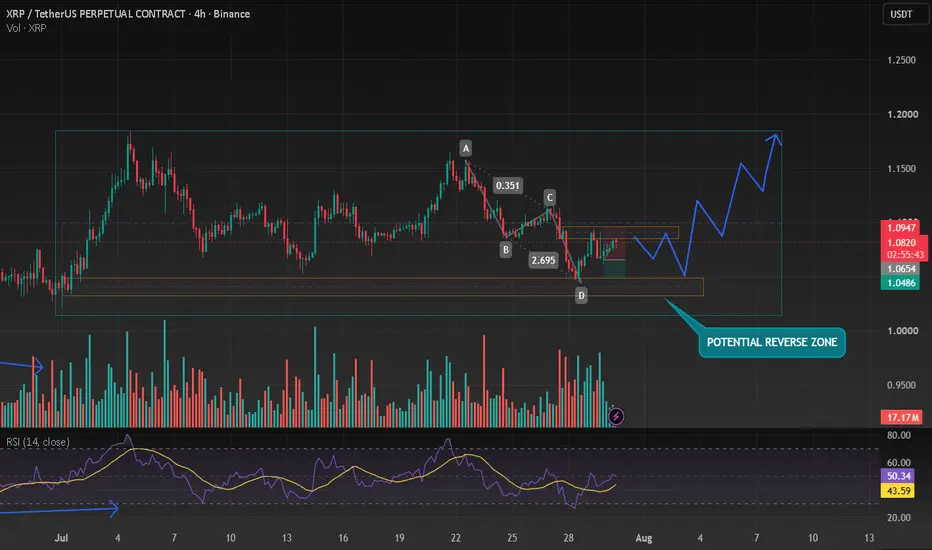
20X XRPUSDT Long trade-numbers—huge 4,400% profits potentialThis will be the riskiest trade ever public on XRPUSDT. It will also be the best ever—guaranteed. Why? Because we have great timing.
Good morning my fellow Cryptocurrency trader, I hope you are having a wonderful day.
When was the last time...
When was the last time that XRP traded at a market bo
XRP - Oversold Zone Ahead!XRP is approaching a strong oversold area, where the psychological $1 round number aligns with the lower boundary of the falling channel. 📊
📌 As long as this confluence continues to hold, we will be looking for buy setups, anticipating a bullish rebound toward the upper boundary of the red channel.
XRP Incredible 10X LONG opportunity with 2020% profits potentialYou might not be reading this. If you are like most people, you already quit the market. If you are like most people, you will only see this, with great FOMO, once XRP reaches $3 or $4. At that time, there will be an incredible rush and impulse to buy. At that time, it will be wrong. Right now is th
XRP PROPOSES NEW UPGRADECRYPTOCAP:XRP The U.S. Senate's path to passing the CLARITY Act, a major crypto market structure bill, hit a significant obstacle. Senate Majority Leader John Thune filed cloture on a different bill, consuming the limited floor time needed to advance the CLARITY Act before the August recess. The bi
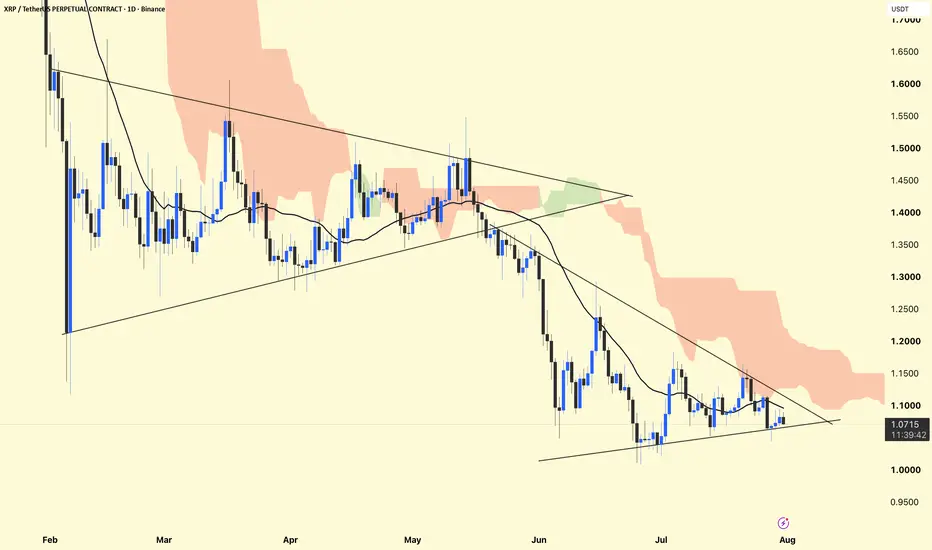
XRPUSDT | 1H Technical Analysis...XRPUSDT | 1H Technical Analysis
The chart shows XRP trading inside a symmetrical triangle, with price compressing between a descending resistance trendline and a rising support trendline. This pattern suggests that volatility is decreasing and a breakout may determine the next directional move. The
$XRP: Situation Breakdown. 04/08 BYBIT:XRPUSDT.P
Friends, today's CRYPTOCAP:XRP breakdown is by subscriber request. Let me put it this way: the CRYPTOCAP:XRP setup is highly mixed right now. Price has been trading at 📊M-Levels (Institutional Interest Levels) monthly support for over a month. 🧩IMA shows that retail and 🐋WhaleP
XRPUSDT Accumulation between levelsRipple is currently in one of its most interesting phases from an analytical perspective. The price is squeezed between daily resistance and weekly support, within which an accumulation has formed. This structure typically indicates a temporary balance between supply and demand, but such a situation
#XRPUSDT — Holding the Last Fortres, Recovery or Final Break#XRP
The price is moving within a descending channel on the 1-hour timeframe and has reached the lower boundary. It is now poised for a bounce and is expected to retest this boundary.
The Relative Strength Index (RSI) indicates a downward trend, which is likely to continue given the overbought con
Ripple (XRP). Ripple (XRP)
XRP fell by 3% this week and is back just above the $1 support level. This price action has also formed a pennant. That could highlight a continuation of the prevailing trend once the asset escapes it. In this case, that’s bearish.
The volume also continues to fall, forming clear lowe
See all ideas
Summarizing what the indicators are suggesting.
Oscillators
Neutral
SellBuy
Strong sellStrong buy
Strong sellSellNeutralBuyStrong buy
Oscillators
Neutral
SellBuy
Strong sellStrong buy
Strong sellSellNeutralBuyStrong buy
Summary
Neutral
SellBuy
Strong sellStrong buy
Strong sellSellNeutralBuyStrong buy
Summary
Neutral
SellBuy
Strong sellStrong buy
Strong sellSellNeutralBuyStrong buy
Summary
Neutral
SellBuy
Strong sellStrong buy
Strong sellSellNeutralBuyStrong buy
Moving Averages
Neutral
SellBuy
Strong sellStrong buy
Strong sellSellNeutralBuyStrong buy
Moving Averages
Neutral
SellBuy
Strong sellStrong buy
Strong sellSellNeutralBuyStrong buy
Displays a symbol's price movements over previous years to identify recurring trends.