Bullish bounce at 61.8% Fib support?USD/ZAR is falling towards the pivot, which is a pullback support that aligns with the 61.8% Fibonacci retracement and could bounce toward the 1st resistance.
Pivot: 16.47679
1st Support: 16.32801
1st Resistance: 16.7850
Disclaimer:
The opinions given above constitute general market commentary a
U.S. Dollar / South African Rand
No trades
No trades
Compare with USD to ZAR
Pair info
The U.S. Dollar vs. the South African Rand. The Rand was and became legal tender in the late 50’s to early 60’s for South Africa, Swaziland, Lesotho and Namibia after moving away from the Pound. After the apartheid era sanctions the Rand experienced a great deal of volatility and depreciation.
Bullish bounce setup?USD/ZAR is falling towards the pivot, which is a pullback support, and could bounce towards the 1st resistance, which is also a pullback resistance.
Pivot: 16.46990
1st Support: 16.27674
1st Resistance: 16.89271
Disclaimer:
The opinions given above constitute general market commentary and do not
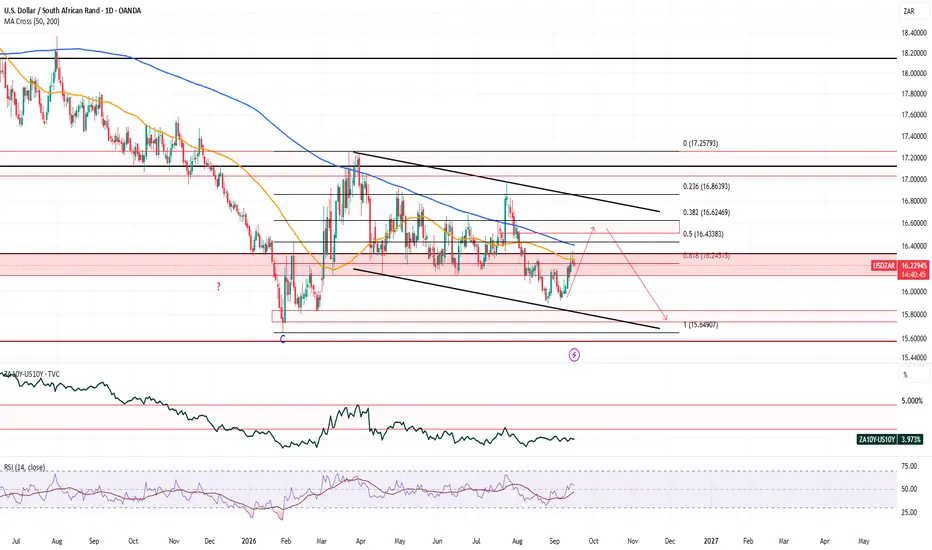
Daily USDZAR pre-FedThe red range between 16.15 and 16.30 which has supported the pair throughout the year has now flipped from a support to a resistance. This range along with the 50-day MA has limited the rand’s losses after the ECB rate hike and escalated geopolitical tension.
Moving over to the Federal reserve,
Bullish bounce setup?USD/ZAR is falling towards the pivot, which is a pullback support and could bounce towards the 1st resistance.
Pivot: 16.27609
1st Support: 16.09724
1st Resistance: 16.55277
Disclaimer:
The opinions given above constitute general market commentary and do not constitute the opinion or advice of I
Bearish reversal at Fib resistance?USD/ZAR is rising towards the pivot, which is a pullback resistance that aligns with the 127.2% Fibonacci extension and could reverse towards the 1st support.
Pivot: 16.54589
1st Support: 16.27674
1st Resistance: 16.89271
Disclaimer:
The opinions given above constitute general market commentary
Bullish momentum building?USD/ZAR is falling towards the pivot, which is a pullback support and could bounce towards the 1st resistance, which is a pullback resistance.
Pivot: 16.18034
1st Support: 16.06842
1st Resistance: 16.34725
Disclaimer:
The opinions given above constitute general market commentary and do not const
USDZAR (WEEKLY CHART): Greenback Threatens Massive OffensiveThe Rand is showing clear signs of exhaustion, and the weekly chart is starting to tell a story that USDZAR bulls will want to pay close attention to.
**Support Has Held — For Now**
The recent low, defined by the 61.8% retracement off the 2021 low (15.90), was reinforced by the 2018 high at 15.70.
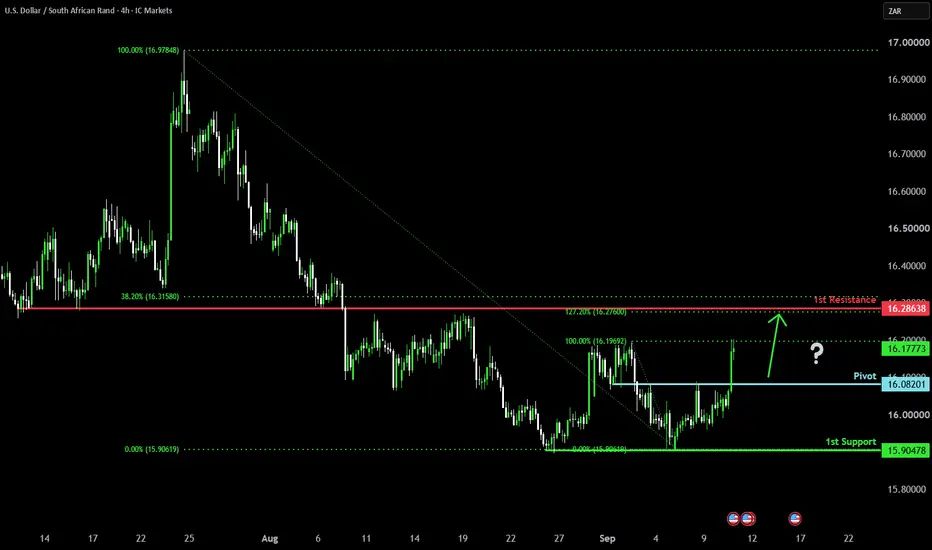
Bullish bounce setup?USD/ZAR is falling towards the pivot and could bounce towards the 1st resistance, which is an overlap resistance that lines up witht he 38.2% Fibonacci retracement.
Pivot: 16.08201
1st Support: 15.90478
1st Resistance: 16.28638
Disclaimer:
The opinions given above constitute general market comme
USDZAR - Retesting longterm channelAs the US-Israeli war with Iran goes on and on, the TVC:DXY may find buyers which will lead to strength on the dollar pairs around the world.
FX:USDZAR is an interesting choice as price keeps retesting the bottom line of a long term channel which could be an area of interest over the coming mo
See all ideas
Summarizing what the indicators are suggesting.
Oscillators
Neutral
Oscillators
Neutral
Summary
Neutral
Summary
Neutral
Summary
Neutral
Moving Averages
Neutral
Moving Averages
Neutral
Displays a symbol's price movements over previous years to identify recurring trends.
Frequently asked questions
The current rate of USDZAR is 16.48008 ZAR — it has decreased by −0.15% in the past 24 hours. See more of USDZAR rate dynamics on the detailed chart.
The value of the USDZAR pair is quoted as 1 USD per x ZAR. For example, if the pair is trading at 1.50, it means it takes 1.5 ZAR to buy 1 USD.
The term volatility describes the risk related to the changes in an asset's value. USDZAR has the volatility rating of 0.73%. Track all currencies' changes with our live Forex Heatmap and prepare for markets volatility.
The USDZAR showed a −0.78% fall over the past week, the month change is a 0.59% rise, and over the last year it has decreased by −5.02%. Track live rate changes on the USDZAR chart.
Learn how you can make money on rate changes in numerous trading ideas created by our community.
Currencies are usually traded through forex brokers — choose the one that suits your needs and go ahead. You can trade USDZAR right from TradingView charts — just log in to you broker account. Check out the list of our integrated brokers and find the best one for your needs and strategy.
When deciding to buy or sell currency one should keep in mind many factors including current geopolitical situation, interest rates, and other. But before plunging into a deep research, you can start with USDZAR technical analysis. The technical rating for the pair is buy today, but don't forget that markets can be very unstable, so don't stop here. According to our 1 week rating the USDZAR shows the neutral signal, and 1 month rating is sell. See more of USDZAR technicals for a more comprehensive analysis.