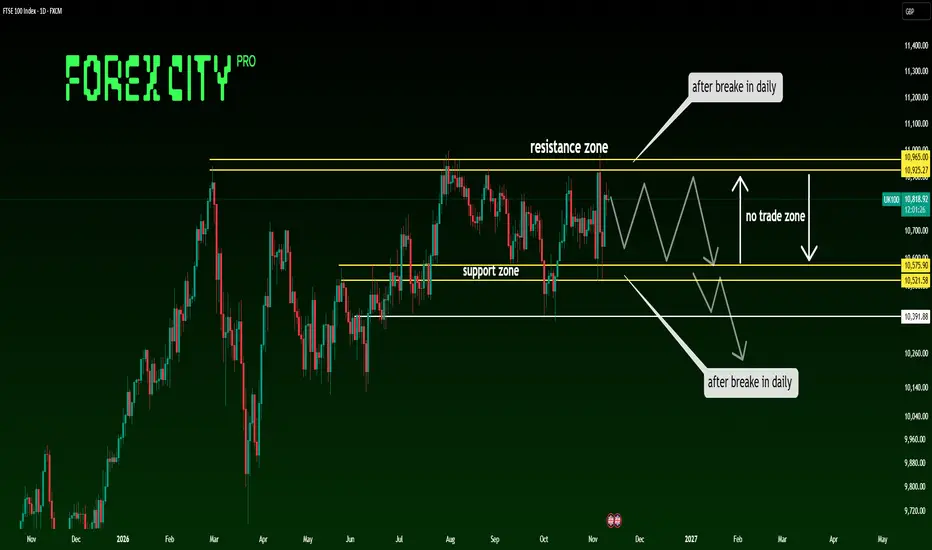
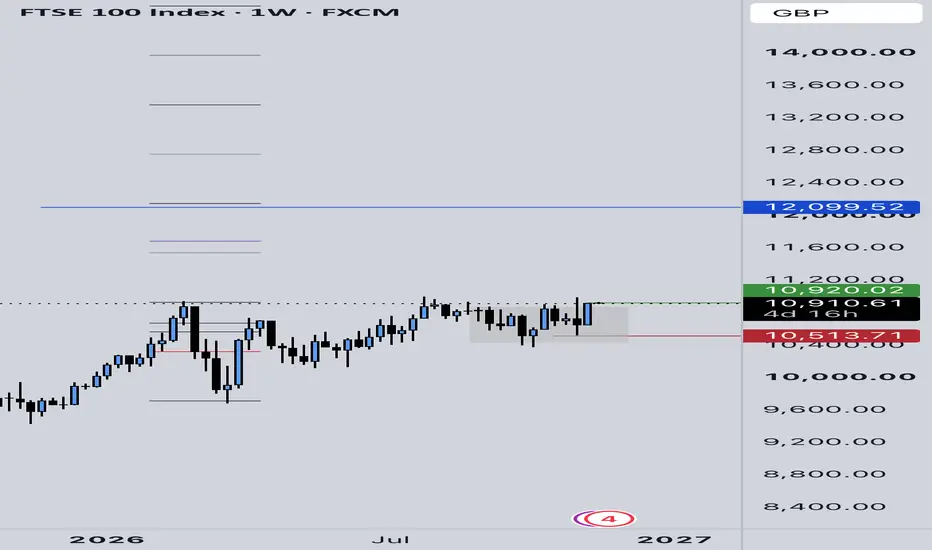
FTSE 100 | Geopolitical Risks, AI Bubble Fears & Inflation FTSE 100 | Geopolitical Risks, AI Bubble Fears & Inflation — Waiting for a Decisive Breakout!
Hello everyone, and welcome back to all my TradingView followers! 👋📊
Today, we are taking a closer look at the **FTSE 100 (UK100)** from both a fundamental and technical perspective.
The index is curren
Index info
The UK Financial Times Stock Exchange 100, more commonly known as the FTSE 100 or 'Footsie', is an index of share prices of the largest 100 companies listed on the London Stock Exchange (LSE) by market capitalization. The index was launched on January 3, 1984 at a base value of 1000, and the index level is calculated in real-time. The FTSE 100 represents approximately 81% of the entire market capitalization of the LSE, and even though it doesn't encompass the whole market, it is widely viewed as the best indicator of the heath of UK stocks. In recent years, however, given the uptick in international companies counted in the FTSE 100, this particular market index is no longer viewed as the best health indicator of the UK economy - that goes to the FTSE 250, which has a smaller proportion of multinationals among its constituents.
FTSE 100: higher lows press on 11,005, breakout eyes 11,195The FTSE 100 set an all-time high at 11,005 on 5 November and was rejected hard, falling more than 450 points in a day and a half. What has happened since is the interesting part. Instead of rolling over, the index has climbed back in steps, with each dip stopping higher than the last: 10,543 on 6 N
UK100FT 2H: Resistance Rejection Puts Support Levels in Focus UK100FT 2H: Resistance Rejection Puts Support Levels in Focus
UK100FT is testing the 10,875–10,900 resistance area after a strong bullish rally within an ascending channel. Price is showing hesitation near resistance, increasing the possibility of a corrective pullback toward the marked support zo
Bull Monday rise and dipGlobal financial markets begin the new trading week with signs of recovery following one of the most turbulent periods for technology shares in recent months.
Asian equities are rebounding, US stock futures are higher, and investors are cautiously returning to semiconductor companies following last
UK100 — Bullish Expansion Toward 10,767The UK100 is shaping a potential recovery phase, with the current technical picture highlighting 10,767 as the next upside objective. The developing structure suggests that the index could attract renewed buying interest and work its way toward higher price territory.
Rather than focusing on short-
New Month money with 10680 10656 supportThe FTSE is starting November with a weaker short-term technical picture. Friday's attempted recovery has faded, and the index is trading below its daily pivot, with the 30-minute chart showing a sequence of lower highs.
However, the daily chart is still relatively neutral. Price is sitting close t
Today's bias: Neutral to bearish below 10730-10760Global financial markets begin an exceptionally important week with investors balancing three competing influences: elevated oil prices, uncertainty surrounding artificial intelligence investment, and a series of major central bank decisions.
The Federal Reserve, European Central Bank and Bank of J
Potential bullish rise?UK100 is falling towards the pivot and could bounce toward the 1st resistance.
Pivot: 10,738.08
1st Support: 10,620.17
1st Resistance: 10,915.23
Disclaimer:
The opinions given above constitute general market commentary and do not constitute the opinion or advice of IC Markets or any form of pers
See all ideas
Displays a symbol's value movements over previous years to identify recurring trends.
Frequently asked questions
The safest way to invest in FTSE 100 Index is through a reliable broker. Create an account, fund it, and place a buy order for index futures or other derivatives.
You can trade FTSE 100 Index directly from TradingView:
– Choose a broker: Explore our supported trading partners and pick one that fits your needs
– Compare options: View available brokers side by side to evaluate fees and features
– Connect your account: Open Supercharts, click "Trade", select your broker, and log in
– Start trading: Place orders without leaving the chart
Tip: If you're new to trading, try paper trading first — it lets you practice strategies in real market conditions without risking funds.
You can trade FTSE 100 Index directly from TradingView:
– Choose a broker: Explore our supported trading partners and pick one that fits your needs
– Compare options: View available brokers side by side to evaluate fees and features
– Connect your account: Open Supercharts, click "Trade", select your broker, and log in
– Start trading: Place orders without leaving the chart
Tip: If you're new to trading, try paper trading first — it lets you practice strategies in real market conditions without risking funds.