$CS | Solid Insurance Franchise, Awaiting Breakout ConfirmationAXA EURONEXT:CS
This analysis reflects personal views and does not constitute financial advice. Always conduct your own due diligence before making any investment decision.
AXA continues to deliver as a dependable insurance franchise, combining steady top line growth with an attractive divide
AXA SA
No trades
No trades
Compare with AXA SA
4.54 EUR
9.62 B EUR
109.23 B EUR
1.92 B
Next report date
—
Report period
—
EPS estimate
—
Revenue estimate
—
Details
Sector
Industry
CEO
Thomas Buberl
Website
Headquarters
Paris
Founded
1957
IPO date
Sep 25, 2000
ISIN
FR0000120628
FIGI
BBG00HVY2JQ1
Identifiers
ISIN FR0000120628
AXA SA engages in the provision of insurance and asset management services. It operates through the following segments: France; Europe; AXA XL; Asia, Africa, and EME-LATAM; AXA Investment Managers (AXA IM); and Transversal Entities and Other. The France segment includes the life, health and damages, AXA Banque France, and French holdings. The Europe segment refers to life, health activities, and damage in Switzerland, Germany, Belgium and Luxembourg, Spain, Italy, United Kingdom, and Ireland. The AXA XL segment focuses on the activity's damages of the XL Group in the United States, United Kingdom, France, Germany, Australia, Switzerland, the Netherlands, Italy, Spain, Bermuda, and Canada. The Asia, Africa, and EME-LATAM segment covers life, health, and property activities in Japan, Hong Kong, the Philippines, Thailand, and China. The AXA IM segment is involved in asset management activity. The Transversal Entities and Other segment relates to XA Assistance, AXA Liabilities Managers, AXA SA, and other central holdings. The company was founded in 1852 and is headquartered in Paris, France.
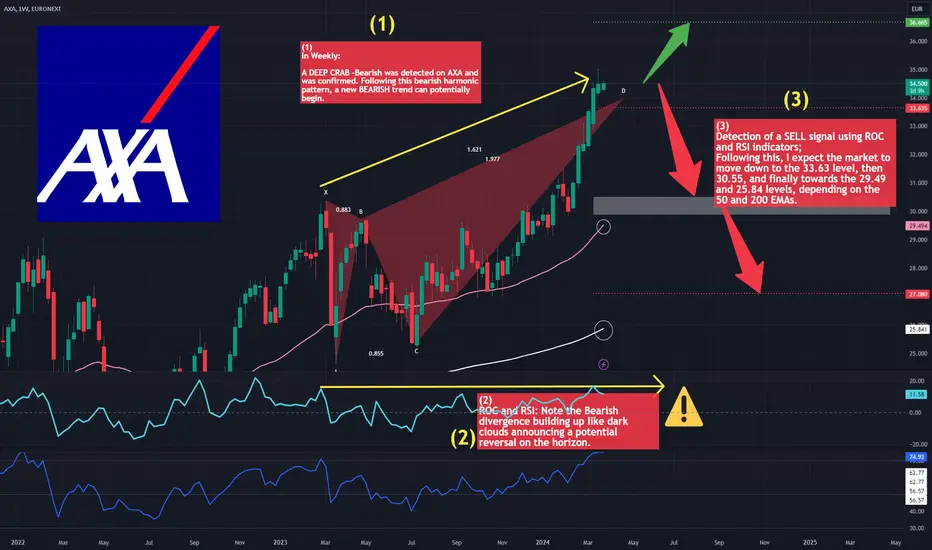
AXA: Bearish -DEEP CRAB detected.AXA: Lower-DEEP CRAB detected.
(1)
In Weekly:
A DEEP CRAB -Bearish was detected on AXA and was confirmed. Following this bearish harmonic pattern, a new BEARISH trend can potentially begin.
(2)
ROC and RSI: Note the Bearish divergence building up like dark clouds announcing a potential reversal o
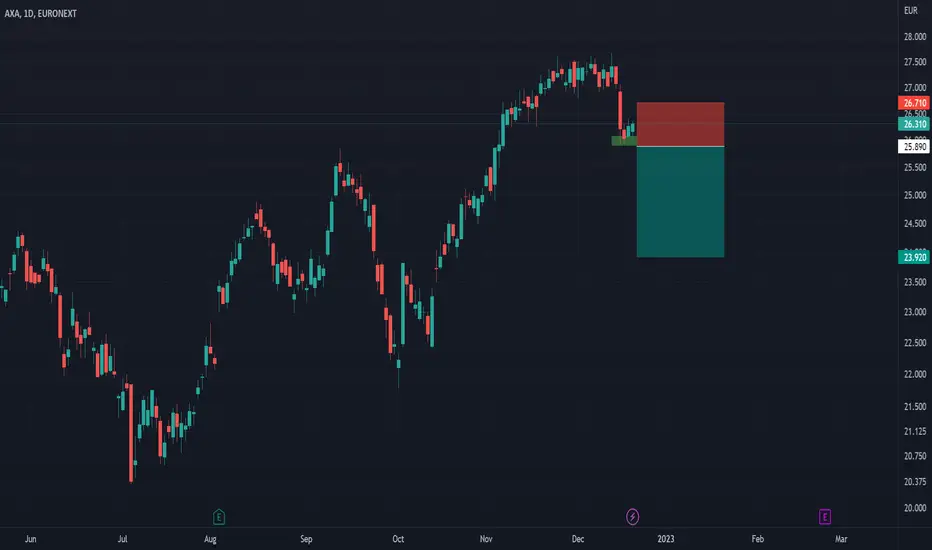
AXA has turned negative.Axa - 30d expiry - We look to Sell a break of 25.89 (stop at 26.71)
We are trading at overbought extremes.
Short term bias has turned negative.
Short term MACD has turned negative.
The bearish engulfing candle on the daily chart is negative for sentiment.
There is no clear indication that the
AXA to correct lower.Axa - Intraday - We look to Sell a break of 26.19 (stop at 27.11)
We are trading at overbought extremes.
Posted a Double Top formation.
Bearish divergence is expected to cap gains.
A higher correction is expected.
Although the bulls are in control, the stalling positive momentum indicates a tu
See all ideas
Summarizing what the indicators are suggesting.
Neutral
SellBuy
Strong sellStrong buy
Strong sellSellNeutralBuyStrong buy
Neutral
SellBuy
Strong sellStrong buy
Strong sellSellNeutralBuyStrong buy
Neutral
SellBuy
Strong sellStrong buy
Strong sellSellNeutralBuyStrong buy
An aggregate view of professional's ratings.
Neutral
SellBuy
Strong sellStrong buy
Strong sellSellNeutralBuyStrong buy
Neutral
SellBuy
Strong sellStrong buy
Strong sellSellNeutralBuyStrong buy
Neutral
SellBuy
Strong sellStrong buy
Strong sellSellNeutralBuyStrong buy
Displays a symbol's price movements over previous years to identify recurring trends.
6.241% YTM
Maturity dateMar 31, 2045
Coupon5.50% (Fixed)
5.907% YTM
Maturity dateDec 15, 2043
Coupon5.25% (Fixed)
— YTM
Maturity date—
Coupon4.50% (Fixed)
3.736% YTM
Maturity dateJun 25, 2035
Coupon0.13% (Fixed)
3.672% YTM
Maturity dateMay 31, 2034
Coupon3.38% (Fixed)
3.575% YTM
Maturity dateJan 10, 2033
Coupon3.63% (Fixed)
3.482% YTM
Maturity dateJun 17, 2029
Coupon3.45% (Fixed)
3.320% YTM
Maturity dateOct 12, 2030
Coupon3.75% (Fixed)
2.832% YTM
Maturity dateMay 15, 2028
Coupon1.13% (Fixed)
— YTM
Maturity dateJan 17, 2047
Coupon5.13% (Variable)
— YTM
Maturity dateMay 17, 2032
Coupon0.42% (Variable)
See all CS bonds
Weight0.18%
Market value1.20 B
Weight0.25%
Market value797.02 M
Weight0.33%
Market value606.88 M
Weight3.43%
Market value323.13 M
Weight3.43%
Market value323.13 M
Weight3.43%
Market value323.13 M
Weight3.43%
Market value323.13 M
Weight0.37%
Market value282.06 M
Weight1.80%
Market value251.21 M
Weight1.80%
Market value251.21 M
Weight4.44%
Market value223.56 M
Explore more ETFs
Frequently asked questions
The current price of CS is 44.72 EUR — it has increased by 0.09% in the past 24 hours. Watch AXA SA stock price performance more closely on the chart.
Depending on the exchange, the stock ticker may vary. For instance, on VIE exchange AXA SA stocks are traded under the ticker CS.
CS stock has risen by 0.61% compared to the previous week, the month change is a 4.88% rise, over the last year AXA SA has showed a 5.08% increase.
We've gathered analysts' opinions on AXA SA future price: according to them, CS price has a max estimate of 77.10 EUR and a min estimate of 40.32 EUR. Watch CS chart and read a more detailed AXA SA stock forecast: see what analysts think of AXA SA and suggest that you do with its stocks.
CS stock is 0.18% volatile and has beta coefficient of 0.79. Track AXA SA stock price on the chart and check out the list of the most volatile stocks — is AXA SA there?
Today AXA SA has the market capitalization of 92.01 B, it has increased by 1.08% over the last week.
Yes, you can track AXA SA financials in yearly and quarterly reports right on TradingView.
AXA SA is going to release the next earnings report on Jul 30, 2026. Keep track of upcoming events with our Earnings Calendar.
CS earnings for the last half-year are 1.80 EUR per share, whereas the estimation was 1.81 EUR, resulting in a −0.55% surprise. The estimated earnings for the next half-year are 2.20 EUR per share. See more details about AXA SA earnings.
AXA SA revenue for the last half-year amounts to 37.86 B EUR, despite the estimated figure of 45.32 B EUR. In the next half-year revenue is expected to reach 38.26 B EUR.
CS net income for the last half-year is 5.79 B EUR, while the previous report showed 3.84 B EUR of net income which accounts for 0.00% change. Track more AXA SA financial stats to get the full picture.
Yes, CS dividends are paid annually. The last dividend per share was 2.32 EUR. As of today, Dividend Yield (TTM)% is 5.18%. Tracking AXA SA dividends might help you take more informed decisions.
AXA SA dividend yield was 5.66% in 2025, and payout ratio reached 51.06%. The year before the numbers were 6.26% and 61.30% correspondingly. See high-dividend stocks and find more opportunities for your portfolio.
As of Jul 24, 2026, the company has 103.42 K employees. See our rating of the largest employees — is AXA SA on this list?
Like other stocks, CS shares are traded on stock exchanges, e.g. Nasdaq, Nyse, Euronext, and the easiest way to buy them is through an online stock broker. To do this, you need to open an account and follow a broker's procedures, then start trading. You can trade AXA SA stock right from TradingView charts — choose your broker and connect to your account.
Investing in stocks requires a comprehensive research: you should carefully study all the available data, e.g. company's financials, related news, and its technical analysis. So AXA SA technincal analysis shows the buy rating today, and its 1 week rating is buy. Since market conditions are prone to changes, it's worth looking a bit further into the future — according to the 1 month rating AXA SA stock shows the strong buy signal. See more of AXA SA technicals for a more comprehensive analysis.
If you're still not sure, try looking for inspiration in our curated watchlists.