ENGIE S.A.
No trades
No trades
Compare with ENGIE S.A.
1.58 EUR
3.69 B EUR
71.94 B EUR
1.86 B
Next report date
—
Report period
—
EPS estimate
—
Revenue estimate
—
Details
Sector
Industry
CEO
Catherine MacGregor
Website
Headquarters
Paris
Founded
1954
IPO date
Jul 7, 2005
ISIN
FR0010208488
FIGI
BBG00HVY2PZ7
Identifiers
ISIN FR0010208488
ENGIE SA engages in the provision of electricity, natural gas, and energy related services. It operates through the following segments: Renewables, Networks, Energy Solutions, Thermal, Supply, Nuclear, and Others. The Renewables segment is involved in the renewable energy generation activities, including financing, construction, operation and maintenance of renewable energy facilities, using various energy sources such as hydroelectric, onshore wind, photovoltaic solar, biomass, offshore wind, and geothermal. The Networks segment focuses on electricity and gas infrastructure activities and projects. The Energy Solutions segment consists of construction and management of decentralized energy networks to produce low-carbon energy heating and cooling networks, distributed power generation plants, distributed solar power parks, low-carbon mobility, low-carbon cities, public lighting, and related services. The Thermal segment centralized power generation activities using thermal assets, whether contracted or not includes the operation of power plants fueled mainly by gas or coal, as well as pump-operated storage plants. The Supply segment relates to the sale of gas and electricity to end customers, whether professional or individual. It also includes all the group's activities in services for residential clients. The Nuclear segment refers to nuclear power generation activities with seven reactors in Belgium and drawing rights in France. The Others segment encompasses energy management and optimization activities, the B2B supply activities in France, GTT, corporate, and holding activities. The company was founded on April 8, 1946 and is headquartered in Paris, France.
ENGI - 7 months RECTANGLE══════════════════════════════
Since 2014, my markets approach is to spot
trading opportunities based solely on the
development of
CLASSICAL CHART PATTERNS
🤝Let’s learn and grow together 🤝
══════════════════════════════
Hello Traders ✌
After a careful consideration I came to the conclusion that:
-
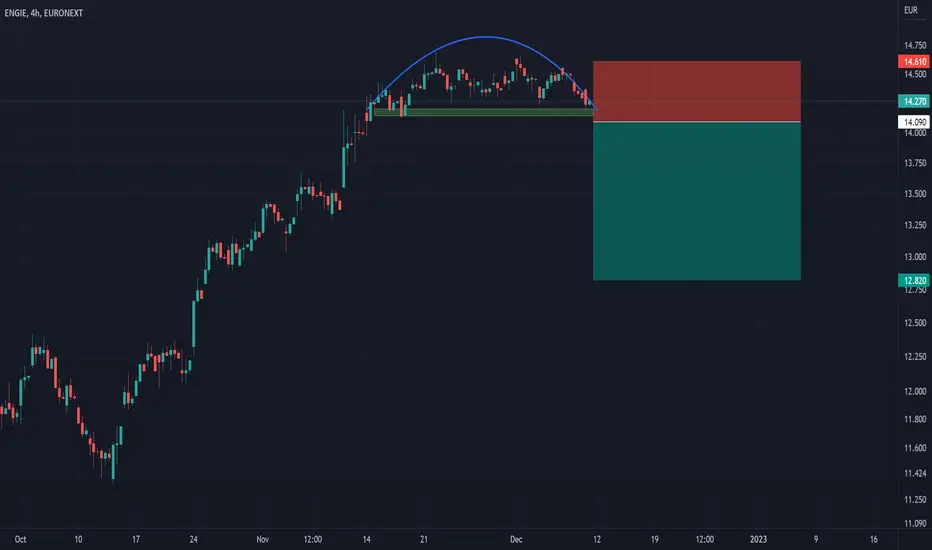
Engie's stalling momentum signifies turnaround.Engie - 30d expiry - We look to Sell a break of 14.09 (stop at 14.61)
We are trading at overbought extremes.
Although the bulls are in control, the stalling positive momentum indicates a turnaround is possible.
Short term RSI is moving lower.
Momentum is stalling with the posting of new highs
Engie found buyers at 50% pullback.Engie - 30d expiry - We look to Buy a break of 12.42 (stop at 12.04)
Daily signals are mildly bullish.
A break of resistance at 12.40 should lead to a more aggressive move higher towards 13.00.
Trading has been mixed and volatile.
Expect trading to remain mixed and volatile.
Levels close to th
[Investment] ENGI longHello fellow traders,
This investment idea might be for you if you are interested in the energy sector. I've already opened my position with a sniper entry (for now). Take this for what you want, I did not do any fundamental analysis.
Since this is an investment, I am prepared to add to my postion,
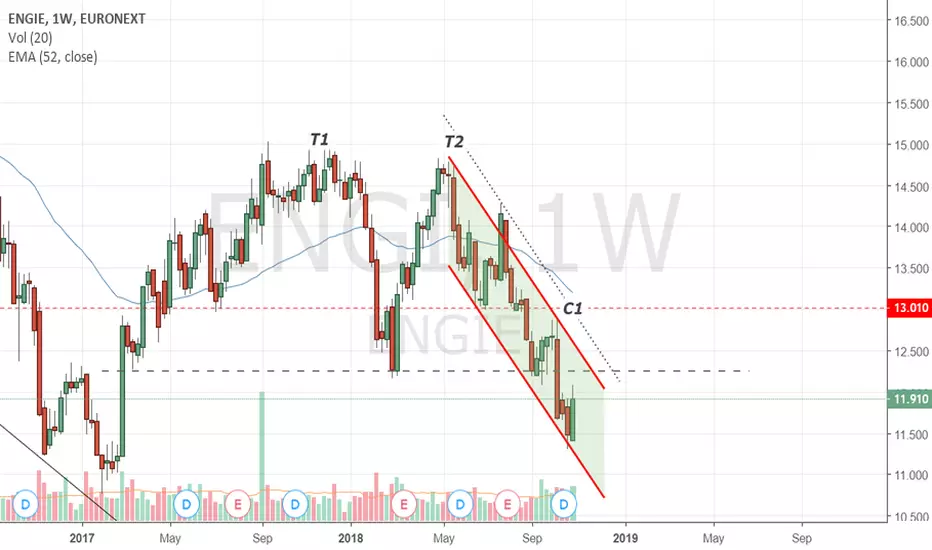
Engie : possible support ...Engie was since begin 2017 in a uptrend, it even breaked through the resistance at 15€ in februari 2020 ... then "corona" hits the market.
Possible it find support at the levels of the bottom of 2013 (point 1) and 2017 (point 2)
Maybe it returns to his uptrend again if the markets go "normal" again.
LONG STILL ON ENGIE$ENGI.PA (Engie) - Alerted last at €15.19 now €16.16
Form : Bullish
ENGIE trades on a P/E ratio of 43.9, With meaningful debt and a lack of recent earnings growth, the market has high expectations that the business will earn more in the future.
The company pointed out it has to enhance the growth
See all ideas
Summarizing what the indicators are suggesting.
Neutral
SellBuy
Strong sellStrong buy
Strong sellSellNeutralBuyStrong buy
Neutral
SellBuy
Strong sellStrong buy
Strong sellSellNeutralBuyStrong buy
Neutral
SellBuy
Strong sellStrong buy
Strong sellSellNeutralBuyStrong buy
An aggregate view of professional's ratings.
Neutral
SellBuy
Strong sellStrong buy
Strong sellSellNeutralBuyStrong buy
Neutral
SellBuy
Strong sellStrong buy
Strong sellSellNeutralBuyStrong buy
Neutral
SellBuy
Strong sellStrong buy
Strong sellSellNeutralBuyStrong buy
Displays a symbol's price movements over previous years to identify recurring trends.
6.848% YTM
Maturity dateApr 3, 2053
Coupon5.63% (Fixed)
6.780% YTM
Maturity dateOct 28, 2050
Coupon5.75% (Fixed)
6.706% YTM
Maturity dateOct 1, 2060
Coupon5.00% (Fixed)
6.359% YTM
Maturity dateFeb 26, 2042
Coupon5.38% (Fixed)
6.355% YTM
Maturity dateJun 24, 2036
Coupon6.10% (Fixed)
6.295% YTM
Maturity dateNov 15, 2040
Coupon5.88% (Fixed)
6.239% YTM
Maturity dateOct 2, 2039
Coupon5.38% (Fixed)
6.157% YTM
Maturity dateApr 10, 2054
Coupon5.88% (Fixed)
5.982% YTM
Maturity dateApr 10, 2054
Coupon5.88% (Fixed)
5.955% YTM
Maturity dateNov 12, 2036
Coupon6.25% (Fixed)
5.746% YTM
Maturity dateJun 24, 2031
Coupon5.49% (Fixed)
See all ENGI bonds
Frequently asked questions
The current price of ENGI is 27.85 EUR — it has increased by 0.91% in the past 24 hours. Watch ENGIE S.A. stock price performance more closely on the chart.
Depending on the exchange, the stock ticker may vary. For instance, on VIE exchange ENGIE S.A. stocks are traded under the ticker ENGI.
ENGI stock has risen by 3.92% compared to the previous week, the month change is a 4.35% rise, over the last year ENGIE S.A. has showed a 41.41% increase.
We've gathered analysts' opinions on ENGIE S.A. future price: according to them, ENGI price has a max estimate of 33.50 EUR and a min estimate of 27.00 EUR. Watch ENGI chart and read a more detailed ENGIE S.A. stock forecast: see what analysts think of ENGIE S.A. and suggest that you do with its stocks.
ENGI reached its all-time high on Feb 26, 2026 with the price of 29.59 EUR, and its all-time low was 8.68 EUR and was reached on Apr 3, 2020. View more price dynamics on ENGI chart.
See other stocks reaching their highest and lowest prices.
ENGI stock is 0.90% volatile and has beta coefficient of 0.21. Track ENGIE S.A. stock price on the chart and check out the list of the most volatile stocks — is ENGIE S.A. there?
Today ENGIE S.A. has the market capitalization of 70.43 B, it has decreased by −1.10% over the last week.
Yes, you can track ENGIE S.A. financials in yearly and quarterly reports right on TradingView.
ENGIE S.A. is going to release the next earnings report on Jul 31, 2026. Keep track of upcoming events with our Earnings Calendar.
ENGI net income for the last half-year is 905.00 M EUR, while the previous report showed 2.92 B EUR of net income which accounts for 0.00% change. Track more ENGIE S.A. financial stats to get the full picture.
ENGIE S.A. dividend yield was 6.02% in 2025, and payout ratio reached 88.92%. The year before the numbers were 9.67% and 89.05% correspondingly. See high-dividend stocks and find more opportunities for your portfolio.
As of Jul 24, 2026, the company has 90 K employees. See our rating of the largest employees — is ENGIE S.A. on this list?
EBITDA measures a company's operating performance, its growth signifies an improvement in the efficiency of a company. ENGIE S.A. EBITDA is 13.88 B EUR, and current EBITDA margin is 18.96%. See more stats in ENGIE S.A. financial statements.
Like other stocks, ENGI shares are traded on stock exchanges, e.g. Nasdaq, Nyse, Euronext, and the easiest way to buy them is through an online stock broker. To do this, you need to open an account and follow a broker's procedures, then start trading. You can trade ENGIE S.A. stock right from TradingView charts — choose your broker and connect to your account.
Investing in stocks requires a comprehensive research: you should carefully study all the available data, e.g. company's financials, related news, and its technical analysis. So ENGIE S.A. technincal analysis shows the strong buy rating today, and its 1 week rating is strong buy. Since market conditions are prone to changes, it's worth looking a bit further into the future — according to the 1 month rating ENGIE S.A. stock shows the buy signal. See more of ENGIE S.A. technicals for a more comprehensive analysis.
If you're still not sure, try looking for inspiration in our curated watchlists.