VIRTUAL / VIRTUALUSDT Long Setup | Breaker Block ReclaimMARKET ANALYSIS
VIRTUAL is currently reacting from a key technical area highlighted on the chart.
As long as the protected support zone remains intact, the bullish market structure remains valid and higher liquidity targets may continue to attract price action.
A breakdown below the invalidation level would weaken the current bullish scenario and require a reassessment of market conditions.
📍 Entry, Stop Loss and Take Profit levels are marked directly on the chart.
━━━━━━━━━━━━━━
⚠️ DISCLAIMER
This publication is provided solely for educational and market observation purposes.
Nothing contained in this analysis should be considered financial advice, investment advice, or a recommendation to buy or sell any financial instrument.
All trading and investment decisions remain solely the responsibility of the individual trader.
Always conduct your own research and apply proper risk management before entering any position.
━━━━━━━━━━━━━━
🎯 PARALOG
▪️Crypto Market Analysis
▪️BTC Futures Signals
▪️Bitcoin & Altcoin Market Analysis
Precision • Momentum • Timing
━━━━━━━━━━━━━━
Exchange: #MEXC Futures
#bitcoin #btc #crypto #futures #technicalanalysis
In-depth trading ideas
VIRTUAL: local squeeze with $0.7513 destinationThe Macro Picture 🗺️
VIRTUAL unwound from the $0.9823 macro ceiling into a summer base and has reclaimed $0.6016, holding above the $0.5194 local low. Price is coiling in the middle of the range with higher lows behind it — a base rebuilding, not a breakdown.
The Setup ⚙️
The Range Floor 🟢
$0.5194 (Local Low) is the demand shelf, with $0.4966 (Macro Support) as the deeper backstop just below. Both have held through July, and that's the base this range pivots on.
The Decision Point 🔴
$0.7960 (Local High) is the gate. Before it, the $0.7513 measured-move target is the first objective — reclaiming it proves buyers are stepping back in.
The Roadmap 🛣️
Hold above $0.5194 → push $0.7513 → break $0.7960. Invalidation is a clean daily close below $0.4966 — that breaks the range.
This is a GRID Range Play: a defined band to rotate, buying the lower half and scaling out into the breakout.
#VIRTUAL #crypto #trading #TA #3Commas #GRID
Lagging Span and Trendline InteractionOne important point about the Lagging Span (Chikou Span) is that it does not only interact with ichimoku component... It can also react to trendlines.
In this example, the idea is simple:
Take the low of the candle with the green circle
Project that low 26 periods back (line 1)
When you do that, it correspond to the orange circle.
the bottom of the vertical line 2 was precisely were the lagging span (Ls) was at the low of his relative candle (green circle)
At that exact location, we can see that the Lagging Span rebounds precisely on the trendline.
This is a very interesting reminder that Lagging Span analysis is not limited to standard Ichimoku components only. A well-drawn trendline, when projected into the Lagging span environment, can also become a meaningful interaction level.
Why this matters
In this example, price had already closed below the trendline (the candle with green circle closed below the trendline). If we only looked at the current price action, we could have expected a bearish continuation.
However, the Lagging Span was telling us something more subtle: 26 periods back, it was testing the same structural trendline and reacting from it.
This does not automatically mean that the market must reverse. But it shows that the breakdown was happening while the Lagging Span was interacting with a potential support structure. Ignoring that information could lead to reading the chart as more bearish than it actually was.
When analyzing the Lagging Span, many traders only check whether it is interacting with:
past price, cloud, Tenkan-sen and Kijun-sen... But market structure itself also matters.
Takeaway
The Lagging Span is not only a confirmation tool.
It is also a way to detect hidden interactions with past structure — including trendlines.
So when studying Lagging Span, don’t just ask:
“Is it above or below price / Kumo / Kijun / Tenkan?”
Also ask:
“Is it reacting to a structural level such as a trendline?”
That extra layer of observation can reveal very clean and precise reactions.
$VIRTUAL Holding HTF Demand While Trendline Support Remains IntaVIRTUAL Holding HTF Demand While Trendline Support Remains Intact 👀
VIRTUAL continues consolidating around a major higher-timeframe demand zone after failing to sustain the recent expansion move. Despite short-term volatility, buyers have repeatedly defended the 0.69–0.70 region, keeping price above a rising HTF trendline that has supported structure for months. Current conditions still look more like accumulation than confirmed bearish continuation.
The most important area remains the 0.69–0.70 discount zone, where historical demand, liquidity, and trendline support converge. As long as this region holds, the broader structure continues producing higher lows, which keeps the possibility of a larger recovery move alive. However, bullish continuation is not confirmed yet.
Momentum remains neutral while RSI continues hovering near the mid-range. From a SAFE MODEL perspective, the ideal scenario remains a liquidity sweep, strong reclaim, bullish displacement, and confirmation before targeting higher liquidity around 0.86 and potentially 1.03 over time.
Analysis by Leo524.
#VIRTUAL #VIRTUALUSDT #Crypto #Altcoins #Trading #PriceAction #Leo524
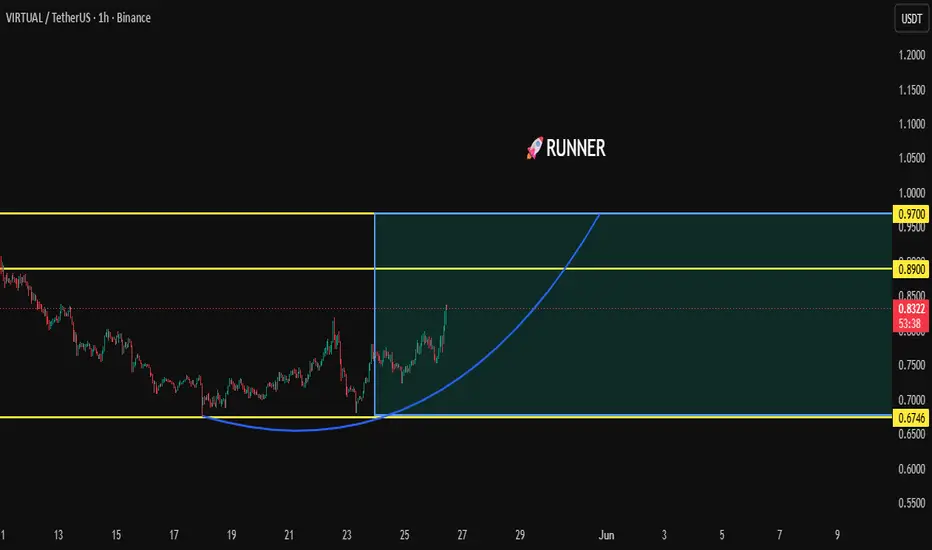
VIRTUAL/USDT – Update ON WAY TO NEW HIGH📊 VIRTUAL/USDT – Update
VIRTUAL is showing strong recovery momentum after defending the key support zone and building a solid higher-low structure. The recent price action suggests buyers are regaining control, increasing the probability of a continuation move if momentum keeps building.
🎯 TP 1: 0.8900
🎯 TP 2: 0.9700
🚀 TP 3: Runner target open — allowing the trend to capture maximum upside potential.
👉 As long as price remains above the support zone, the bullish scenario stays active.
This is our trading expectation and not financial advice everything depends on confirmed trend continuation.
VIRTUALUSDT | Downtrend Compression → Breakout BaseVIRTUALUSDT | Downtrend Compression → Breakout Base → Parabolic Expansion Setup 🚀
VIRTUALUSDT has spent a prolonged period under bearish pressure, forming consistent lower highs within a descending structure. However, recent price action shows clear signs of trend exhaustion and a shift into accumulation near the base.
━━━━━━━━━━━━━━━
📊 Market Structure Breakdown
• Extended downtrend with descending resistance respected
• Gradual compression near lows → reduced volatility
• Formation of a tight base → accumulation phase
• Early breakout signals emerging from structure
This indicates:
→ Seller exhaustion
→ Liquidity absorption at lower levels
→ Transition toward expansion phase
━━━━━━━━━━━━━━━
💡 Key Levels & Targets
🔹 Accumulation Base: ~0.80
→ Critical support / breakout origin
🎯 Target 1: ~1.51
→ Initial breakout confirmation
🎯 Target 2: ~2.79
→ Mid-range liquidity zone
🎯 Target 3: ~4.35
→ Major resistance
🎯 Extreme Target: ~9.08
→ Full expansion / high liquidity zone
━━━━━━━━━━━━━━━
🚀 Projected Scenario
The projected move reflects a classic accumulation-to-expansion cycle:
1. Breakout from base structure
2. Gradual build-up toward early targets
3. Acceleration through mid-range liquidity
4. Potential parabolic expansion into higher resistance zones
This setup represents a high R:R reversal opportunity .
━━━━━━━━━━━━━━━
⚠️ Invalidation
• Breakdown below accumulation base (~0.80)
• Failure to sustain breakout momentum
• Continued sideways compression
This would delay or invalidate the bullish scenario.
━━━━━━━━━━━━━━━
🧠 Key Insight
Markets that compress for extended periods after a downtrend often lead to explosive expansion moves once liquidity is triggered.
Compression → Expansion is the core dynamic here.
━━━━━━━━━━━━━━━
📌 Conclusion
VIRTUALUSDT is approaching a critical breakout phase .
A confirmed move above structure could initiate a multi-stage expansion toward higher liquidity levels .
Watch the breakout — this is where momentum shifts aggressively.
VIRTUAL LONG — ALMA Avg Strategy | SCORE 14ALMA board (~0.6832)
15m through 1D: SHORT on the tile. 4H: Cur Short 7 vs Avg Short ~3.4 — diff ~3.6 bars (~2.1× average short run, above default 1.0 min diff unless inputs are tightened). 3D LONG with Cur Long 5; 1W LONG with Cur Long 1 — slow grid long while intraday through daily stay short. Same “young weekly long + stretched 4H short” fork as other ALMA long notes.
EMA / session grid
6/6 Below on the strip. 1H Cur Short 24 vs Avg Short ~8.5 — heavy micro short crowding. 3D Cur Short 12 vs Avg ~14.2; 1W Cur Short 23 vs Avg ~51 — weekly series still long in bars but price sits far under the slow EMA. 1W Dev% ~50 below — macro rubber-band skew; 1D Dev% ~0 — local reset to the daily mean in the same export. 4H Cur Short 3 vs snapshot ALMA 4H S=7: ALMA tile is the strategy clock for phase length.
SMC — current and recent
4H (~0.6851, 19.04 04:00): post-wick context after the vertical pop — bid clusters ~0.68–0.72 vs overhead ~0.79–0.80 supply; CHoCH / trend-down language on the strip around ~0.7055 in the capture set, then absorption back into the range.
1D (~0.7028, 18.04): raid / enter bull cluster at the print — liquidity ping-pong; air pocket ~0.795–0.826 and deeper ladder higher; invalidation if ~0.56–0.64 volume-anchor floor fails on sustained acceptance.
1W (~0.6429, 06.04): macro consolidation after historical extremes — trade is tactical long inside HTF range until weekly structure upgrades.
Trend — 1D (squeeze)
Forecast: apex compression between descending resistance (~0.72–0.75 pocket) and ascending fan support (~0.60–0.63) — breakout acceptance above the lower red rail opens path toward ~0.91 horizontal; lose the fan and the squeeze thesis flips to liquidity hunt lower.
Trend — 1W (macro)
Anomaly: multi-quarter triangle vertex — volatility has nowhere to hide. Base case while macro green support holds: mean-reversion toward ~0.75–0.91 and outer rails; sustained weekly failure through ~0.56–0.60 cluster re-opens deeper PL ladder.
Derivatives — skew
Accounts skew short (~56% short vs ~44% long; long/short ratio ~0.79) while leviathan net reads heavily long — retail fade vs size bid. CVD negative with funding near flat — absorption read, not a clean impulse; forecast: squeeze needs aggressive buy delta; else range churn continues.
Social — hype reset
Dominance and post/interaction flow collapsed from the March spike while sentiment stays ~86% — tourists left, bulls stayed; Galaxy mid-40s — social overheat cleared, not the same as price safety.
On-chain (sparse panes)
Addresses off the Q1 spike; USD volume still prints pulses on a quiet base — small float, chunky prints; many TVL/whale panes N/A — do not invent fundamentals.
Backtest honesty (ALMA Avg on attached VIRTUAL panel, Nov 2024 – Apr 2026)
About +56% total P&L with profit factor ~1.11 on 409 trades — thin edge, high churn. Win rate ~58% but max equity drawdown ~60% — path risk dominates. Avg win ~14.4% vs avg loss ~−8.2% — winners carry expectancy; dollar ratio avg win/avg loss ~0.81 — still frequency-dependent. Average run-up phase ~31d vs drawdown ~43d — underwater longer than upside bursts. Max intrabar run-up ~168% vs max intrabar drawdown ~149% of initial in the report — variance monster; return of max drawdown ~0.38 — recovery efficiency is mediocre.
Bull case
4H ALMA short run ~2.1× average; 1H EMA short crowding; 3D ALMA long with L=5; post-blow-off reset into ~0.68 bid + SMC absorption language; retail-short / whale-long skew.
Bear case
Weekly Dev ~50% Below — macro stretch can cap rips into overhead ~0.79–0.80; PF ~1.1 and DD ~60% — wrong regime eats pyramids; one bad streak can mirror the Aug–Feb equity sink in the curve.
$VIRTUAL approaching a very important zone!BINANCE:VIRTUALUSDT is hitting a Strong Resistance zone ($1.05 – $1.15) that has capped multiple recovery attempts since early 2025. While the recent Coinbase listing and Base robotics cohort expansion provided a boost, the price is now struggling against a multi-year descending trendline.
BINANCE:VIRTUALUSDT is testing the major $1.05–$1.15 resistance zone while struggling below a long-term descending trendline.
Recent Coinbase and Base robotics news boosted price, but momentum is fading as volume slows near $73M. A daily close below $0.81 could invalidate the recent breakout attempt and trigger a deeper pullback. Only 65% of supply is circulating, leaving significant overhead pressure, while funding and AI narrative momentum continue cooling across the market.
VIRTUAL – Correction Before New Highs?VIRTUAL is currently approaching two major resistance factors:
the upper bound of its rising channel and the psychological $1 round number 🔵
With price stretching into resistance, a correction or pullback is expected in the short term 📉
However, as long as the overall bullish structure remains intact, any retracement toward the lower bound of the channel and the red support structure will be viewed as an opportunity to look for new longs 📈
The bigger picture remains bullish.
Corrections are healthy inside trends.
Will buyers step in for another breakout attempt? 🤔
⚠️ Disclaimer: This is not financial advice. Always do your own research and manage risk properly.
📚 Stick to your trading plan regarding entries, risk, and management.
Good luck! 🍀
All Strategies Are Good; If Managed Properly!
~Richard Nasr
VIRTUALUSDT — Descending Triangle Before a Major Breakout?The VIRTUAL/USDT (1D) chart is currently in a tight consolidation phase after a prolonged downtrend. Price is forming consistent lower highs, being compressed by a descending trendline (yellow line), while a strong support zone holds around 0.62 – 0.65.
This structure forms a classic pattern:
---
📐 Pattern: Descending Triangle (Reversal / Continuation Potential)
Key characteristics:
Descending resistance (lower highs) → sellers still dominate
Strong horizontal support → buyers defending demand zone
Narrowing range → signals an upcoming major breakout
📌 Price is now near the apex, meaning a breakout is likely imminent.
---
🔵 Bullish Scenario
If price manages to:
Break and close above the descending trendline (~0.70 – 0.75)
Supported by increasing volume
Potential upside targets:
0.80 (initial resistance)
0.855
0.90 (major resistance)
🎯 A confirmed breakout could trigger a trend reversal after the extended downtrend.
---
🔴 Bearish Scenario
If price fails to hold:
Breaks below the 0.62 support zone
Potential downside targets:
0.58
0.52
Possible retest of previous low around 0.45
⚠️ A breakdown would confirm this pattern as a bearish continuation.
---
📌 Key Levels
Main Support: 0.62 – 0.65 (strong demand zone)
Dynamic Resistance: descending trendline
Horizontal Resistances: 0.72 / 0.80 / 0.855 / 0.90
---
⚠️ Important Notes
Price is in a compression (squeeze) phase → often followed by an explosive move
Wait for breakout confirmation + volume before entering
Avoid entries in the middle of the range (high risk / low reward)
---
🧩 Conclusion
VIRTUAL is at a critical point. The Descending Triangle pattern is nearing completion, and the breakout direction will determine the next major trend.
#VIRTUALUSDT #CryptoAnalysis #TechnicalAnalysis #DescendingTriangle #BreakoutSetup #CryptoTrading #Altcoins #BullishScenario #BearishScenario #PriceAction #CryptoSignals
VIRTUALUSDT 1D#VIRTUAL is testing the descending resistance along with the daily SMA50 and the Ichimoku Cloud on the daily chart. In case of a confirmed breakout above these levels, the potential upside targets are:
🎯 $0.7416
🎯 $0.8288
🎯 $0.9161
🎯 $1.0402
🎯 $1.1984
⚠️ Always remember to use a tight stop-loss and maintain proper risk management.
VIRTUAL LONG — ALMA Averaging | Score 20.1 | ALMA Add ActiveALMA Long Add fired on the 4H candle. Entry zone ~$0.632–$0.640.
Trump's Iran speech overnight. VIRTUAL went from ~$0.74 to sub-$0.635 — a sharp flush into the MS Downsweep at $0.6326 (April 2, 12:00). The ALMA averaging strategy added. Score is moderate. The interesting part is elsewhere.
---
Score breakdown (20.1 total):
ALMA Overheat: 7.2 — the main driver.
- 4H: Cur S=7, Avg S=5.0 → 1.4× overheat on the strategy timeframe. Entry condition met: diff=2 ≥ 1.
The entry condition is confirmed on the strategy TF (4H).
Deviation: 5.1 — 1D: 2.5, 3D: 2.5.
Both 1D and 3D EMAs are above current price, each contributing equally to the deviation score. Per MTF EMA table — see chart.
1st Bar Close: 2.5 — 1H confirmed below EMA (entry bar support).
Series: −0.5 — mixed. 1D and 4H have residual LONG series components. The setup is not textbook clean on the series dimension.
---
The microstructure case — this is the interesting part:
Funding Rate: −0.075%
Negative funding means shorts are paying longs. At this price level. VIRTUAL is at $0.63, down 80%+ from its highs, and the funding is still negative. That means the crowd is actively maintaining short exposure on the way down — which is exactly the setup that precedes sharp short squeezes.
Long/Short Ratio Accounts: 0.46
68.89% of accounts are short. 31.5% long. The crowd is unanimously positioned for more downside.
Summary: crowd is short, paying for it. This is a setup where shorts are overstaying their welcome.
---
SMC Class C: 0.8 — weak SMC confirmation.
SMC / FVG (4H):
Most recent events (April 2):
- MS Downsweep: $0.6326 (12:00) — structure swept the recent lows. Classic liquidation event.
- FVG Enter Bull: $0.6326, $0.6295, $0.6359 — multiple fresh bull FVGs established at current lows
- OB Enter Normal Bear: $0.6359 — bears defending just above
SMC (1D):
- MS Downsweep: $0.6451 (March 29) — prior 1D sweep
- FVG New Bear: $0.6558 (March 28) — active bearish FVG overhead
- FVG Bull: $0.6424 (March 30), $0.6451 (March 29) — support cluster
SMC (1W):
- MS Trend Up established at $1.4619 (Nov 25, 2024) — weekly bull trend technically intact from that anchor
- MS Downsweep: $0.7883 (Oct 6, 2025) — structural sweep happened at the highs
- Current price at $0.63 sits on the $0.6331 weekly labeled support level
- Falling Wedge forming on the weekly chart — pattern targets upper channel at ~$0.88–$0.91
---
Strategy mechanics (ALMA Avg, Long Only, 4H):
Entry condition: each 4H bar where ALMA signal = SHORT and Cur S − Avg S ≥ 1. Currently: Cur S=7, Avg S=5.0 → diff=2. Condition met.
Position sizing: 25% equity per bar. Pyramiding enabled.
Exit condition: ALMA flips to LONG and LONG series overheats (Cur L / Avg L ≥ threshold on 4H).
Hard stop: 10% from average entry. Entry ~$0.635: Hard SL ≈ $0.572.
Backtest (Nov 1, 2024 – Apr 2, 2026):
- WR: 57.92% (234/404 trades)
- Profit Factor: 1.108 . This strategy barely wins on VIRTUAL.
- Avg profit: +14.47%, Avg loss: −8.30%
Transparent disclaimer: PF 1.108 means this strategy on VIRTUAL is borderline. The edge comes from infrequent large wins (+12%, +7%) against more frequent moderate losses. The current setup has a weaker score than the strategy's best entries (which reached 80–90+ Long Score).
VIRTUALUSDT UPDATESPARKS:VIRTUAL Technical Setup Pattern: Symmetrical Triangle Breakout Current Price: $0.6889 Target Price: $1.2000, $1.3000 Target % Gain: 75.91% VIRTUAL is compressing within a symmetrical triangle on the 1D chart and attempting a breakout above the descending resistance with steady price structure, signaling a potential bullish continuation if volume confirms the move Time Frame: 1D Risk Management Tip: Always Use proper risk management
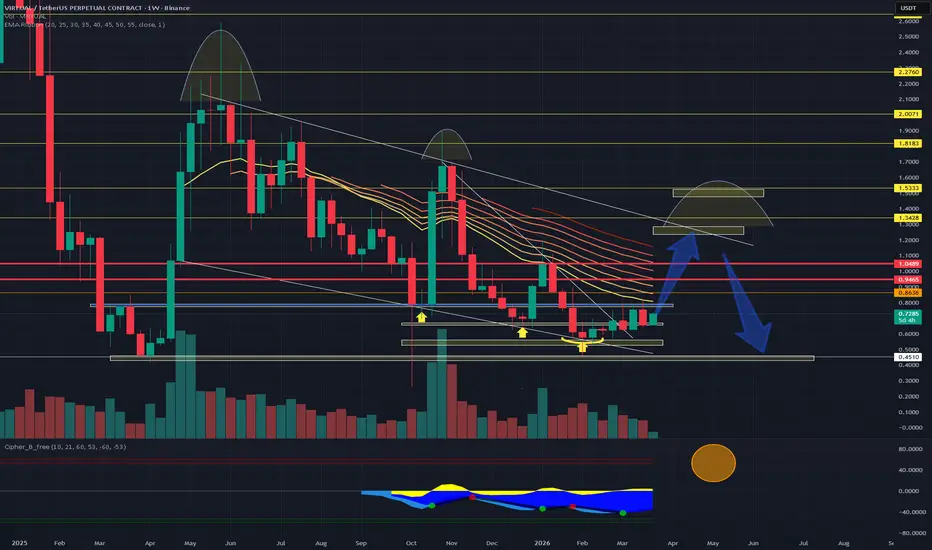
VIRTUAL/USDT (1W) - LongThe VIRTUAL/USDT pair is currently confined within a massive Falling Wedge structure that has governed price action since Q2 2025. This 12-month consolidation is reaching its "apex," suggesting a violent volatility expansion is imminent as we move toward the May/June window.
Let me breakdown my thoughts process, as well as the reasoning for this trading idea.
Current Setup & Momentum:
- EMA Ribbon Test : Price is currently hugging the Weekly EMA Ribbon. This serves as the primary "gatekeeper" for bullish momentum. A weekly close above this ribbon would signal the first major trend shift in nearly a year.
- Cipher B Overbought Target : On the 1W timeframe, we are tracking the Cipher B momentum waves. I anticipate a push toward "overbought" conditions (the upper green/red threshold) to coincide with the wedge's upper resistance line.
- The "Liquidity Sweep" (Fake-out): High-volatility AI assets often exhibit a "fake-out" before a true breakout. My thesis includes a potential push to $1.05, followed by a quick retest of the wedge's upper boundary ($0.80-$0.85) to trap early breakout buyers before the final leg toward $1.40–$1.50.
Strategic Rationale:
With VIRTUAL's market cap currently stabilized around $450M the fundamental floor is rising. We are betting on a "rotation" from the ongoing Bittensor (TAO) rally into the high-beta Agentic ecosystem.
You can also study my Bittensor TSXV:TAO setup to understand the reasoning behind the beta play strategy.
Entry: $0.65 – $0.72 (Accumulation Zone)
TP 1: $1.30 (Previous Resistance)
TP 2: $1.45 (Psychological Level)
TP 3: $1.53 (Target for May/June Expansion)
nfa and good luck.
By Ernst Journal
VIRTUAL Ascending Channel in Downtrend – Bearish ContinuationVIRTUAL is forming an ascending channel inside a larger descending channel, indicating a corrective move rather than a true trend reversal.
The upward structure shows controlled relief, but price remains below the higher timeframe resistance and overall bearish trendline. This suggests buyers are weak and the move is likely just a pullback within a downtrend.
If price loses the lower boundary of the ascending channel, it could trigger a continuation move toward the lower range of the main channel.
As long as the higher timeframe structure holds, this setup favors downside. The trend is still in control.
$VIRTUALUSDT looking interesting on the 1HPrice has pulled back cleanly into a solid demand zone around $0.6827 – $0.6743, which previously acted as support. This kind of reaction area is where you typically see buyers step back in.
Right now, price is sitting around $0.6833, so this is basically a decision zone. If this level holds, we could see a bounce toward $0.7096 first, and if momentum builds, a push toward $0.7433 isn’t off the table.
Invalidation is clear - if price loses $0.6683, the setup breaks and downside opens up.
What I like here is the structure - we’ve got a pullback into support after a move up, not just random chop. If buyers show up, this could turn into a nice short-term relief rally.
I’m watching for confirmation before going heavy, but definitely a level worth keeping on the radar.
$VIRTUAL: AI Coins BreakoutMarket Update & Narrative
The "Agentic Economy" is no longer a future concept—it’s happening now on Base. Virtuals Protocol ( SPARKS:VIRTUAL ) has established itself as the premier infrastructure for tokenized, revenue-generating AI entities. While the broader market has seen a pre-FOMC cooldown, SPARKS:VIRTUAL is displaying a remarkably resilient technical structure that suggests the next leg of the AI supercycle is imminent.
Technical Analysis (Referencing Chart: h7PaOAMb/)
The provided chart highlights a clean consolidation pattern following a massive foundational rally.
Support Defense: Price is currently respecting a high-timeframe support zone between $0.72 – $0.75. This region has seen consistent absorption by bulls, creating a "higher low" structure that is essential for trend continuation.
Moving Average Alignment: On the daily timeframe, SPARKS:VIRTUAL remains positioned above key EMA clusters. The 200-day MA is beginning to slope upward, confirming a structural shift from a long-term accumulation phase to a trending phase.
The Breakout Trigger: We are eyeing a decisive close above the $0.83 resistance. A breakout here, supported by an uptick in volume, clears the path for a retest of the psychological $1.00 level and potentially a "price discovery" run toward previous highs.
Fundamental Tailwinds
Monetary Backbone: Unlike speculative "AI coins," SPARKS:VIRTUAL is the literal currency of its ecosystem. Every AI agent launched (IAO) requires SPARKS:VIRTUAL for liquidity pairing and inference payments, creating a continuous "buy-and-lock" pressure.
Scarcity by Design: With a fixed supply of 1 billion tokens and no future inflation, SPARKS:VIRTUAL is a rare deflationary-style bet in a sector often plagued by high FDV and aggressive unlocks.
Expansion to Robotics: Recent developments moving AI agents into physical robotics domains expand the addressable Agentic GDP (aGDP), positioning SPARKS:VIRTUAL as a multi-trillion dollar infrastructure play.
The Trade Idea
Accumulation Zone: $0.74 - $0.78 (Current levels offer a high R/R entry).
Target 1: $1.00 (Psychological Resistance).
Target 2: $1.60 (Macro Fibonacci Extension).
Stop Loss: A daily close below $0.68 invalidates the immediate bullish structure.
Conclusion
SPARKS:VIRTUAL is currently the "coiled spring" of the Base ecosystem. As liquidity rotates back into AI and high-beta assets post-macro volatility, SPARKS:VIRTUAL is the primary candidate to lead the pack.
#VIRTUAL #AI #Base #CryptoAnalysis #Bullish
Disclaimer: Not financial advice. Always do your own research before investing in volatile digital assets.
VIRTUALUSDT: next move or faking out? key levels to watchVIRTUALUSDT – ready for the next move or just faking it? Lately this micro-cap has been catching some speculative flows as traders rotate into smaller AI/metaverse names again, and according to the market there’s fresh interest around these “virtual” narratives. Today price is parked right under a chunky 4H supply band after getting bought up from the mid-range demand, so the next few candles should tell us who’s really in charge.
On the 4H chart, price keeps rejecting the upper red zone while RSI cools off from near overbought, so I’m leaning toward a short-term pullback rather than an instant moonshot. Volume by price is heavy around the current level, meaning lots of positions are trapped here and any break below local intraday support could trigger a quick flush toward the green demand around 0.70. I might be wrong, but chasing longs right into resistance usually ends like buying the top of a pump tweet.
My base plan: look for a dip into that 0.70 demand area and a clear bounce with rising volume – that’s where I’d like to build a long, targeting a retest of the red zone above and potentially the higher supply closer to 0.78 if momentum returns. ✅ If price instead breaks and holds below the lower green zone, I flip the bias and expect a deeper slide to the next major demand below, staying flat until a new base forms. For now I’m patiently waiting for either the liquidity grab down or a clean breakout above resistance before committing.
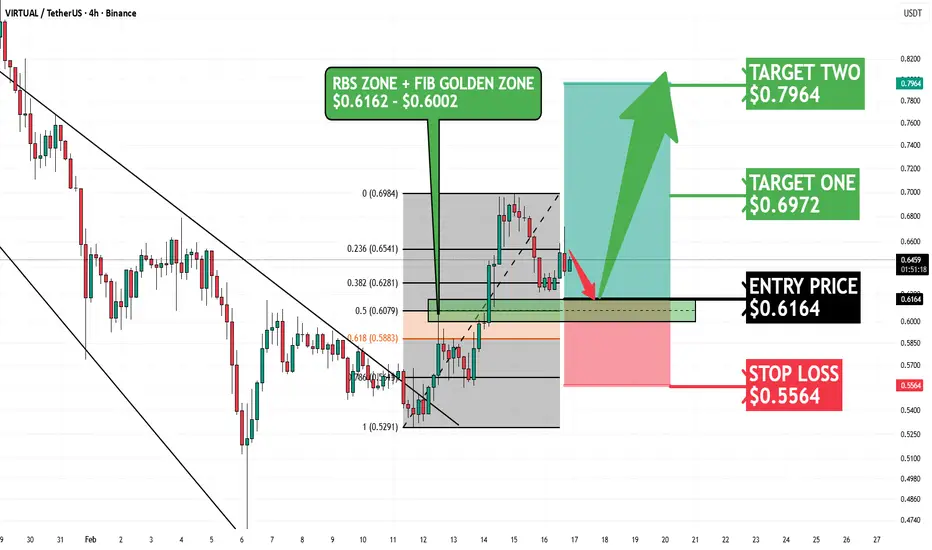
$VIRTUAL/USDT Chart Analysis (4H Timeframe)📈 Market Structure: Bullish reversal → pullback continuation setup
BINANCE:VIRTUALUSDT shows a strong recovery from the downtrend channel with a breakout and retest of key Fibonacci and resistance-turned-support levels, suggesting potential upside continuation.
➖➖➖➖➖➖➖
🔑 Key Technical Zone
🟢 RBS Zone + Fibonacci Golden Zone: $0.6162 – $0.6002
Resistance turned support (RBS)
0.5 – 0.618 Fibonacci retracement confluence
High-probability buying area
Holding above this zone confirms bullish continuation
➖➖➖➖➖➖➖
🎯 Trade Levels (Based on Chart)
🎯 Entry Area: $0.6164 (pullback entry near golden zone)
🛑 Stop Loss: $0.5564 (below structure support)
🏹 Target 1: $0.6972 — previous resistance zone
🏹 Target 2: $0.7964 — major supply/resistance level
➖➖➖➖➖➖➖
📈 Bullish Scenario
✅ Price holds above $0.60 support → continuation toward $0.70 and $0.79.
Breakout from the descending channel signals trend reversal with higher low formation.
➖➖➖➖➖➖➖
📊 Technical Confluence
Descending channel breakout
Fibonacci golden zone support
Resistance turned support (RBS)
Higher low formation
Bullish momentum continuation structure
➖➖➖➖➖➖➖
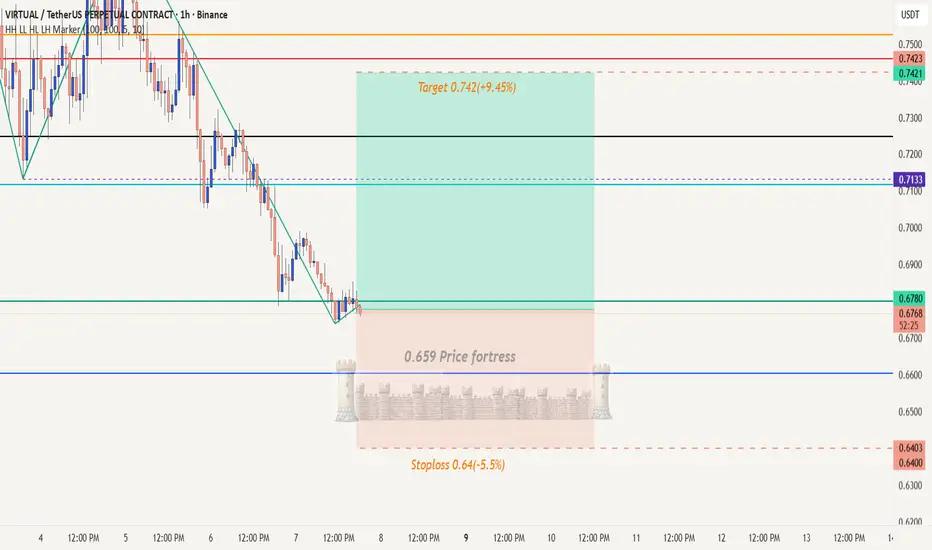
Buy time in VirtualHello Traders!
March - Trade no 2
There is a perfect buy Setup in virtual. There many bullish patterns and buy setup in Vurtual and downside is very limited. There is a strong fortress near 0.66 and it will guard the price to move down. Market can still go down towards 0.66 but we cannot wait for it as we might miss the trade.
Virtual buy now at 0.678
Stoploss 0.64(-5.5%)
Target 0.742(+9.45%)
My aim is to achieve highest win rate in Tradingview trading community :) and we will definitely do that.
Trade is analyzed with
A1000x master reversal strategy
A1000x secret S/R strategy
Candlestick pattern
A1000x Stop loss and target strategy
We are trading with most powerful methods in Market that can easily achieve unbeatable accuracy.
In Some trades you might see big stoploss or bad RR but you don't have to worry about that because we don't jump in the trade which will hit sl. We make some calculation and after that calculation we set our SL and target according to that. I use one of my Stoploss and target strategy and we make sure stoploss is at the price where market will not touch before hitting target.
VIRTUAL/USDT – Long Setup!Hey Traders!
If you’re finding value in this analysis, smash that 👍 and hit Follow for high-accuracy trade setups that actually deliver!
Symmetrical triangle breakout. Momentum building.
🟢 Entry: $0.71 – $0.73
🎯 Target 1: $0.85
🎯 Target 2: $0.98
🎯 Target 3: $1.20 – $1.25
🛑 Stop Loss: $0.67 (4H close below support)
Recommended:
✔️ Spot accumulation
✔️ Low leverage only (2x–3x max)
✔️ Trail SL after T1 hit
Risk management is key. Don’t overleverage.
What’s your view on this?
Share your thoughts in the comments below 👇