Wheat could be the next Big Move - here's why...Most beginners watch only Bitcoin, gold, or stocks. But sometimes the biggest opportunities appear where almost nobody is looking.
A simple event can move an entire market. And right now, wheat is one of the commodities worth watching.
Ukraine and Russia together account for a 33% share of global
Quick update on our WEAT EFT long!AMEX:WEAT This is the EFT were using to go long this chart. So far nothing much has changed were looking good so far but there is signs that the shorts are starting to get aggressive. I am looking for one more move up to pay us out, as there is still bullish signals that we have one more push up to
Update on our wheat trade! still bulish!Folks i still like this trade on the long side of things. What i really like about it is that it is respecting market structure and showing bullish price action in the short term. Retraces are healthy for the markets to have longer and stronger moves to the upside as its preparing and building mome
Wheat on Rise | Groceries UpHi
Disclaimer: This analysis is for sharing purposes only and does not constitute financial advice. Always manage risk appropriately.
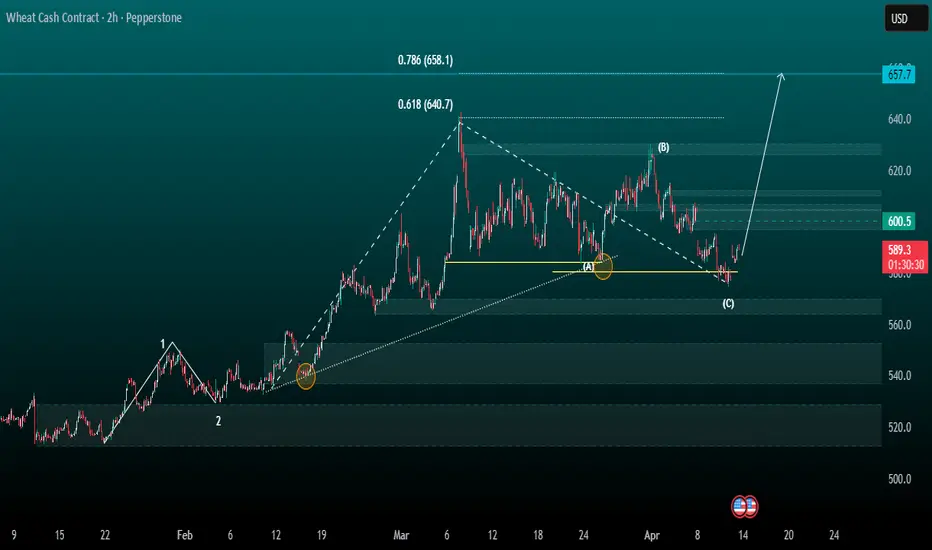
Wheat (CFD) – H2 Structural Outlook:
Wheat is currently presenting a **bullish structure on the H2 timeframe**, with upside bias maintained while price holds above
Long Wheat FuturesWheat futures have broken above moving averages and current consolidating before a move higher. Technical indicators dovetail with fundamental macro thesis of higher oil prices putting upward pressure on the entire commodities complex.
For wheat in particular, higher oil prices may put upward press
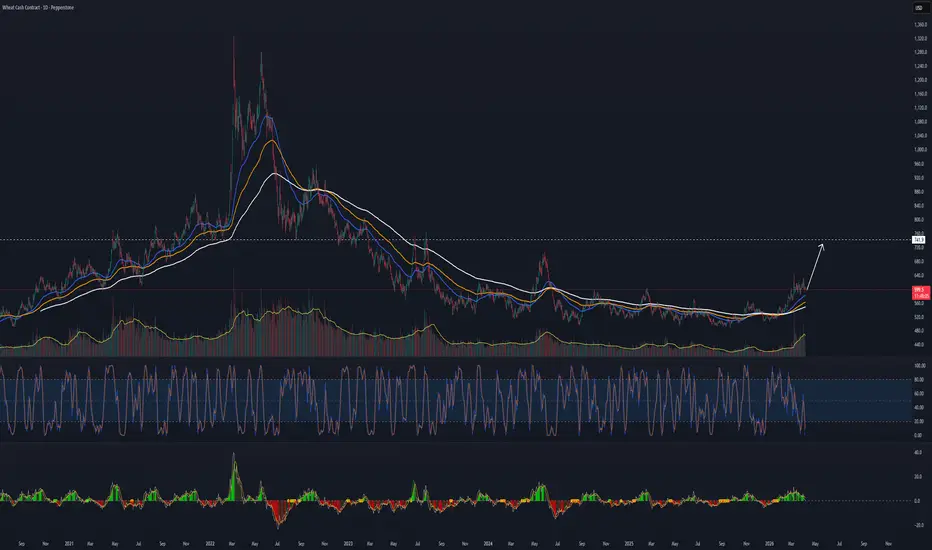
Wheat Preparing for a New Trend CycleHello and welcome to all TradingView followers 👋📊
In this analysis, we review the WHEAT chart on the Daily timeframe.
The overall structure shows that after a long-term downtrend, the market has gradually lost bearish momentum and transitioned into a consolidation (range) phase. This behavior usual
WHEAT — Watching This Area CloselyWheat is pushing into a bearish WCL , and what’s interesting is that a bullish ABC (red) already hit its C right inside this zone .
Usually, that’s where things slow down.
At least a pause. A wick. Something.
Instead, price just kept going.
No real rejection.
No obvious momentum loss.
No bearis
See all ideas
Displays a symbol's price movements over previous years to identify recurring trends.