Wheat could be the next Big Move - here's why...Most beginners watch only Bitcoin, gold, or stocks. But sometimes the biggest opportunities appear where almost nobody is looking.
A simple event can move an entire market. And right now, wheat is one of the commodities worth watching.
Ukraine and Russia together account for a 33% share of global wheat exports.
For sunflower oil, this share is even larger: Ukraine itself occupies more than 50% of the global oil market PEPPERSTONE:WHEAT . According to UN experts, the war in Ukraine, started by Russia, could lead to global food shortages and even famine in some countries.
The main reason is that Ukraine and Russia hold a significant share of the sunflower oil and wheat markets, as well as other grains such as corn, barley, and so on. The UN estimates that approximately 40 million people worldwide could fall into extreme poverty due to the inability to deliver Ukrainian and Russian sunflower oil and wheat to other countries.
When supply from such major producers is threatened, prices can react quickly.
The war has already disrupted farming and exports in parts of the region. In Russia, reports of fuel shortages in some areas have also raised concerns about agricultural operations during the harvest season. If farmers face difficulties harvesting or transporting crops, less wheat could reach global markets, tightening supply and putting upward pressure on prices.
This doesn't automatically mean wheat prices will rise. Weather conditions, government policies, global demand, and harvests in other countries can all influence the final outcome.
But this is exactly how many investment ideas begin—not by looking at a chart, but by understanding how real-world events affect supply and demand.
The idea is simple:
🌾 Major producers face disruptions.
📉 Global supply may become tighter.
📈 If demand stays stable, prices often move higher.
Smart investors don't just follow candles—they follow the events that create them.
Keep an eye on wheat. Sometimes the next opportunity starts in the real world, long before it appears on the chart.
On my channel, you'll find many educational posts that will help you improve your trading results.
In-depth trading ideas
Quick update on our WEAT EFT long!AMEX:WEAT This is the EFT were using to go long this chart. So far nothing much has changed were looking good so far but there is signs that the shorts are starting to get aggressive. I am looking for one more move up to pay us out, as there is still bullish signals that we have one more push up to our first price target! More details in the video. I wanted to show some love on this chart but believe me I am watching it!
Update on our wheat trade! still bulish!Folks i still like this trade on the long side of things. What i really like about it is that it is respecting market structure and showing bullish price action in the short term. Retraces are healthy for the markets to have longer and stronger moves to the upside as its preparing and building momentum.
Wheat on Rise | Groceries UpHi
Disclaimer: This analysis is for sharing purposes only and does not constitute financial advice. Always manage risk appropriately.
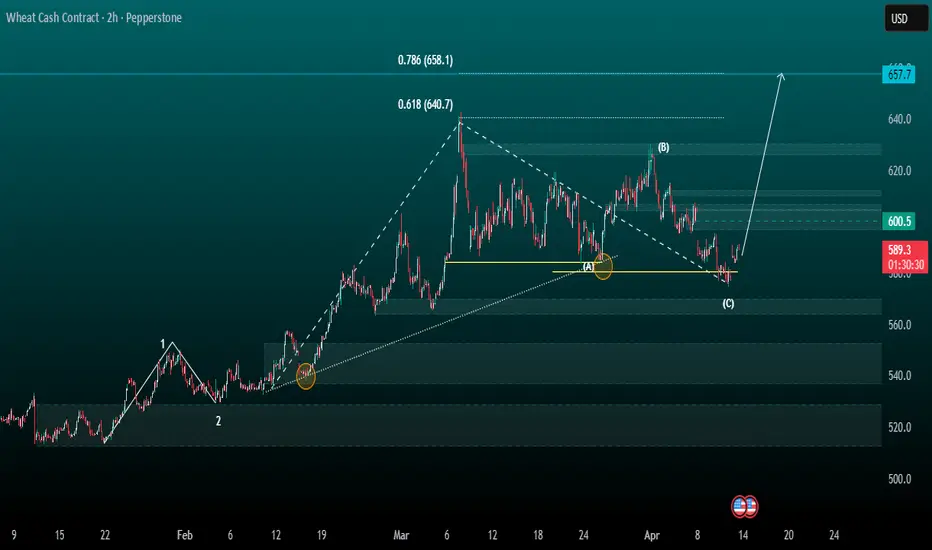
Wheat (CFD) – H2 Structural Outlook:
Wheat is currently presenting a **bullish structure on the H2 timeframe**, with upside bias maintained while price holds above the **580 level**, which acts as the **structural base**.
Ahead, price is approaching a **resistance zone between 600.5 and 612.8**, which represents a key pressure area where bullish momentum may slow or react.
Despite this overhead resistance, the broader bias remains **bullish toward 657.7**, provided that **underlying support remains intact**.
The **540 level** is a **deeper structural support zone**, reinforcing the broader bullish framework.
Structure & Level Roles:
* **580** → Primary structural support (bias holder)
* **600.5 – 612.8** → Resistance / pressure zone!
* **540** → Secondary (deep) support / structural reinforcement
* **657.7** → Primary upside target
Execution Considerations:
* Maintain bullish bias while above **580**
* Monitor **600.5–612.8** for resistance reaction!
* Treat rejection at resistance as corrective unless structure breaks
* Reassess bias if price weakens toward or below **540**
* Align continuation toward **657.7** upon confirmed strength above resistance
Bias Summary (TL;DR):
The bullish H2 structure is above 580, but there is resistance at 600.5–612.8. If support holds, the price could keep going up to 657.7.
- Notes
Resistance may slow down the continuation, but structure controls the direction. For sustained upside, confirmation above pressure zones is needed.
Khiwe
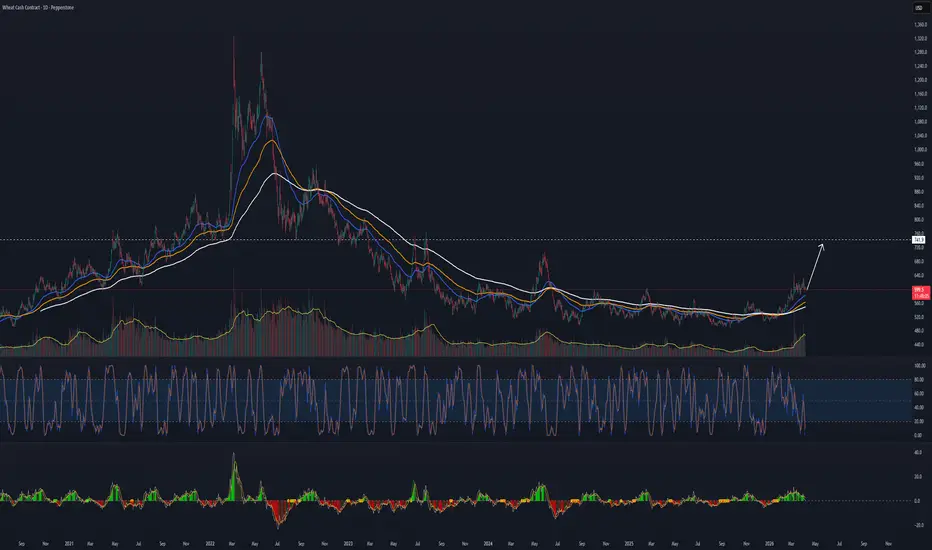
Long Wheat FuturesWheat futures have broken above moving averages and current consolidating before a move higher. Technical indicators dovetail with fundamental macro thesis of higher oil prices putting upward pressure on the entire commodities complex.
For wheat in particular, higher oil prices may put upward pressure on fertilizer, which would transiently drive upward pressure on wheat prices.
Initially targeting $741.9 on the cash contract.
Wheat Preparing for a New Trend CycleHello and welcome to all TradingView followers 👋📊
In this analysis, we review the WHEAT chart on the Daily timeframe.
The overall structure shows that after a long-term downtrend, the market has gradually lost bearish momentum and transitioned into a consolidation (range) phase. This behavior usually indicates selling pressure exhaustion and preparation for a new directional move. ⚖️
🧭 Trend Structure
Previously, the market had a clear downtrend with lower highs and lower lows. However, in recent months:
Lows are no longer breaking aggressively
The slope of the long-term decline has weakened
Price is stabilizing on a major long-term support
This suggests the market has entered an Accumulation phase 🟢
📦 Range Phase & Key Resistance
Currently, price is moving inside a sideways range and a clear resistance zone sits above the market.
Price behavior indicates buyers are gathering liquidity for a breakout.
📌 Main Scenario:
If a valid breakout with a Daily close above resistance occurs, the probability of a mid- to long-term bullish trend increases significantly 🚀
🎯 Potential Targets
After the breakout:
First move toward mid-range highs
Then continuation toward higher long-term targets
However, this will not be a straight move — the market may experience medium-term pullbacks during the bullish path 📉📈
⚠️ Alternative Scenario
If the breakout fails:
Price may return to the range lows
Continued consolidation before the final direction
Therefore, daily candle confirmation is crucial 🔍
🧠 Conclusion
The market has shifted from a downtrend into neutrality and is near a decision point.
A breakout could initiate a new bullish phase, but this setup is more suitable for long-term positioning, not short-term quick trades.
📊 What do you think?
🔘 Bullish after breakout
🔘 Continued range
🔘 Fake breakout and drop
Vote in the comments 👇
❗ Disclaimer
This analysis is for educational purposes only and is not financial advice. Always do your own research and apply proper risk management before trading.
🏷️ Tags
#WHEAT #Commodities #TechnicalAnalysis #PriceAction #Trading #SupportAndResistance #SwingTrading #LongTerm #Forex #MarketStructure
WHEAT — Watching This Area CloselyWheat is pushing into a bearish WCL , and what’s interesting is that a bullish ABC (red) already hit its C right inside this zone .
Usually, that’s where things slow down.
At least a pause. A wick. Something.
Instead, price just kept going.
No real rejection.
No obvious momentum loss.
No bearish structure shift.
That tells me sellers showed up, but they didn’t get control. Feels more like absorption than resistance right now.
As long as price holds structure up here, I’m not fighting it. The move still looks alive, and the next area I’m watching is around ~$5.50 .
If this zone suddenly rejects hard and structure flips bearish, then fine — idea’s invalid. Simple.
For now, just watching how price behaves here.
Not financial advice.
Wheat CFD Upside Setup: Tracking Momentum Toward 580📈 WHEAT COMMODITY CFD – Swing Trade Opportunity (Bullish Outlook)
🔹 Market Bias: Bullish
Wheat is showing supportive strength on higher-timeframe structure, with momentum building for the next upside leg.
🔹 Entry Zone
You may take any suitable price level entry based on your strategy, risk model, and timing confirmation.
🛡️ Risk Management (Stop Loss)
Thief SL: 540.0
Dear Ladies & Gentlemen (Thief OG’s), this is only a reference level.
Adjust your stop loss according to your personal strategy, volatility tolerance, and risk exposure.
Note: I am not recommending you use only my SL. Your money, your rules, your risk.
🎯 Profit Booking (Target)
Police barricade zone is acting as a strong resistance area with signs of overbought pressure + trap behaviour, so take profits wisely.
Our Target: 580.0
Note: I am not recommending you use only my TP. Book profits at levels that match your trading plan and risk appetite.
🔍 Correlated Markets to Watch ($ Pairs)
1️⃣ CORN CFD ( CAPITALCOM:CORN )
Often moves in tandem with Wheat due to agricultural sector correlation.
Rising Corn prices can support bullish sentiment in Wheat.
2️⃣ SOYBEAN CFD ( CAPITALCOM:SOYBEAN )
Part of the same global grain complex.
Strength in Soy can indicate broad demand for agricultural commodities.
3️⃣ US DOLLAR INDEX ( TVC:DXY )
Wheat is priced in USD.
When the dollar weakens, Wheat often gains due to cheaper pricing for global buyers.
4️⃣ CRUDE OIL CFD ( NSE:OIL )
Higher oil prices increase transportation & production costs for grains.
This can push Wheat prices upward over time.
5️⃣ NATURAL GAS CFD ( PEPPERSTONE:NATGAS )
Influences fertilizer costs globally.
Rising NatGas often tightens supply, supporting Wheat prices.
📌 Key Technical Factors Supporting Bullish Bias
Price maintaining above short-term support zone
Higher lows forming on swing structure
Buyers stepping in repeatedly at discount levels
Strong resistance at 580 acting as the next liquidity target
WHEAT: Short signal amidst Russia/Ukraine truce deadlineThe market seems to be pricing in a possible truce between Ukraine and Russia, since Trump gave Russia a 2 week deadline to achieve it or risk further sanctions. The technical chart has a picture perfect short signal in the daily timeframe with good reward to risk here.
Best of luck!
Cheers,
Ivan Labrie.
Wajani Investments: Wheat analysisWheat has formed a very strong Head and Shoulder with a bearish wedge or descending triangle . This can be seen from both monthly, weekly and daily timeframes. All these points to lower prices in the weeks ahead. In this market you can risk a 1:3
Remember to always adapt or make changes as the market changes.
Let me know your thoughts.
Wheat should go to 540 then target 610Daily chart,
The commodity WHEAT - cash contract - PEPPERSTONE:WHEAT is trading in a soft rising channel (yellow), and the price should test the line R1 at around 540 - After crossing, the target will be towards the channel upper line R2, around 610 , passing through the resistance levels 550 and 563
Stop loss below 505 to be considered.
Technical indicators:
RSI is in the 50%, with a bullish trend
MACD is about to cross up
WHEATIn April/May, wheat harvests occur in the eastern part of the globe. India has banned wheat exports since 2022 in order to replenish domestic reserves. Subsidies for farmers have meant that the sowing area is larger than usual, which translates into quite high expectations when it comes to harvests. But as is often the case in life, things are not always as we plan. Adding to this the weather in the final period before harvest, I think that the harvest will be lower than expected, which will translate into an increase in price.
WHEAT is a difficult instrument to play, but I think that the area around 680 is achievable - long shot
WHEAT at Key Support Level - Will Price Rebound to 541$?PEPPERSTONE:WHEAT has reached a major support level, an area where buyers have previously shown strong interest. This area has previously acted as a key demand zone, increasing the likelihood of a bounce if buyers step in.
A bullish confirmation, such as a strong rejection pattern, bullish engulfing candles, or long lower wicks, would strengthen the case for a move higher. If buyers step in, the price could rally toward the 541$ target. However, a decisive breakdown below this support would invalidate the bullish scenario and could lead to further downside.
This is not financial advice but rather how I approach support/resistance zones. Remember, always wait for confirmation, like a rejection candle or volume spike before jumping in.
Best of luck , TrendDiva
Global Wheat Market: Lower Production and Trade AdjustmentsAs outlined in the March WASDE report , the global wheat market is undergoing significant shifts due to production declines, lower trade volumes, and changing stock levels. These factors are expected to shape pricing and investment strategies in 2025.
Global Production and Stock Adjustments
The latest estimates indicate that global wheat production for the 2024/25 season has been revised downward to 787.3 million metric tons (MMT), reflecting lower yields in key regions such as Argentina, the EU, and Australia. The reduction in output comes amid adverse weather conditions and higher production costs, particularly in the EU, where dry conditions have impacted crop development.
Meanwhile, global ending stocks are projected to decline to 258.8 MMT, marking one of the lowest levels in recent years. The tightening of reserves may put upward pressure on prices, reinforcing wheat’s role as a key agricultural commodity in volatile market conditions.
Trade and Export Revisions
The report also projects a shift in global wheat trade. The United States is expected to see exports remain subdued at 19.2 MMT, facing strong competition from Russia and Canada. Russian wheat exports, while slightly reduced from previous estimates, still dominate the market at 49 MMT, benefiting from a weak ruble and competitive pricing.
Australia, traditionally a major wheat exporter, has also experienced downward revisions due to lower production, cutting its export forecast to 21.5 MMT. These changes underscore shifting global trade dynamics, where price-sensitive buyers increasingly turn to alternative sources for wheat supply.
Market Outlook and Price Trends
With global wheat stocks declining and exports adjusting, prices are expected to remain volatile. The tightening supply, coupled with geopolitical factors such as trade restrictions and weather risks, suggests that wheat prices could experience further fluctuations. Additionally, demand from key importing countries, including China and Egypt, will play a crucial role in shaping the price trajectory.
Investment Considerations
Wheat is still remains a critical agricultural commodity with strong fundamental drivers. The ongoing supply constraints and shifting trade flows present opportunities in futures markets, while agribusiness stocks related to wheat production and distribution could also gain traction. Those monitoring wheat ETFs or futures contracts may find potential in the market’s response to supply shocks and trade developments.
The wheat market will continue to react to production shifts, export competition, and macroeconomic trends, making it a sector worth watching closely.
WHEAT Approaching Key Support - Will Price Rebound to 550$?PEPPERSTONE:WHEAT is approaching a key support level, an area where buyers have previously shown strong interest. The recent bearish movement suggests that price may soon be testing this level, potentially setting up for a rebound.
A bullish confirmation, such as a strong rejection pattern, bullish engulfing candles, or long lower wicks, would strengthen the case for a move higher. If buyers step in, the price could rally toward the 550$ target. However, a decisive breakdown below this support would invalidate the bullish scenario and could lead to further downside.
This is not financial advice but rather how I approach support/resistance zones. Remember, always wait for confirmation, like a rejection candle or volume spike before jumping in.
Best of luck , TrendDiva
WHEAT at Key Support Zone – Bullish Bounce ExpectedPEPPERSTONE:WHEAT has approached a key support zone, marked by previous price reactions and strong buying interest. This area has previously acted as a demand zone, increasing the likelihood of a bullish bounce if buyers step in.
The current market structure suggests that if the price confirms support within this zone, we could see a reversal toward 573.0, a logical target based on prior price behavior and current structure. A clear bullish signal, such as a rejection wick or bullish engulfing candle, would strengthen this outlook.
However, if the price breaks below this support zone, the bullish scenario may be invalidated, signaling potential further downside.
Just my take on support and resistance zones—not financial advice. Always confirm your setups and trade with solid risk management.
Best of luck!
"WHEAT" Cash CFD Commodities Market Bullish Heist Plan🌟Hi! Hola! Ola! Bonjour! Hallo!🌟
Dear Money Makers & Thieves, 🤑 💰🐱👤🐱🏍
Based on 🔥Thief Trading style technical and fundamental analysis🔥, here is our master plan to heist the "WHEAT" Cash CFD Commodities Market market. Please adhere to the strategy I've outlined in the chart, which emphasizes long entry. Our aim is the high-risk Red Zone. Risky level, overbought market, consolidation, trend reversal, trap at the level where traders and bearish robbers are stronger. 🏆💸Book Profits wealthy and safe trade.💪🏆🎉
Entry 📈 : "The vault is wide open! Swipe the Bullish loot at any price - the heist is on!
however I advise placing Place Buy limit orders within a 15 or 30 minute timeframe. Entry from the most recent or closest low or high level should be in retest.
Stop Loss 🛑:
Thief SL placed at the recent / nearest low level Using the 2H timeframe (568.0) swing trade basis.
SL is based on your risk of the trade, lot size and how many multiple orders you have to take.
Target 🎯:
1st Target - 594.0 (or) Escape Before the Target
Final Target - 616.0 (or) Escape Before the Target
Scalpers, take note 👀 : only scalp on the Long side. If you have a lot of money, you can go straight away; if not, you can join swing traders and carry out the robbery plan. Use trailing SL to safeguard your money 💰.
📰🗞️Fundamental, Macro, COT, Sentimental Outlook:
🌾"WHEAT" Cash CFD Commodities Market is currently experiencing a bullish trend,., driven by several key factors.
🌿Fundamental Analysis
Supply and Demand: Global wheat production is expected to increase by 2% in 2025, driven by favorable weather conditions in major producing countries
Weather Conditions: Weather forecasts indicate a high probability of drought in key wheat-producing regions, which could impact yields and support prices
Global Economic Trends: The ongoing global economic recovery is expected to drive up demand for wheat, particularly from emerging markets
Trade Policies: The recent trade agreements between major wheat-producing countries are expected to increase global wheat trade and support prices
🌿Macro Economics
Global GDP Growth: The World Bank forecasts global GDP growth to accelerate to 3.4% in 2025, up from 3.2% in 2024
Inflation Rate: Global inflation is expected to rise to 3.8% in 2025, driven by increasing demand and supply chain disruptions
Interest Rates: Central banks are expected to maintain low interest rates in 2025, supporting commodity prices
Unemployment Rate: The global unemployment rate is expected to decline to 5.4% in 2025, driven by job growth in emerging markets.
🌿COT Data
Net Long Positions: Institutional traders have increased their net long positions in wheat to 55%
COT Ratio: The COT ratio has risen to 2.2, indicating a bullish trend
Open Interest: Open interest in wheat futures has increased by 10% over the past month, indicating growing investor interest
🌿Sentimental Outlook
Institutional Sentiment: 60% bullish, 40% bearish
Retail Sentiment: 55% bullish, 45% bearish
Market Mood: The overall market mood is bullish, with a sentiment score of +30
🌿Technical Analysis
Moving Averages: 50-period SMA: 565.0, 200-period SMA: 540.0.
Relative Strength Index (RSI): 4-hour chart: 62.21, daily chart: 58.14.
Bollinger Bands: 4-hour chart: 580.0 (upper band), 560.0 (lower band).
🌿Next Move Prediction
Bullish Move: Potential upside to 600.0-620.0.
Key Support Levels: 565.0, 540.0.
Key Resistance Levels: 600.0, 620.0.
🌿Overall Outlook
The overall outlook for wheat is bullish, driven by a combination of fundamental, technical, and sentimental factors. The expected increase in global wheat demand, favorable weather conditions, and low interest rates are all supporting the bullish trend. However, investors should remain cautious of potential downside risks, including changes in global trade policies and unexpected weather events.
⚠️Trading Alert : News Releases and Position Management 📰 🗞️ 🚫🚏
As a reminder, news releases can have a significant impact on market prices and volatility. To minimize potential losses and protect your running positions,
we recommend the following:
Avoid taking new trades during news releases
Use trailing stop-loss orders to protect your running positions and lock in profits
📌Please note that this is a general analysis and not personalized investment advice. It's essential to consider your own risk tolerance and market analysis before making any investment decisions.
📌Keep in mind that these factors can change rapidly, and it's essential to stay up-to-date with market developments and adjust your analysis accordingly.
💖Supporting our robbery plan will enable us to effortlessly make and steal money 💰💵 Tell your friends, Colleagues and family to follow, like, and share. Boost the strength of our robbery team. Every day in this market make money with ease by using the Thief Trading Style.🏆💪🤝❤️🎉🚀
I'll see you soon with another heist plan, so stay tuned 🤑🐱👤🤗🤩