WOO: local squeeze with $0.0157 destinationThe Macro Picture 🗺️
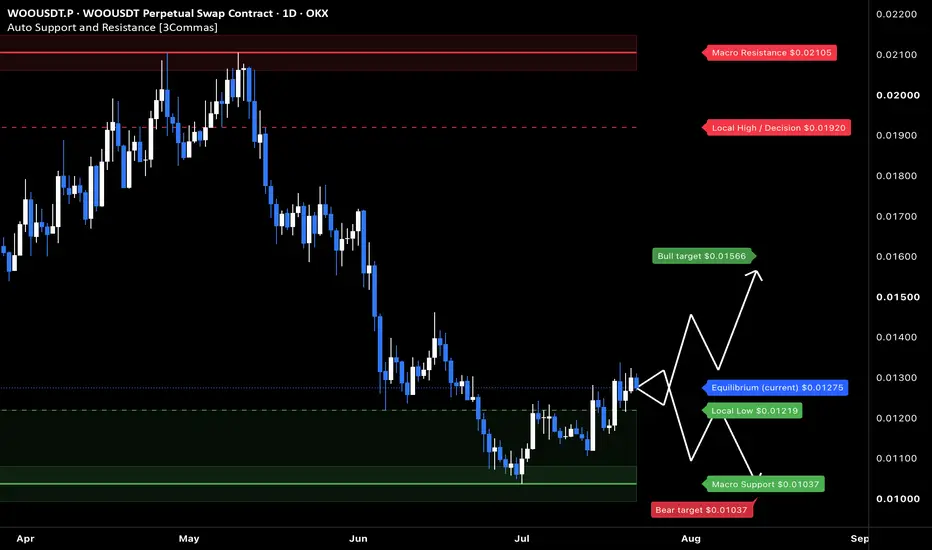
WOO unwound from the $0.021 highs down to the $0.01037 floor in June, then reversed and reclaimed ground to $0.01278. Price is building higher off the base — the tape is rotating up rather than continuing to break down.
The Setup ⚙️
The Range Floor 🟢
$0.01037 (Macro Support) is the demand base, with $0.01219 (Local Low) as the nearer shelf. Both have held, and that's the floor this range pivots on.
The Decision Point 🔴
$0.01920 (Local High) is the structural gate. Before it, the $0.01569 measured-move target is the first objective — clearing it keeps the recovery intact.
The Roadmap 🛣️
Hold above $0.01219 → rotate up toward $0.01569 → then challenge $0.01920. Invalidation is a clean daily close below $0.01037 — that breaks the base.
This is a GRID Range Play: a defined band to rotate, buying the lower half and scaling out into strength.
More setups in profile.
#WOO #WOONetwork #crypto #trading #TA #3Commas #GRID
In-depth trading ideas
WOO / WOOUSDT Long Setup | Breaker Block ReclaimSOMI / SOMIUSDT Bullish Setup | Futures Trade Idea
SOMI / SOMIUSDT Long Setup | Breaker Block Reclaim
MARKET ANALYSIS
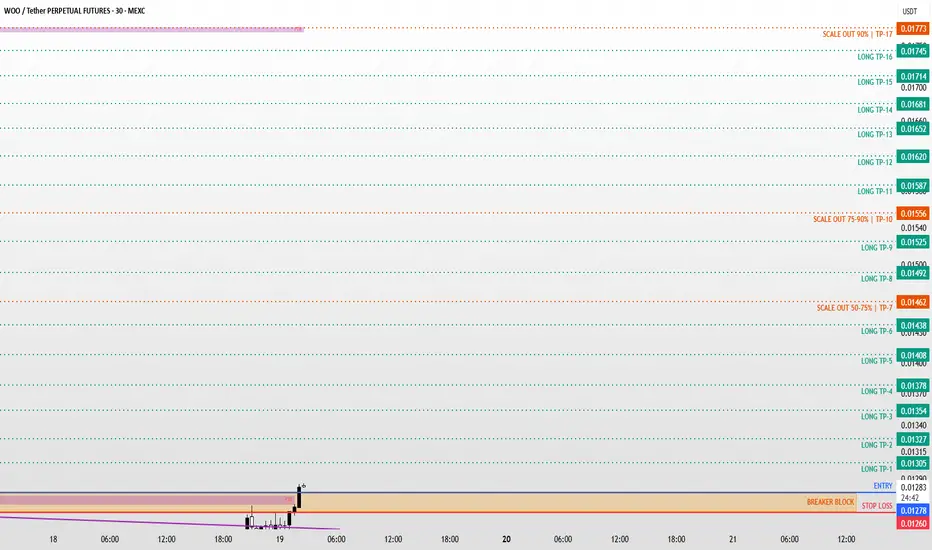
WOO is currently reacting from a key technical area highlighted on the chart.
As long as the protected support zone remains intact, the bullish market structure remains valid and higher liquidity targets may continue to attract price action.
A breakdown below the invalidation level would weaken the current bullish scenario and require a reassessment of market conditions.
📍 Entry, Stop Loss and Take Profit levels are marked directly on the chart.
━━━━━━━━━━━━━━
⚠️ DISCLAIMER
This publication is provided solely for educational and market observation purposes.
Nothing contained in this analysis should be considered financial advice, investment advice, or a recommendation to buy or sell any financial instrument.
All trading and investment decisions remain solely the responsibility of the individual trader.
Always conduct your own research and apply proper risk management before entering any position.
━━━━━━━━━━━━━━
🎯 PARALOG
▪️Crypto Market Analysis
▪️BTC Futures Signals
▪️Bitcoin & Altcoin Market Analysis
Precision • Momentum • Timing
━━━━━━━━━━━━━━
Exchange: #MEXC Futures
#bitcoin #btc #crypto #futures #technicalanalysis
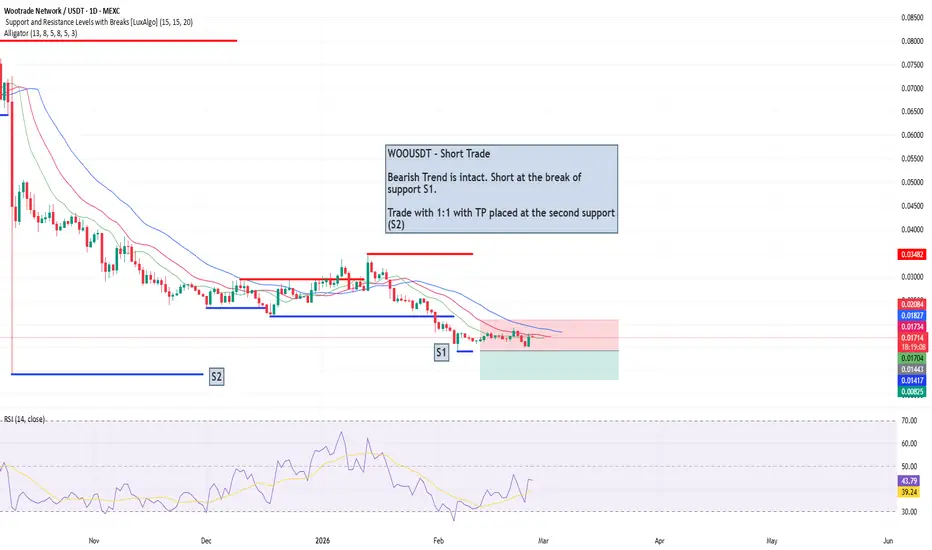
woousdt shortInstructions:
Entry point: yellow
Stop loss: red
Take profit: green
👉Leverage x 5-10-20 for crypto
👉Leverage x 20-50-100 for commodities, stocks, indices, and forex
👉Margin 1-5% max.
Always practice risk and money management.
Invest a maximum of 5% on any trade or across all your trades.
Invest only what you can afford to lose, as no one is in control of the market.
👉Our analyses are primarily based on:
breakouts: two trend lines (ascending and descending) and a line indicating a horizontal breakout.
chart patterns: shoulders and head, triangle parttern, elliott impulse, etc etc.
We don't always have the time to track them at all times or to represent them visibly, given the numerous signals, the number of channels to manage, and especially because of the often rapid pace of market movements.
indicators: We associate at least two indicators with this technique.
👉Depending on the circumstances, we use specific indicators, often setting 3 or more take profit levels.
👉Indeed, there are good days in trading and also bad days. No one can promise to win every trade, and like all traders worldwide, we also experience stop-loss orders. However, we win more than we lose and remain positive.
👉You can close the position before or after the take profit orders indicated by the green lines if you are personally satisfied; the same applies to stop loss orders.
👉We must stay positive, clear-headed, and humble.
we cannot provide all instructions or all trades here on this channel.
Good luck to us all, and may God guide us. Amen
WOOUSDT 1D#WOO is moving above the daily EMA50 and is on the verge of breaking above the descending resistance on the daily chart. If confirmed, the potential upside targets are:
🎯 $0.0222
🎯 $0.0243
🎯 $0.0263
🎯 $0.0293
🎯 $0.0331
⚠️ Always remember to use a tight stop-loss and maintain proper risk management.
WOOUSDT UPDATE#WOO
UPDATE
WOO Technical Setup
Pattern: Falling Wedge Pattern
Current Price: $0.0293 USDT
Target Price: $0.0600 USDT
Target % Gain: 125.74%
Technical Analysis: WOO is showing signs of a potential breakout from a falling wedge pattern on the 1D chart, indicating bullish reversal potential if price continues to hold above key breakout levels. The token is currently trading around ~$0.0293 USDT, and a sustained breakout above the wedge resistance—with confirmation from volume—could validate a move toward the projected upside target near $0.0600 USDT. This target zone reflects the measured move from the wedge pattern and aligns with structural resistance above the current market price.
Time Frame: 1D
Risk Management Tip: Always use proper risk management.
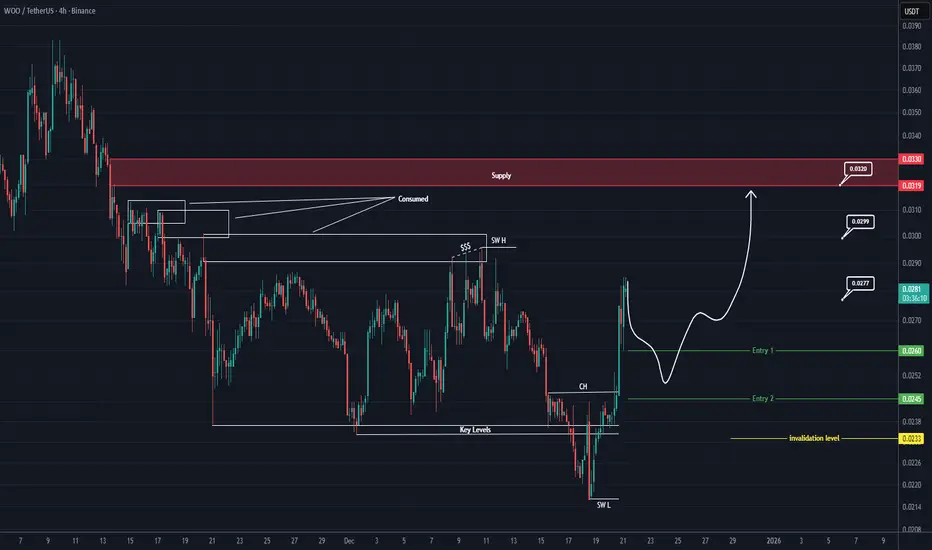
WOO Buy/Long Setups (4H)The order blocks at the top of the chart have been consumed, and most sellers have lost a large portion of their orders.
Price has completed a strong CH and is currently trading around a key level. There is also a liquidity pool visible above the chart near the Swing High (SW H).
All of these signs indicate that if a pullback occurs, price could move back toward higher levels.
The targets are marked on the chart, but the main target is the red supply zone.
For risk control, a pullback is needed to enter at a more favorable price, since the invalidation level must be placed properly to avoid losses if price drops.
If a pullback occurs, we will enter a buy/long position.
For risk management, please don't forget stop loss and capital management
When we reach the first target, save some profit and then change the stop to entry
Comment if you have any questions
Thank You
#WOO/USDT Ready for Breakout After Long Consolidation!#WOO
The price is moving in a descending channel on the 1-hour timeframe. It has reached the lower boundary and is heading towards breaking above it, with a retest of the upper boundary expected.
We have a downtrend on the RSI indicator, which has reached near the lower boundary, and an upward rebound is expected.
There is a key support zone in green at 0.02557. The price has bounced from this level multiple times and is expected to bounce again.
We have a trend towards consolidation above the 100-period moving average, as we are moving close to it, which supports the upward movement.
Entry price: 0.02688
First target: 0.02738
Second target: 0.02821
Third target: 0.02923
Don't forget a simple principle: money management.
Place your stop-loss below the support zone in green.
For any questions, please leave a comment.
Thank you.
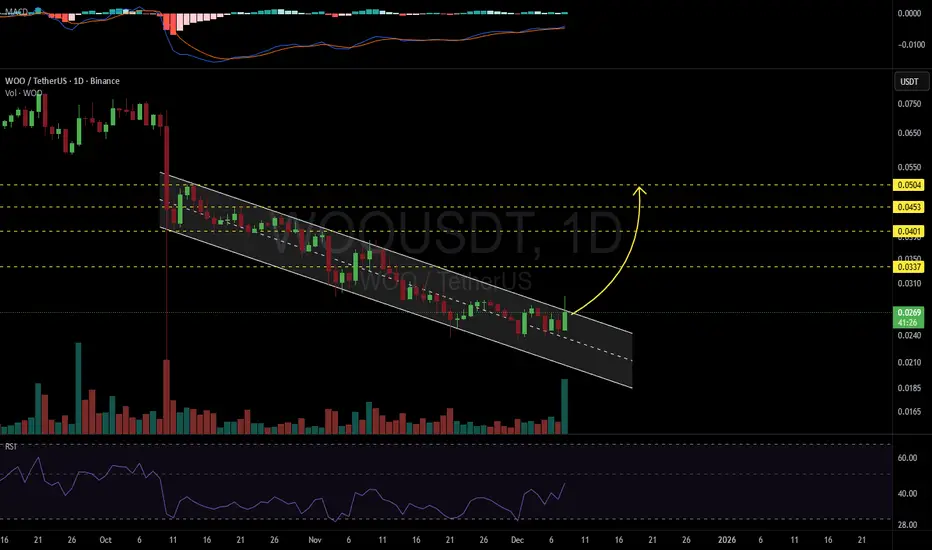
WOOUSDT 1D#WOO is moving inside a descending channel on the daily chart and volume has increased. It is trying to break above the channel resistance. If that happens, the potential targets are:
🎯 $0.0337
🎯 $0.0401
🎯 $0.0453
🎯 $0.0504
⚠️ Always remember to use a tight stop-loss and maintain proper risk management.
WOO Looks Bullish (2H)At the top of the chart, we have a large liquidity pool.
Currently, WOOUSDT has created conditions that, with an appropriate risk-to-reward ratio, may move toward the targets and sweep the liquidity pools.
We have a bullish CH and BOS on the chart, and the momentum is strong.
Remember, if you enter a position, stick to your stop-loss, as the risk-to-reward is only valuable if you respect it.
Touching the invalidation level will invalidate this analysis and signal.
Do not enter the position without capital management and stop setting
Comment if you have any questions
thank you
WOOUSDT UPDATE#WOO
UPDATE
WOO Technical Setup
Pattern: Bullish falling wedge pattern
Current Price: $0.0735
Target Price: $0.1367
Target % Gain: 85.40%
SWB:WOO is breaking out of a falling wedge pattern on the 1D timeframe. Current price is $0.0735 with a target near $0.1367, showing about 85% potential upside. The breakout signals a strong bullish reversal setup, indicating possible continuation to the upside. Always use proper risk management.
Time Frame: 1D
Risk Management Tip: Always use proper risk management.
WOOUSDT 1D#WOO is moving inside a symmetrical triangle on the daily chart. For the bullish scenario, it must break above the resistance cluster — which includes the triangle resistance, the daily SMA200, and the Ichimoku cloud. If that happens, the potential targets are:
🎯 $0.0842
🎯 $0.0953
🎯 $0.1080
🎯 $0.1207
🎯 $0.1388
🎯 $0.1619
⚠️ Always remember to use a tight stop-loss and follow proper risk management.
WOO/USDT – Descending Triangle Pressing Price at Key Zone!📌 Technical Overview
WOO/USDT is currently trapped inside a Descending Triangle on the daily timeframe. Sellers are consistently creating lower highs, while buyers are defending the critical support zone at 0.054–0.066.
This structure reflects the final stage of accumulation or distribution before the market makes a decisive move. With the triangle’s apex approaching (late September – early October), a major breakout or breakdown is likely imminent.
---
📊 Pattern Details
Main pattern: Descending Triangle (statistically bearish, but upside breakout still possible).
Key support: 0.0540 – 0.0660 (golden zone).
Immediate resistance: Descending trendline + horizontal barrier at 0.0798.
Volume: Declining, showing the market is waiting for a trigger. A volume spike on breakout/breakdown will confirm direction.
Apex: Nearing → price will soon be forced to choose a side.
---
🟢 Bullish Scenario
Confirmation: Daily close above the descending trendline and 0.0798 with strong volume.
Upside targets:
Target 1: 0.0798 → +22%
Target 2: 0.1019 → +56%
Target 3: 0.1282 (major supply zone) → +96%
Invalidation: Close back below 0.065 after breakout (false breakout).
---
🔴 Bearish Scenario
Confirmation: Daily close below 0.0540 with a failed retest (support flips into resistance).
Downside target:
Measured move projection: ~0.0282 (approx. −57% from current price).
Invalidation: Fast recovery above 0.065–0.07 after breakdown.
---
📌 Strategy & Notes
Wait for daily close confirmation with volume before taking positions.
Breakouts/breakdowns without strong volume = high risk of false signals.
Safer entries come after a successful retest of breakout levels.
Always apply risk management (set stops at invalidation levels).
Descending triangles in downtrends lean bearish, but if bulls defend the support zone, it could trigger a strong rally.
---
📝 Conclusion
WOO is at a make-or-break zone.
Holding 0.054 and breaking above the trendline could lead to a rally toward 0.1282.
Losing 0.054 support opens the door to a sharp drop toward ~0.0282.
At this stage, patience and confirmation are key. The market is quiet now, but a strong move is coming soon.
---
#WOO #WOOUSDT #Crypto #Altcoins #TechnicalAnalysis #DescendingTriangle #Breakout #Bearish #Bullish
WOO Bullish Setup in Progress – Accumulation Phase Near Breakout#WOO has been moving in a perfect sideways range, currently sitting at the bottom of its structure. After a prolonged downtrend, the price has now shifted into a strong accumulation phase – a classic sign of potential reversal.
Key Points to Watch:
Price consolidating in accumulation zone
Break above resistance = bullish confirmation
Retest of breakout zone = ideal long entry opportunity
Risk management is crucial (always set SL)
My plan:
Wait for a clean breakout of the accumulation + resistance levels
Enter long on successful retest
Target upside continuation with strong volume
This setup could lead to a strong bullish move if confirmed.
What do you think – will #WOO break out soon or stay in the range longer?
Drop your thoughts below and don’t forget to like & follow for more setups!
#WOO #WOOUSDT #crypto #altcoins #accumulation #sidewaysmarket #breakout #longtrade #bullishsetup #priceaction #tradingstrategy #riskmanagement #cryptotrading #technicalanalysis
WOO/USDT Ready for Breakout After Long Consolidation!Chart Analysis (1D Time Frame):
This WOO/USDT chart shows a potential breakout setup after months of accumulation and downward pressure.
📉 Descending Trendline Resistance:
The price has been in a steady downtrend since December 2024, repeatedly rejecting from a descending resistance line.
🟨 Strong Accumulation & Support Zone (0.0540 – 0.0643 USDT):
A strong horizontal support zone has formed since April 2025. Price has bounced multiple times from this area, indicating growing buying pressure.
📈 Breakout Potential:
If WOO breaks above the descending trendline with strong volume, this could signal the start of a major bullish move.
🎯 Potential Upside Targets (Key Resistance Levels):
1. 0.0798 USDT – Initial breakout confirmation.
2. 0.0963 USDT – First bullish target.
3. 0.1334 USDT – Medium-term target.
4. 0.1916 USDT – Aggressive target.
5. 0.2544 USDT – Extended bullish continuation target.
6. 0.3655 – 0.3844 USDT – Long-term major resistance zone.
⚠️ Risk Note:
A fake breakout is possible if the volume is weak. If price breaks below the accumulation zone, the bearish trend may continue.
📌 Conclusion:
WOO is at a critical decision point. A confirmed breakout from this descending structure could trigger a significant bullish rally. A must-watch setup for both traders and investor.
WOO ANALYSIS 2025 H2 GETTEX:WOO long setup (1 D) 🚀
✅ Entry Zone: $0.05 – $0.057 (13-month demand)
🎯 Targets
• TP-1: $0.12 (H2-24 distribution block)
• TP-2: $0.29 (Feb-24 breakdown)
⛔ Stop-Loss
Daily close < $0.044
📊 Thesis
• Q1-25 #revenue +3.5× YoY 📈
• 2.23 M GETTEX:WOO burned in May; monthly auto-burns ongoing 🔥
• 30 % XP staking APR; 80 % #WOOFi & WOO X fees → stakers 💰
• WOOFi live on Linea; #Solana liquidity program next 🌐
• #WOO X > $600 M avg daily volume; new perps weekly ⚡
• #Omnichain hub roadmap = #CeFi-grade liquidity across L1/L2s 🚀
WOOUSDT at weekly support, eyeing for 0.25$Here is how I see WOOUSDT to play out.
The price is currently dipping into weekly support zone WS1.
It is likely that the price will bounce from here towards weekly resistance zone WR1.
In case the price reaches this weekly resistance zone WR1, it is likely to experience some pullback.
However, this pullback will be only to gather some momentum to break WR1 on the next attempt and move towards next weekly resistance WR2.
Other indicators are also looking healthy for this one, thereofore, it seems that it going to resume its upward journey, that started in the beginning of April 2025, soon.
I am scaling in this one now an as the price dips deeper into this support zone. This one is a good bet and will provide a good return with considerably limited risk.
Whats your thoughts on that? Share with me in the comment.
#WOO/USDT#WOO
The price is moving within a descending channel on the 1-hour frame, adhering well to it, and is heading for a strong breakout and retest.
We are seeing a bounce from the lower boundary of the descending channel, which is support at 0.0870.
We have a downtrend on the RSI indicator that is about to be broken and retested, supporting the upward trend.
We are looking for stability above the 100 moving average.
Entry price: 0.0880
First target: 0.0892
Second target: 0.0905
Third target: 0.0922
WOO Buy/Long Setup (4H)The trigger line has been broken, we have a bullish CH, and a double bottom is also visible.
As long as the green zone holds, it can move toward the TPs. The targets are marked on the chart.
A daily candle closing below the invalidation level will invalidate this analysis.
For risk management, please don't forget stop loss and capital management
When we reach the first target, save some profit and then change the stop to entry
Comment if you have any questions
Thank You
WOOUSDT Bullish setupWOOUSDT – Daily Trendline Break | Target: 0.64 🎯🚀
Hey traders 👋
WOO Network (WOOUSDT) just broke a major daily trendline, and that could be the signal bulls have been waiting for. After months of drifting lower, we’re finally seeing signs of a momentum shift — and it’s coming from a key structural breakout.
📉 Daily Downtrend Broken
Price has finally snapped out of the descending trendline that’s been capping upside for weeks (or even months). This isn’t a fakeout on a 1H chart — this is a daily timeframe trendline break, which usually means something real is brewing.
Volume’s picking up, structure’s turning bullish, and price has stepped above the trendline with conviction. That’s what we like to see.
📈 Trade Setup
Here’s the plan:
Entry: Already positioned post-breakout (from current area)
Target: $0.64 – previous key resistance & potential measured move
Stop Loss: $0.045 – below recent lows and invalidation of the breakout
This gives you a massive risk-to-reward profile, but you need to manage the volatility — WOO is not a sleepy token.
🧠 Why This Matters
Trendline breaks on the daily are rare and meaningful
WOO has history of explosive moves after long consolidation
Sentiment in the altcoin space is improving – this could ride that wave
📌 The Breakout Is In – Now It’s All About Follow-Through
Are you long WOO yet or waiting for a retest? Let’s compare notes and see who’s aiming for the same levels.
#WOOUSDT #Altcoins #TrendlineBreak #BullishBreakout #CryptoTrading #SwingTrade #PriceAction #CryptoSetup #DailyChart