XAGUSD Bullish Continuation | Support Holding Strong (1H)
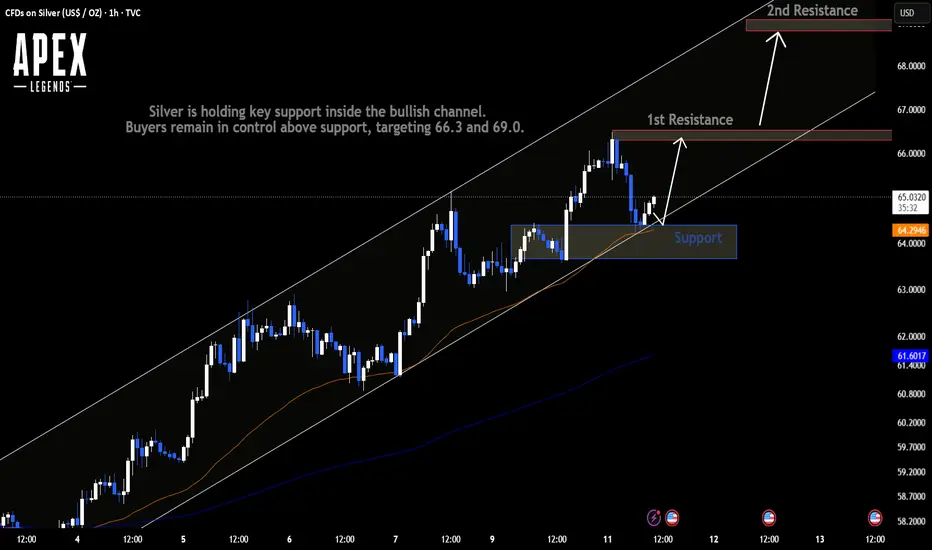
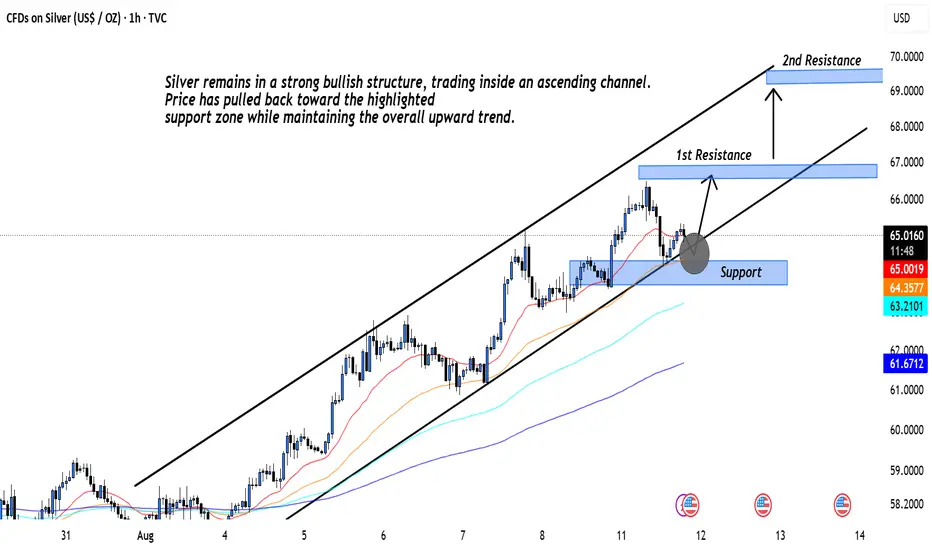
Silver remains in a strong bullish structure, trading inside an ascending channel. Price has pulled back toward the highlighted support zone while maintaining the overall upward trend.
If support around 64.0–64.4 holds, buyers could push price toward the marked resistance levels:
* 🟦 Support: 64.0–64.4
* 🟢 1st Resistance: 66.3
* 🟢 2nd Resistance: 69.0
* 📈 Bias: Bullish above support.
A confirmed breakout above the first resistance could open the way toward 69.0. A breakdown below the support zone would weaken the bullish setup.
In-depth trading ideas
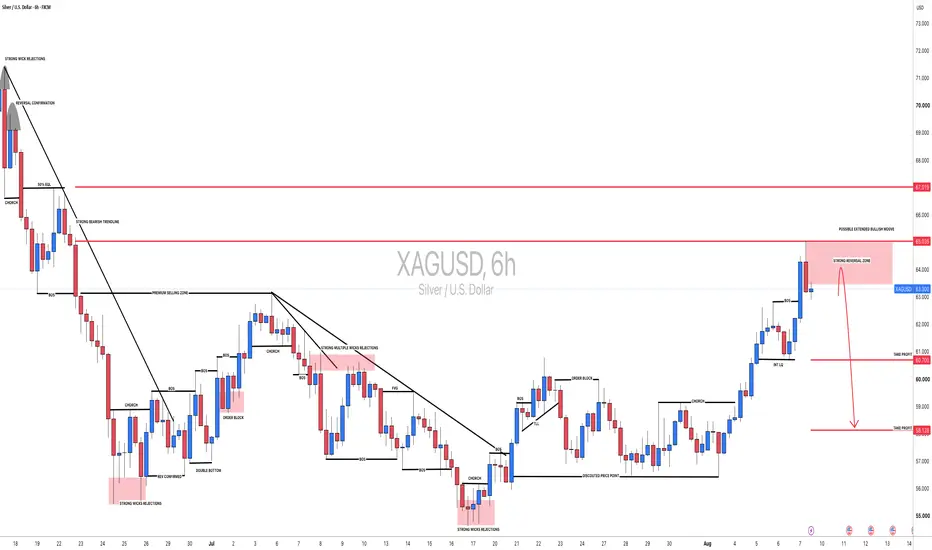
XAGUSD | SILVER | SELL SETUP...
🥈 XAGUSD | SILVER | SELL SETUP
📍 Entry Zone: 63.80 – 64.30
🎯 Profit Targets:
TP1: 62.80
TP2: 61.00
TP3: 59.50
🛡️ Risk Control: 65.10
📊 Market View:
Silver is trading close to the 64.50–65.00 resistance zone after a strong bullish move. Price is showing hesitation near this supply area, which can create a potential bearish pullback. If sellers gain control and price moves below the 62.80 support area, the downside can extend toward 61.00 and then 59.50. A sustained breakout above 65.00 would weaken the sell setup.
Silver H4 | Upside Potential AheadBased on the H4 chart nalysis, we can see the price falling to our buy entry level at 62.18, a pullback support that is slightly above the 38.2% Fibonacci retracement.
Our stop loss is set at 59.68, a pullback support that aligns with the 61.8% Fibonacci retracement.
Our take profit is set at 64.28, a pullback resistance.
High Risk Investment Warning
65% of retail investor accounts lose money when trading CFDs with this provider. You should consider whether you understand how CFDs work and whether you can afford to take the high risk of losing your money.
XAG/USD Bullish Continuation — Eyes on $66.50
Silver (XAG/USD) is maintaining a strong bullish structure on the 1-hour chart, with price forming higher highs and higher lows along a clearly rising trendline. The recent pullback found support near the trendline, followed by a recovery toward $65.10.
As long as price holds above the rising support and the $64.70–$64.90 area, bullish momentum remains intact. A break above the recent $65.50–$66.00 resistance could open the way toward the marked target zone.
🎯 Target: $66.40–$66.60
#XAGUSD | BEARS TAKING CONTROL — DOWNSIDE EXPANSION AHEAD? 🔺Silver’s bullish momentum is faltering as its price struggles to hold strength around key resistance levels. This current structure suggests sellers could regain control if buyers fail to reclaim recent highs. Based on the recent high and the area where price has rejected, a possible bearish trend continuation is plausible. This would push the price to fill the remaining FVG area left behind due to bullish impulse.
🔺From a liquidity perspective, the market might sweep nearby buy-side liquidity before initiating a bearish expansion. This is why we have a secondary view. It clearly indicates that if bullish impulse is extended and most of the buy-side liquidity is taken out, we should wait for price to show some strong characteristics before entering the market. Also, please use smaller timeframes when taking any sell entry.
🔺There are two areas sellers can target. The first is at $60. Setting a take profit there is safe and secure. Once we achieve that, closing the 50% position and moving our take profit to $56 is recommended. If you agree with our idea, like, comment and follow for more trading setups.
Kind Regards,
The SetupsFX_ Team ❤️🏆
Silver (XAG/USD, 4H) — Reclaiming the range highsBroke the multi-week downtrend with a clean +MSS, then built out a Support/Resistance range before finally breaking structure (+BOS) out of it. Price pushed into a new premium zone, swept a minor pocket of liquidity, tapped an +OB, and is now holding above the +Equilibrium Block.
Bulls in control above 60.95. Next stops: 66.84 (Target 1) → 71.42 (Target 2) liquidity pools.
Lose the Equilibrium Block and the setup needs a rethink.
Not financial advice.
Bullish Structure Targets 67.00+XAGUSD H1 | Bullish Structure — Buyers Eye 66.50–66.90
Analysis
XAGUSD is holding above the rising trendline and key support, keeping the short-term structure bullish.
A successful hold above 64.30–64.50 could support another move higher toward 66.00, followed by 66.50 and the 66.70–66.90 resistance zone.
A confirmed breakout and close above 66.90 could signal further bullish continuation.
Key Levels:
🟢 Support: 64.30–64.50
🎯 TP1: 66.00
🎯 TP2: 66.50
🔴 Resistance: 66.70–66.90
Invalidation: Sustained break below the rising trendline/support.
Educational analysis only. Not financial advice. Manage risk appropriately.
*XAG/USD Bullish Breakout Eyes 62.50 ResistanceSilver (XAG/USD) has confirmed a strong bullish breakout from its consolidation range and is now trading above the key support zone around **61.10–61.20**. The recent impulsive move suggests buyers remain in control, while the ascending trendline continues to support the bullish structure.
As long as price holds above the highlighted support area, the next upside objective is the **62.50 resistance zone**, which aligns with the marked target and a significant supply level. A successful breakout above 62.50 could open the door for additional gains, while a failure to hold above 61.10 may trigger a short-term pullback before the uptrend resumes.
**🎯 Target:** **62.50 USD**
**🛡️ Key Support:** **61.10–61.20 USD**
**📈 Bias:** **Bullish**
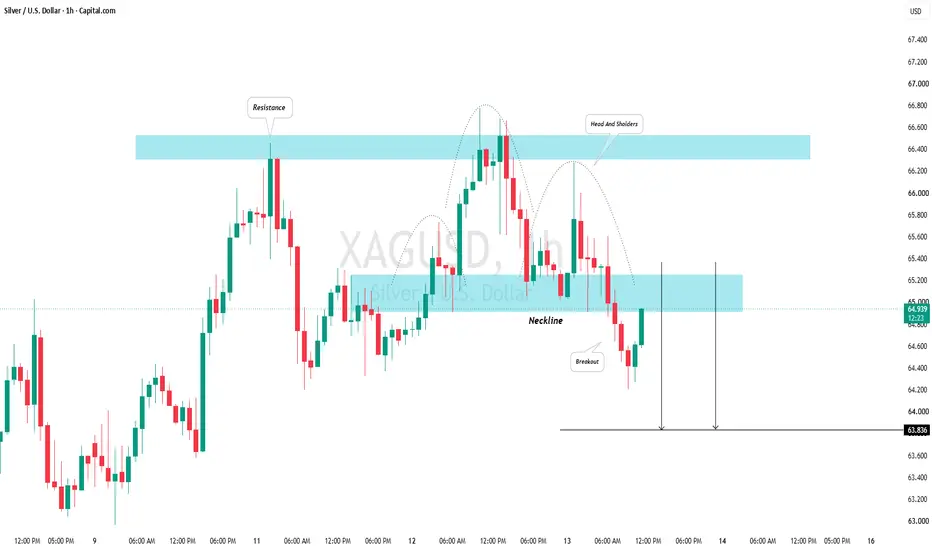
SILVER (XAG/USD): Looks Like It's Set For a Pullback.There is a significant probability that 📉SILVER will experience a retracement from the highlighted key horizontal support level.
The formation of a head and shoulders pattern on an hourly timeframe indicates substantial selling pressure.
Our target is 63.83.
XAGUSD – Breakout Retest Continuation Setup Toward 67.00📊 XAGUSD – Breakout Retest Continuation Setup Toward 67.00
🔍 Market Overview
XAGUSD has broken above the descending trendline that had capped price for several weeks. The move came after a period of tightening price action, suggesting that buyers were gradually absorbing selling pressure before finally forcing a breakout.
Price is now trading above the previous structure, but after such a strong move, a pullback toward the 59.00–60.00 area would be completely normal. If this former resistance zone turns into support, it could provide the base for the next bullish leg.
📈 Market Structure Insight
Primary Bias: Bullish
Momentum: Improving after the breakout
Current Phase: Breakout followed by a potential support retest
The important shift is that price has moved outside the previous descending structure. As long as XAGUSD remains above the breakout area, the current pullback can be viewed as a potential retest rather than an immediate bearish reversal.
🚀 Trading Scenarios
✅ Bullish Scenario — Primary Bias
Conditions:
Price pulls back toward the 59.00–60.00 breakout zone.
Former resistance holds as new support.
Buyers return with rejection wicks, bullish candles, or renewed upward momentum.
Trade Plan:
Look for buying opportunities after a confirmed bullish reaction from the retest area rather than chasing price after the initial breakout.
🎯 Target: 67.00
❌ Bullish Invalidation Scenario
Conditions:
Price breaks decisively below the breakout support.
XAGUSD moves back inside the previous structure.
Selling pressure continues without a meaningful bullish response.
A sustained move below the retest zone would weaken the breakout setup and increase the probability of a deeper correction.
📍 Key Levels to Monitor
🟢 Breakout Support Zone: 59.00–60.00
🎯 Bullish Target: 67.00
🔴 Invalidation Area: Sustained trading below the breakout structure
⚠️ Trading Perspective
The breakout has already occurred, so the key question now is whether buyers can defend it. Entering immediately after an extended bullish move may offer weaker risk-to-reward than waiting for price to revisit the broken structure.
A controlled pullback followed by a strong bullish response would provide a much cleaner continuation setup.
🧠 Professional Insight
This setup is supported by:
A clear breakout above the descending trendline.
Tightening price action before the move.
Stronger buying momentum after resistance was cleared.
A logical retest zone around 59.00–60.00.
A clearly defined upside objective at 67.00.
The breakout itself is only the first signal. The stronger confirmation would come if XAGUSD successfully turns the old resistance area into new support.
🛡️ Risk Management
Wait for bullish confirmation at the retest.
Avoid chasing price after a strong breakout candle.
Place invalidation below the confirmed support structure.
Respect the breakout zone if price moves back below it.
Keep position size appropriate and protect capital.
No confirmed retest, no trade.
This analysis is for educational purposes only and should not be considered financial advice.
XAG/USD | Finally going up!By analyzing the 4H chart of Silver we can see that after CPI news dropped, it surged in price, reaching the Supply Zone but then it was rejected by it and is now being traded at around 66.00, below the Supply Zone.
Now considering all the geopolitical events taking place right now, with an stoppage on war and positive news regarding negotiations, I expect further rise for Silver, breaking above the Supply Zone and then go for the Major BuySide Liquidity pool above the 67.15 level and sweep the liquidity there. Then afterwards, if it stabilizes above the Supply Zone, we could see a move towards the 4H FVG Low at 69.92 level.
However, if Silver fails at retesting the Supply Zone again, it could drop to the FVG High at 65.31 level, and in order to go back up, it must stabilize above the FVG C.E. at 64.80. If it breaks down, then the next target will be at 62.99 level to sweep the minor sellside liquidity there.
Silver Shines Bright: Breakout Sets the Stage for 70Hello Traders! Silver has been building a strong base for several weeks after finding support around the $55–56 zone. The prolonged consolidation has now resulted in a decisive breakout above the key $62.3–62.5 resistance zone, suggesting a potential shift from accumulation to a new bullish expansion phase.
What Makes This Setup Interesting?
200 EMA Breakout:
Silver has reclaimed the 200 EMA after trading below it for an extended period, signalling a potential change in the medium-term trend.
EMA Breakout + Retest:
The breakout was followed by a successful retest, with price holding above the EMA and strengthening the bullish structure.
Major Resistance Breakout:
The long-standing $62.3–62.5 resistance has finally been taken out, clearing an important supply zone.
Best Continuation Entry:
For traders looking for confirmation rather than chasing the initial breakout, the breakout of the recent swing high formed above the resistance zone could offer the best continuation entry.
Target Confluence:
The projected target is around $69–70, supported by multiple technical factors:
Range/Channel Height Projection
Parallel Channel Breakout
Breakout Structure & Measured Move
Previous price-action structure around the $70 zone
This confluence makes $70–71 an important medium-term objective to watch.
Invalidation:
The bullish setup would weaken if Silver fails to sustain the breakout and starts closing below the key resistance zone around $62.3–62.5.
Therefore, for this setup, a close back below resistance will act as the primary invalidation signal.
Trade Structure:
Resistance: $62.3–62.5
Continuation Trigger: Breakout of the recent swing high above resistance
Target Zone: $70–71
Invalidation: Close below the breakout resistance
The idea here is not to chase the first breakout candle, but to look for confirmation and continuation above the newly established swing high.
Let’s see whether Silver can convert this major breakout into a sustained move toward the $70+ zone.
Closing Note:
As always, this is a technical view based on price action and chart structure. Markets can behave differently from expectations, so manage risk according to your own trading plan.
Trade safe & trade smart!
Thanks for reading.
Regards Amit.
Silver's Wave 4 Pullback Could Set Up the Next Major RallySilver remains structurally bullish after completing a multi-year Rounding Bottom. The preferred scenario is a relief rally into the Primary Supply Zone, followed by a final Wave 4 correction toward the Primary Demand Zone. A successful defense of demand could trigger Wave 5, targeting fresh all-time highs and the long-term objective around 206.77 USD. Until demand fails, the correction remains a healthy pullback within the broader uptrend.
Probability Over Prediction.
WESLAD Research
SILVER (4H) – Bearish Correction Setup Following SMT RejectionOverview
Silver (SILVER) on the 4-hour timeframe is trading inside an established ascending channel structure but is currently showing signs of structural exhaustion near the upper boundary. Following a strong impulsive rally, price action has printed an SMT divergence peak, indicating waning bullish momentum and setting up a potential corrective move downward.
Key Technical Confluences
SMT Peak & Channel Resistance: The recent high near the top of the ascending channel shows an SMT divergence signal, pointing to a rejection from major overhead supply (Order Block zone near 66.00–67.00).
Break of Structure & Momentum Shift: Previous bullish legs featured clear structural confirmations (+BOS and Fair Value Gaps / FVG), but price is now stalling near the highs and forming a rounding distribution pattern.
Support Targets:
Support Target 1: ~63.60 (Interim minor support)
Target 2: 61.00–61.62 (Confluence of the major Breaker block and +OB zone)
Target 3: 58.20 (Extended downside target lower in the channel structure)
Trade Strategy & Levels
Bias: Short / Corrective Bearish
Entry / Setup Zone: Looking for confirmation on the lower timeframe following rejection from the upper channel boundary.
Downside Targets:
Primary Take Profit 1: 63.60
Primary Take Profit 2: 61.62 (Breaker / +OB zone)
Extended Target: 58.20
Invalidation / Stop Loss: Placed safely above the recent high wick and upper channel boundary resistance (> 67.15).
Educational Takeaway
Understanding SMT Divergence & Breaker Blocks: Smart Money Technique (SMT) divergence occurs when correlated assets fail to make matching higher highs or lower lows, signaling underlying market weakness or institutional distribution. Pairing this with key structural elements like Breaker blocks and Fair Value Gaps (FVG) allows traders to map out high-probability retracement zones against the dominant trend.
What are your thoughts on this setup? Are you looking to short the correction or waiting for a deeper discount at the support zone? Drop your analysis below!
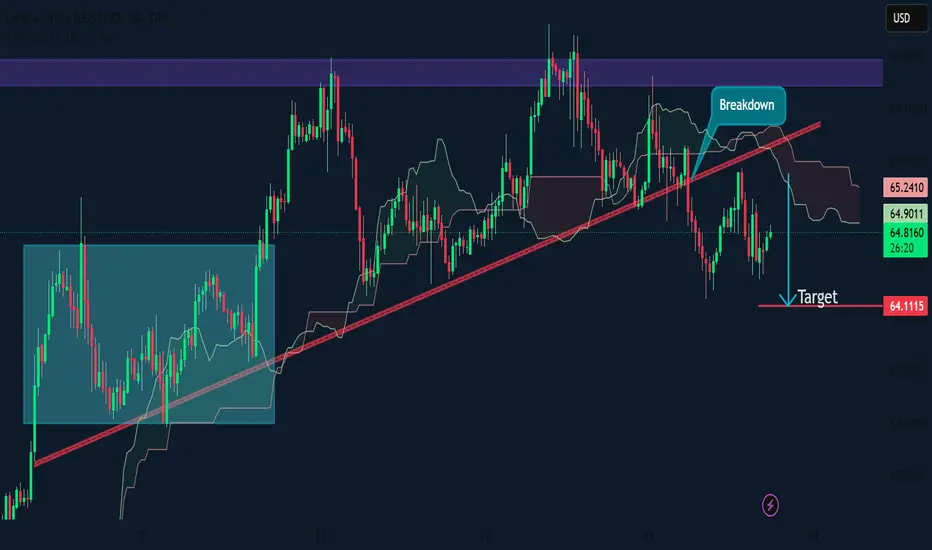
Silver (XAG/USD) – Bearish Breakdown SetupSilver has broken below the **rising trendline**, signaling a potential bearish reversal after failing to hold the previous bullish structure. Price is currently around **64.86**, with the breakdown suggesting further downside pressure. If sellers maintain control below the broken trendline, the move could extend toward the marked **target at 64.11**. The bearish setup remains valid while price stays below the breakdown area and resistance around **65.20–65.50**.
**🎯 Target: 64.11**
**📉 Bias: Bearish**
**⚠️ Key Resistance: 65.20–65.50**
XAGUSD | Holding $61.60 Is Key to Silver's Next Leg Up📉 On the medium-term timeframe, silver may be forming a corrective rally after a sharp selloff.
🔢 Based on the wave structure, we currently appear to be in Wave 3.
🛡️ Key Support: $61.60
Only a sustained hold above this level keeps the bullish continuation valid.
📊 Full wave count details are marked on the chart.
🌍 Fundamentals: Dollar weakness on Fed rate cut expectations + strong industrial demand support the upside.
XAGUSD Bullish Movement Continuation | Support Holding Strong.Silver: Strong Bullish Structure — 64.0-64.4 Support Holds the Channel
Silver remains in a strong bullish structure, trading inside an ascending channel. Price has pulled back toward the highlighted support zone while maintaining the overall upward trend.
If support around 64.0-64.4 holds, buyers could push price toward the marked resistance levels.
Key Levels:
🟦 Support: 64.0 – 64.4
🟢 1st Resistance: 66.3
🟢 2nd Resistance: 69.0
📈 Bias: Bullish above support
Analysis:
As long as the 64.0-64.4 support zone holds, the ascending channel and broader bullish structure stay intact, keeping the path open for buyers to push toward the marked resistance levels. A confirmed breakout above the 1st Resistance at 66.3 could open the way toward the 2nd Resistance at 69.0.
A breakdown below the support zone would weaken the bullish setup and put the channel structure at risk.
XAG/USD BULLISH DIVERGENCE BREAKOUT On daily TF there is a bullish divergence perform on silver and LH breakout is also done at price around 64$ there is a 2 month plus consolidation and a valid breakout most likely its a bottom of silver market and now silver enter in a bullish momentum. so its a great opportunity for buyers and investors as well. because professional trader most favorite phase is trending phase or advancing phase which generate huge dollars.
Stay tuned for more updates
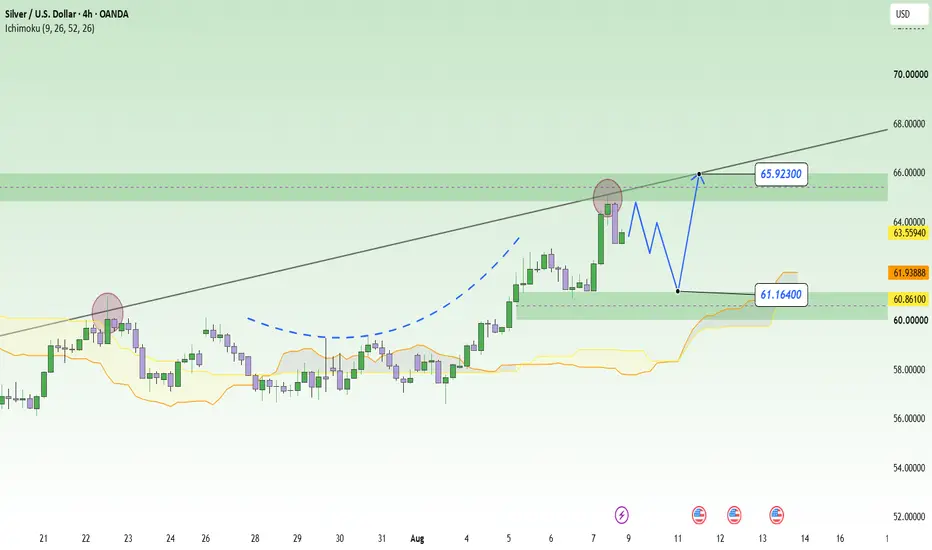
XAGUSD: Pullback May Present Opportunities for BuyersXAGUSD maintains a clear bullish structure on the H4 timeframe, having rebounded strongly from the 58 level and consistently formed higher lows. The current decline from the 65 area appears to be a corrective move following the recent rally rather than a trend reversal signal.
The most notable zone is 60.60–61.16, where technical support and the Ichimoku Cloud converge. Should the price pull back to this level and buying pressure re-emerge, I anticipate XAGUSD could initiate a new upward leg—initially returning to the recent peak before testing the 65.92–66.00 range.
The macroeconomic backdrop also supports this scenario; recent weak US labor data has weighed on the USD and bond yields, creating a more favorable environment for precious metals. Therefore, rather than chasing the price at current levels, I prefer to wait for a pullback and a bullish reaction at the support zone.
The bullish scenario would be undermined if XAGUSD decisively breaks below the 60.60–61.16 zone and sustains its position beneath it.
XAG/USD Bullish Continuation – Pullback to TrendlineSilver (XAG/USD) is maintaining a strong bullish structure after breaking above the previous resistance zone near 60.00. Price is currently pulling back toward the rising trendline, creating a potential continuation setup.
📈 Key Support: 63.00–63.20
🟢 Trendline Support: Around 62.8–63.0
🎯 Target 1: 66.00
🎯 Target 2: 68.40
🛑 Invalidation: Below 61.83
If the trendline holds and buyers regain momentum, Silver could continue toward the 66.00–68.40 target zone. A clean break below 61.83 would weaken the bullish setup.
Trade with proper risk management and wait for confirmation before entry.
XAGUSD: Buyers Defend the Trend; 67.74 in SightXAGUSD continues to maintain a clear bullish structure on the H4 timeframe. The price is currently trading around 66.12—above both the EMA34 and EMA89—indicating that buyers remain in control of the primary trend.
Notably, after facing rejection at the upper boundary, the price held the lower support zone and staged a quick recovery. The pattern of higher lows remains intact, with the 65.49 level serving as a crucial short-term support.
If XAGUSD holds above 65.49, I anticipate that buying pressure could drive the price back to test the 67.00 level, potentially extending toward the 67.74 zone shown on the chart.
The bullish scenario would weaken if the price decisively breaks below 65.49, particularly if the underlying demand zone is also lost. For now, the priority remains waiting for pullbacks to identify buying opportunities rather than chasing the price at elevated levels.
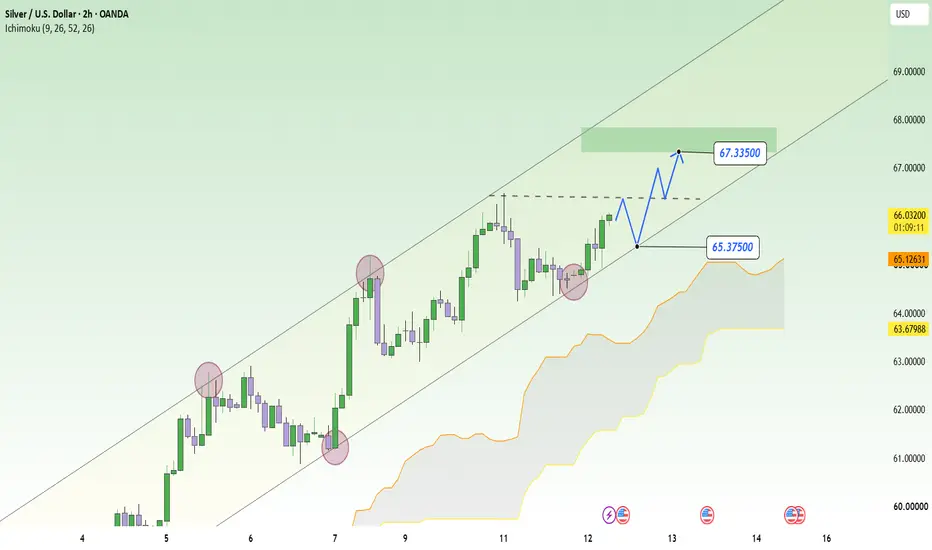
XAGUSD: Pullback Could Fuel the Next RallyXAGUSD maintains a clear bullish structure on the H2 timeframe, with price consistently forming higher lows and moving steadily within an ascending channel. The recent rebound from the channel's lower boundary indicates that buyers remain in control of the primary trend.
The 65.37 level currently serves as a notable support zone. Should the price pull back to this area while holding above the channel's lower boundary and the underlying Ichimoku support, I expect XAGUSD to regain momentum and target the 67.00–67.33 range.
From a fundamental perspective, expectations of a less hawkish Fed, weak US labor data, and safe-haven demand continue to provide support for silver. Consequently, I favor a "buy on pullback" strategy as long as the bullish structure remains intact.
Primary Trend: Bullish | Support: 65.37 | Target: 67.33