The Crypto Market Embraces Gold
Hello Traders,
Follow me to stay updated with the latest market insights and trading perspectives.
***
## Gold Is Now Trading On-Chain
Tether Gold (XAUt) is one of the leading Real-World Asset (RWA) tokens, designed to bring physical gold onto the blockchain.
Each XAUt token is backed 1:1 by one troy ounce (approximately 31.103 grams) of physical gold.
The gold backing XAUt is securely stored in Swiss vaults, and holders can verify the allocated gold through the platform.
While it is possible to redeem XAUt for physical gold above certain minimum requirements, redemption fees, shipping costs, and logistical constraints make it impractical for most retail investors. As a result, XAUt is generally used as a digital asset that tracks the price of gold.
In other words, gold has now become a digital asset that can be traded 24/7 and purchased in fractional amounts, much like Bitcoin or Ethereum.
***
## Traditional Finance Is Moving Into Crypto
In the past, it appeared that the crypto market was trying to integrate into traditional finance.
Today, we are increasingly seeing the opposite trend: traditional assets such as gold, government bonds, stocks, and real estate are entering the blockchain ecosystem.
This can be viewed as a sign that the cryptocurrency market is evolving beyond speculation and becoming a new financial infrastructure.
For retail investors, the crypto market offers several advantages:
* 24/7 trading access
* Fractional ownership
* Global market participation
* High liquidity
These features make digital asset markets significantly more accessible than many traditional investment markets.
***
## The Relationship Between Gold and XAUT
XAUT is designed to directly track the market price of physical gold.
Therefore, when the international gold price (XAUUSD) rises, XAUT tends to appreciate as well.
Likewise, when gold prices decline, XAUT generally follows the same direction.
From a trading perspective, buying and selling XAUT is essentially equivalent to trading gold within a blockchain-based environment.
***
## XAUUSD Monthly Chart Perspective
On the monthly timeframe, XAUUSD has recently pulled back from the 4,451.843 area and is currently testing the M-Signal zone.
The key question is whether this area can continue to serve as support within the long-term bullish cycle.
If the price breaks below the monthly M-Signal level, the long-term uptrend could weaken, increasing the possibility of a broader bearish transition.
In that scenario, traders should pay close attention to:
* DOM(-60) bottom signals
* HA-Low bottom signals
These indicators may help identify the formation of a new long-term support area.
***
## Short-Term Trading Outlook
The current short-term support zone is estimated to be:
4,017.315 ~ 4,054.755
The primary focus is whether buyers step in within this range and generate a meaningful rebound.
### Upside Levels to Watch
* First target: 4,451.843
* Second target: 4,895.440 ~ 5,030.630
Rather than simply looking for resistance breakouts, traders should monitor whether these levels can turn into support.
### Downside Levels to Watch
* First support: 3,854.845
* Second support: 3,332.019
If price declines further, the market should be evaluated for signs of a new bottom formation around these levels.
***
## XAUTUSDT Perspective
Since XAUTUSDT has a relatively short trading history, its chart lacks well-established support and resistance structures.
For that reason, monitoring XAUUSD (spot gold) alongside XAUT can provide a more reliable framework for analysis.
The current short-term support zone is:
3,995.89 ~ 4,046.68
The key factor is whether price can hold this area while attracting sufficient buying volume.
### Upside Targets
* First target: 4,281.04
* Second target: 4,779.01
### Risk Management Level
* A breakdown below 3,995.89
If this level is lost, it may be prudent to step back from trading and wait for clearer market direction.
***
## Conclusion
While it is beneficial for traders to understand the mechanics and structure of XAUT, a practical approach is simply to view it as a relatively stable RWA asset that tracks the price of gold.
At the end of the day, our goal is not to become experts in the asset's underlying structure, but to identify market opportunities and generate profits.
The boundary between traditional finance and cryptocurrency continues to fade.
As this trend progresses, however, the extreme volatility that once characterized many crypto assets may gradually diminish.
As a result, traders may need to shift away from aggressive momentum chasing and focus more on:
* Risk-managed trend-following strategies
* Capital rotation opportunities
* Long-term market structure analysis
These approaches are likely to become increasingly important as traditional and digital asset markets continue to converge.
***
Thank you for reading.
Wishing you successful and profitable trading. 🚀📈
Tether Gold perpetual contract
No trades
No trades
In-depth trading ideas
Gold Breaks 46-Day Downtrend — Bullish Continuation Ahead?XAUT/USDT 1D
XAUT has finally broken above the 46-day descending trendline, which has been keeping price capped since early June.
Now I’m watching the $4,050–$4,070 area, where the 0.618 and 0.5 Fibonacci levels sit. Ideally, we get a pullback into that zone, hold it as support, and continue higher.
But if price keeps pushing from here without giving the retracement, I’m still watching the same upside targets:
TP1: $4,271
TP2: $4,405
The key now is whether price can hold above the breakout area.
Gold Just Broke a Key Level - And the Setup Is Getting InterestiHey Traders! 👋 What's your read on XAUt / Tokenized Gold right now?
Gold just cracked below $4,000, and the move was anything but random. Spot XAU dropped 1.8% in 24 hours, dragging Tether Gold (XAUt) down with it to around $3,990 - and what stood out to me was that this happened despite fresh geopolitical noise out of Iran threatening the Bab-el-Mandeb shipping route. When gold can't rally on war headlines, that tells you something important about where the real money is flowing right now.
The macro narrative is doing the heavy lifting here. Institutions are rotating out of non-yielding assets like gold and into the dollar and short-term Treasuries, chasing yield in a high-rate environment. On top of that, SPDR Gold Shares (GLD) has seen massive ETF outflows since March, and we even saw Antalpha - a Nasdaq-listed lender - slash its XAUt position from $329M down to $138M, locking in over $50M in profit along the way. When whales are booking gains at these levels, you don't want to be the one catching the falling knife.
Technically, the picture is pretty clean. The 7-day RSI sitting at 32 tells me we're in oversold territory, but oversold in a downtrend just means the selling hasn't exhausted itself yet - it's not a buy signal on its own. Price is trading below both the 7-day and 30-day SMAs, confirming the bearish structure, and the immediate resistance to watch is $4,039 (daily pivot) followed by the Fibonacci 50% retracement at $4,152. Until one of those levels gets reclaimed with conviction, any bounce is just a relief rally inside a downtrend.
The level I'm watching most closely is $3,950 - that's the recent swing low and the last real line of defence before things could get messy. A clean daily close below $3,950 could open the door to further downside, and given the current macro environment, I wouldn't rule it out. On the flip side, if spot gold manages to stabilize and push back above $4,000 with some follow-through volume, XAUt could attempt a recovery toward the $4,039–$4,152 zone - but I'd treat that as a shorting opportunity rather than a trend reversal until the macro picture shifts.
That said, volatile setups like this one are exactly why entry point discipline matters so much - especially for anyone still finding their feet in crypto markets. A lot of newer traders I talk to actually start with more stable assets like USD₮ or XAU₮ just to get comfortable with how exchange mechanics work before layering in directional exposure. It makes sense: understanding order flow, deposits, and balance management on a calmer asset first saves a lot of costly mistakes later. WhiteBIT actually has something running right now that fits that learning curve well - their First Crypto Boost lets new users buy $50 in USD₮ or XAU₮, hold it on balance, and join a $10,000 USD₮ prize pool. There's also a $4 USD₮ referral bonus for every qualified friend invited, if you know someone who still hasn't taken their first step into crypto.
The bottom line: the trend is bearish, the macro headwinds are real, and the chart confirms it. I'm not looking for longs here unless $3,950 holds and we get a clear MACD crossover on the daily. Patience is the edge right now - there's no need to force a trade when the market is telling you to wait.
If this breakdown was useful, hit that like button and drop your thoughts below - always curious what levels other traders are watching. Good luck out there! ❤️
Disclaimer: Investing in crypto-assets involves significant risks. You may lose the entire amount of your investment. Invest responsibly.
XAUT - 1H - 23.07.2026Tether Gold is exhibiting a clean corrective pull-back, delivering a prime opportunity to buy the dip at major high time frame structural support.
🔍 Market Structure & Key Levels
The Intermediate Entry Block ($4,061.00 – $4,065.74):
This upper blue channel served as the primary high-volume accumulation base on July 21. As price returns to this region, it acts as a reliable structural floor to secure early entry fills.
The Major Demand Floor ($4,044.00 – $4,048.86):
This lower blue horizontal channel marks the exact launchpad of the previous massive bullish expansion. Institutional limit orders sit heavily in this zone, protecting the macro uptrend and offering an ideal secondary scale-in pocket.
The Resistance Target Pool ($4,100.14 – $4,116.00):
This upper pink channel represents the ultimate bullish objective. It is a major liquidity magnet where the market will look to clear out local swing highs and reward patient buyers.
💡 Outlook
The current pull-back is structurally healthy, allowing the market to sweep trailing retail stops and tap resting buy orders. Building a multi-tranche long position within these blue demand zones positions the account optimally to capture the next leg of macro expansion back toward the $4,100 ceiling.
XAUT - 4H - 16.07.2026The major support psychological floor at $4,000 has snapped. Heavy selling volume is driving price action through a structural void, targeting the lower demand clusters near $3,910 and $3,850.Sitting out until the flush completes.
Macro Technical Analysis for XAUt
The Breakout Failure:
XAUt had been aggressively fighting to hold a floor above $4,000. The pink zone around $4,017 – $4,040 was acting as the line in the sand for buyers.
The Present Drop:
Slicing beneath $4,000 marks a heavy bearish shift. Price action is cascading downward through a structural imbalance zone with very little immediate history to hold it up.
The Gold Catchment Targets:
The first minor stabilisation floor rests near $3,910. The ultimate institutional accumulation block sits lower down between $3,845 and $3,860.
XAUT - 4H - 11.07.2026This chart shows Tether Gold (XAUt) trading within a massive, tight horizontal range on the 4 hour time frame, displaying deep compression right beneath a major historical block.
🔍 Key Levels & Market Structure Analysis
The Primary Pivot Overhead ($4,215.13):
This black line represents the clear, immediate boundary line. Price has tested this level multiple times over the last month, leaving rejection wicks every time. Reclaiming this level is essential for bulls.
The Master Supply Ceilings ($4,328.90 & $4,401.22):
These pink horizontal bands represent institutional distribute blocks. They mark major local peaks where heavy selling pressure historically entered the market to slam price back down.
The Lower Liquid Accumulation Band ($4,034.10):
This blue horizontal channel represents the core floor of the entire structure. Buyers have reliably protected this zone, turning it into a fortress of demand.
📈 Trading Strategy & Execution Plan
Because gold tokenisation models are building high volatility compressions, look to trade the structural pathways marked by the projection lines on your canvas:
Strategy 1: The Liquidity Sweep Rebound (Bottom Projection Path)
As projected by your lowest hand-drawn lines, the market frequently runs an optimisation sweep below range lows to grab retail stop losses before launching up.
Trigger: Wait for an aggressive, fast drop that spikes directly through the bottom support line but instantly snaps back above it within a 1-hour or 4-hour window.
Entry Zone: $3,910.47 – $3,950.00 (Strictly within your drawn lower trap zone).
Stop Loss: Below the structural floor invalidation line at $3,870.00.
Take Profit Target: $4,034.10 (Target 1) and $4,215.13 (Target 2 / Mid Range).
Strategy 2: The Institutional Supply Short (Middle/Top Projection Paths)
If price skips a lower sweep and directly pumps up into the overhead barriers, look to short the initial touches of those unconfirmed resistance ceilings.
Trigger: A clean 4-hour bearish reversal print inside either of the pink blocks.
Entry Variant A (Conservative): Inside the $4,310 – $4,335 zone.
Entry Variant B (Aggressive Expansion): Inside the $4,385 – $4,410 zone.
Stop Loss: Set it exactly 25 dollars above whichever specific entry block you select.
Take Profit Target: Ride the range rotation back down to $4,215.13 or lower.
💡 Core Execution Rule
Do not execute any heavy breakout long positions at the current price of $4,108.56. The market is floating in a no-man's land directly between the active zones. Chasing trades here forces you to sit through premium decay and choppy distribution.
Let price commit to either hitting the lower blue sweep anchor or printing an unmitigated test inside the pink ceilings before jumping in.
Walsh shifts the landscape, but gold sellers remain in control!✅ Gold prices experienced significant volatility this week. Initial buying on dips and safe-haven demand gave way to a sharp sell-off driven by stronger-than-expected US economic data, persistent inflation, a strengthening dollar, and heightened expectations of continued interest rate hikes by the Federal Reserve. However, a late-stage rally pushed gold prices back toward the $4,100 level.
✅ Since the outbreak of the US-Iran conflict, investors have been bracing for Federal Reserve interest rate hikes. These expectations intensified following last week's inaugural Federal Open Market Committee (FOMC) meeting chaired by Kevin Walsh. On Thursday, economic data—specifically the Personal Consumption Expenditures (PCE) index showing annual inflation rising to 4.1% and initial jobless claims falling to 215,000—reinforced the view that the Fed has little room to loosen policy.
✅ DBS Bank assesses that major central banks will not view falling oil prices as a reason to cut interest rates; instead, they regard this as a crucial buffer allowing them to maintain benchmark rates at restrictive levels for longer without inflicting serious damage on the real economy. Once major global central banks demonstrate a trend of policy convergence rather than divergence, non-US dollar major currencies are likely to halt their decline following the Fed meeting and—after the dollar's recent rally—begin to consolidate and establish a base.
✅ After failing to decisively break through the $4,100 level, the spot gold price ended the week about $10 below that mark but maintained strong upward momentum leading up to the close.
✅ Adrian Day, President of Adrian Day Asset Management, stated that his base-case scenario remains unchanged, though "uncertainty" might be a more fitting term. He noted that the market is being pulled in multiple directions: on one hand, there is the risk of escalating conflict involving Iran; on the other, if the artificial intelligence and technology sectors continue to decline, the demand for liquidity could rise—particularly given that US stock margin debt is at record highs.
Bearish Scenario: If the price of gold fails to hold the $4,000/ounce level, a deeper drop to the $3,700–$3,800/ounce range is entirely possible in the short term.
Note: Stay highly vigilant in the coming week—a "tsunami of data" is approaching. With US markets closed on Friday, July 3rd, for Independence Day, the actual trading week will be shortened; this coincides with institutional portfolio rebalancing at the end of the month, quarter, and half-year. Market liquidity could face sudden disruptions, triggering systemic volatility and profoundly impacting short-term risk appetite and global trading behavior.
What are your predictions for gold prices next week? Feel free to share your insights.
With Bitget’s UEX platform, traders can simultaneously buy XAUUSD CFDs and short-sell technology stocks via US stock futures—all from a single account.
XAU - Decline due to geopolitics and the Fed✅ At the beginning of the week, expectations of further easing tensions in the Middle East followed the signing of a preliminary agreement between the US and Iran, paving the way for an extension of the ceasefire and the resumption of shipping through the Strait of Hormuz. Concerns about inflation due to energy supply disruptions also lessened, oil prices fell sharply, and risk appetite recovered.
✅ However, market optimism did not last. On Thursday, at its first FOMC meeting, the new Fed Chairman Walsh kept interest rates unchanged, and a rate cut was no longer the baseline scenario as previously expected, with the possibility of rates remaining unchanged or even rising again this year being re-evaluated.
✅ What surprised investors equally was that this shift toward a hawkish stance occurred precisely when the conflict in the Middle East seemed to be subsiding. With the US and Iran signing a framework agreement (which could pave the way for lasting peace if Tehran's nuclear ambitions are curbed), shipping through the Strait of Hormuz is gradually recovering to pre-conflict levels.
Gold was one of the hardest-hit assets this week. With a stronger dollar, rising real yields on US Treasury bonds, and hawkish signals from the Fed, spot gold prices continued their downward correction, falling for the third consecutive week. While uncertainty persists in the Middle East, the gradual progress in the US-Iran deal has reduced safe-haven demand, and upward revisions to interest rate expectations have caused gold to lose support from both geopolitical risk aversion and interest rate cut trade.
✅ Many parties will be heading to Switzerland! The conflict in Lebanon remains a key issue.
However, last Saturday's deadly Israeli attack in Lebanon could put a test to the crucial ceasefire agreement aimed at ending the US-Iran conflict…
Ending the fighting in Lebanon is a prerequisite for the 60-day talks between the US and Iran, aimed at resolving disputes over Iran's nuclear program and other thorny issues, and paving the way for a longer-term agreement. This is crucial for reopening the Strait of Hormuz and stabilizing global oil supplies.
Outlook for next week: Unless there are unexpected developments, the market will continue to focus on Middle Eastern geopolitics and US PCE data.
✅ The core tension for the market next week will not only be whether risk sentiment recovers as geopolitical risks ease, but also whether the Federal Reserve's response undergoes a more profound shift. Upcoming bank stress tests and numerous speeches by Fed officials will be crucial moments for investors to adjust their policy expectations.
✅ Regarding gold, market analysts believe that gold prices are likely to remain volatile next week as investors await the US core PCE (Personal Consumption Expenditures Index) for clues about the Federal Reserve's next move. Stephen Innes, managing partner at SPI Asset Management, said: “With the Fed appearing to be more responsive and increasingly sensitive to upcoming inflation data, every key data release will have an impact, but the core PCE will be the key event for gold and interest rates, and next week will be heavily dependent on this data.”
✅ Innes added that if inflation exceeds expectations, this could boost the dollar, push bond yields higher, and increase the risk of gold prices reaching $4,000 per ounce. Gold investors should prepare for volatility and be wary of a potential sell-off.
What are your predictions for gold prices next week? Share your views!
Trading direction:
Main support: The $4,000 price level has held.
Main resistance: The $4,246 - $4,268 price level has been broken. Gold is recovering strongly, and combined with the news of the reopening of the Strait of Hormuz, the price is even better supported.
With Bitget's UEX platform, traders can buy XAUUSD CFDs, all from a single Bitget account.
The US and Iran will reopen the Strait of Hormuz.✅ The ceasefire agreement between the US and Iran has significantly reduced geopolitical risks. President Trump announced the free passage through the Strait of Hormuz and the lifting of the naval blockade; the US and Iran signed a memorandum of understanding on the ceasefire agreement, with the formal signing ceremony scheduled for June 19th in Switzerland.
✅ Expectations of the reopening of the Strait of Hormuz eased concerns about disruptions to oil supply, leading to a sharp drop in crude oil prices.
✅ Gold and silver benefited from improved risk sentiment and a relatively stable US dollar, recording a recovery.
✅ The DXY index traded within a narrow range, reflecting market caution regarding Fed policy balanced by de-escalation of geopolitical tensions. Overall, the correlation between assets is clear: reduced geopolitical risk boosted equities and cryptocurrencies but put pressure on energy prices.
✅ Gold, as a safe-haven asset, faces short-term pressure but remains supported by industrial and investment demand. Institutional consensus suggests that macroeconomic data and G7 outcomes will dominate the short-term direction. If the inflation curve remains low, the precious metal is expected to maintain its resilience, while the rebalancing of crude oil supply and demand will depend on the implementation of the agreement.
✅ The trading outlook for last weekend was very positive, and the chart is still in the process of completion:
Main support: The $4,200 price zone has held.
Main resistance: The $4,246 - $4,268 price zone has been broken, and gold is recovering its upward momentum very well. Combined with the news of the reopening of the Strait of Hormuz, the price is even better supported.
With this agreement between the US and Iran, how high do you think the price of gold will rise? Share your opinion!
With Bitget's UEX platform, traders can buy XAUUSD CFDs, all from a single Bitget account.
XAUUSD: Get ready for a strong buy!✅Gold is fluctuating around $4,210-$4,246 per ounce and is under downward pressure after reaching a historical high.
✅The stronger-than-expected US May jobs report, released last week, has increased expectations of a Federal Reserve interest rate hike later this year, adding further pressure on gold prices.
✅Geopolitical situation: Trump announced the cancellation of attacks on Iran and stated that a US-Iran deal is expected to be signed later this week, possibly in Europe.
✅The reduction in geopolitical risk could lessen demand for safe-haven assets, providing short-term support for riskier assets. However, if the details of the deal do not meet expectations, volatility in the dollar and oil prices could add to the uncertainty in the Federal Reserve's decision-making process.
✅Trading Direction:
Main Support: The $4,200 price level needs to hold; a break below this level could continue the downtrend.
Main Resistance: The $4,246 - $4,268 price level needs to be broken to resume upward momentum.
With Bitget's UEX platform, traders can buy XAUUSD CFDs, all from a single Bitget account.
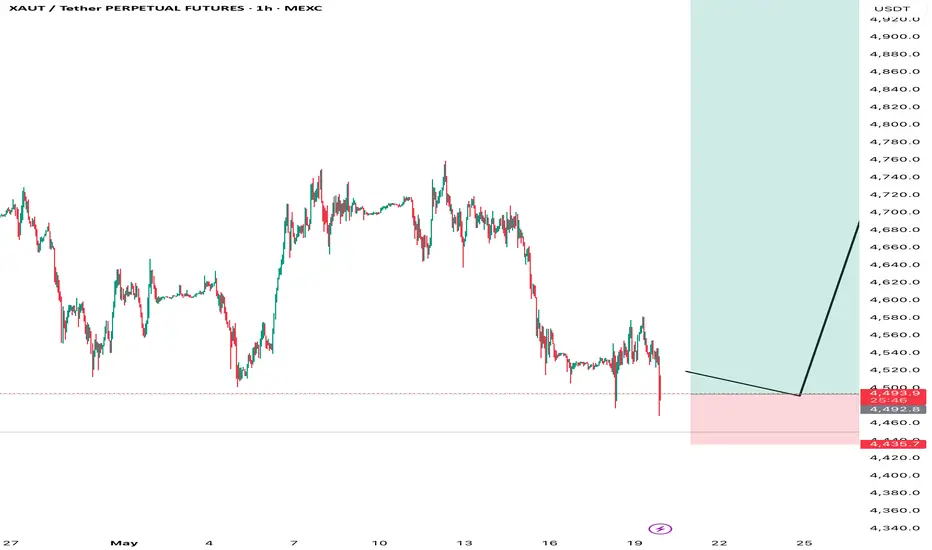
Trading idea XAUT/USDT LongTesting an important level with limit orders
— 50% Entry 1: $3955 — ‼️limit order
— 50% Entry 2: $3905 — ‼️limit order
— Stop: 1% from the average entry price, managed manually
— Target: $4150
Risk per trade: 0.1% of total deposit
Position size: 10% of the deposit (5% for Entry 1 and 5% for Entry 2)
RR 1:6
Gold plummets! After May jobs report exceeds forecasts.✅ The May jobs report, which far exceeded forecasts, adding 172,000 jobs compared to the expected 88,000, with unemployment remaining at 4.3%, triggered a sell-off in the precious metals market, causing gold prices to lose more than $125/ounce in a single session and marking one of the sharpest declines so far this year.
✅ Notably, this report came amidst market expectations that the Fed would soon cut interest rates. This means the Fed has less reason to ease monetary policy in the short term. This shift in expectations created a major shock to the gold market. At the same time, the US dollar strengthened.
✅ These are two factors that typically put direct pressure on gold. High yields offer investors more attractive profit-generating options, while a stronger USD makes gold more expensive for buyers using other currencies. As a result, the spot price of gold at one point fell to around $4,330 per ounce, its lowest level in over three months. Compared to the end of last week, the drop has exceeded $200 per ounce.
✅ Simultaneously, the easing of geopolitical risks in the Middle East has also caused this safe-haven asset to quickly lose its upward momentum.
Developments:
Gold prices fell to $4,370.00/oz (-3.90%), dropping to their lowest level in 2026, heading towards a nearly 4% weekly decline after the US jobs report strengthened the dollar and pushed back expectations of a Fed interest rate cut; Middle East tensions provided some floor but not enough to reverse the macroeconomic slide.
Direction:
➡️ Upward scenario: To regain upward momentum, gold prices need to break through the $4,350-$4,370/ounce resistance zone.
➡️ Downward scenario: If gold prices fail to hold the $4,311/ounce level, a deeper decline to the $4,100-$4,200/ounce range is entirely possible in the short term.
With Bitget's UEX platform, traders can buy/sell XAUUSD CFDs, all from a single Bitget account.
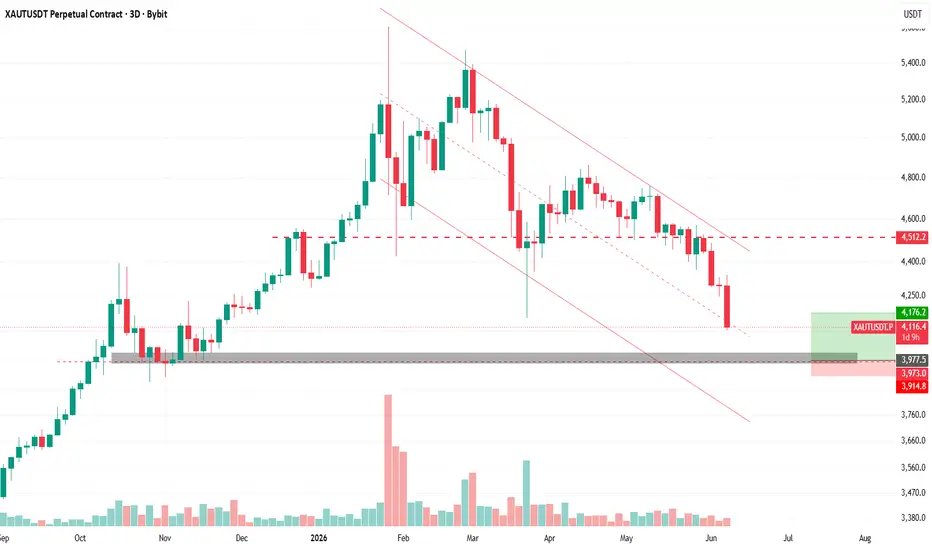
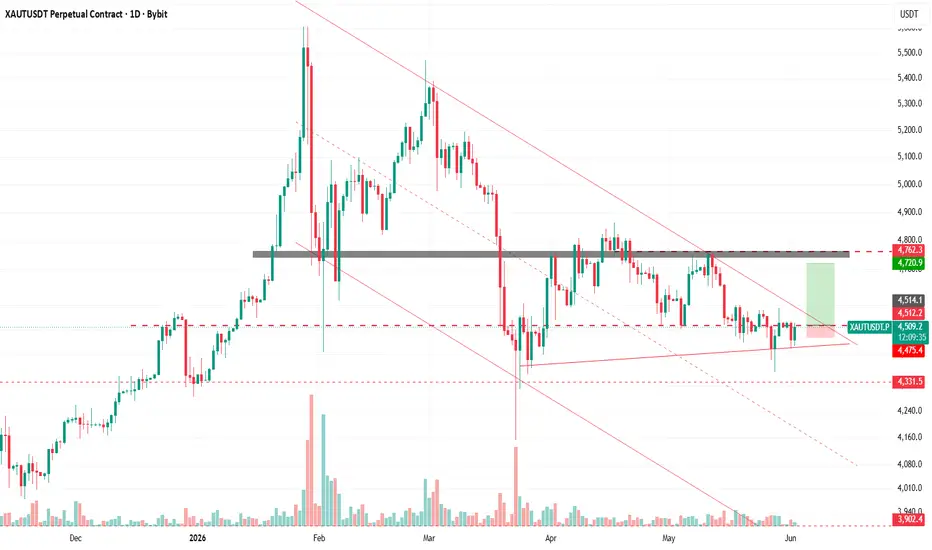
XAUTUSDT range: targeting the $4,800 ceilingThe Macro Picture 🗺️
XAUTUSDT set a structural peak at the $5,600 macro resistance in February, then rolled over into a sequence of lower highs — $5,400 in March, followed by a multi-month consolidation that capped at $4,800. That range is a distribution structure, not accumulation: every rotation higher was sold, RSI has stayed pinned below the midline near 42, and price is now grinding the lower edge. The path of least resistance, as indicated by the white projection, points down out of the range toward the $4,000 macro floor.
The Setup ⚙️
The Rejection: The $4,800 ceiling rejected price cleanly through April and May, and each push into it produced a weaker high. The bulls failed to reclaim the range top, and that failure is what shifts the structure from sideways to topping.
The Breakdown: Price is now pressing the lower boundary of the teal range near $4,400. Losing this floor triggers the sell stops clustered beneath it and opens the path toward the macro support, exactly the liquidity sweep the white projection is mapping.
The Accumulation Zone: A deeper flush into the $4,000 macro floor opens a textbook pocket for staggered, averaging-based entries — a DCA bot scales into the structural support that's held since the autumn base, instead of chasing the breakdown candle.
The Roadmap: Primary target sits at $4,000 — the macro support marked on the chart, a high-confluence floor where over-leveraged shorts get flushed and the next decision gets made. Invalidation: a sustained 1D close back above $4,800 would invalidate this bearish thesis and signal a structural reset back into the range.
XAU: Upside Potential in Gold Gold continues to consolidate within the key mid-term support zone we highlighted in our May analysis.
We expect a new upside wave to break out in the coming days, provided the price holds above the 4400–4275 support area.
The primary resistance targets for this potential move are 4810–4920 and 5100–5300.
Chart:
Previously on May 28 analysis
Chart:
Comment:
"Price is forming a reversal setup in a key mid‑term support zone at 4004–4278.
We expect a larger‑scale bounce in gold (and related equities over the coming weeks), with potential upside targets in the 4920–5110 resistance area."
XAUT Expectation:XAUT has the down trend and price an decrease one
more time on 4350 point from 4545 point, but above
this point price can increase till 4720 point.
Generally the geopolitical conflicts, should be advantage for the GOLD, but in this
situation the countries need the liquid cash to produce the war, and they are selling
the GOLD, also the war crisis in the country need to handle and they are selling the
Gold also to cover the country expenses, and also global inflation risk makes the
Gold weak, as investment asset
Trading idea XAUT/USDT ShortTesting the support and the lower boundary of the consolidation, holding below the MA50/MA200 on the daily timeframe (trend reversal).
— Entry: $4511 — market sell order
— Stop: $4575
— Target: $4310
Risk per trade: 0.4% of total deposit
Position size: 30% of the deposit
RR 1:3.3
XAUUSD: Gold start a Bat pattern🦇 Gold Retrace Bat Pattern Setup
This idea shows a potential Gold Retrace Bat Pattern forming with price reacting from a deep harmonic retracement zone. Point B retraces near the 0.886 Fibonacci level of the XA leg, creating the foundation for a possible Bat structure continuation.
The projection anticipates:
A move toward point C
Harmonic symmetry development
Final bearish completion into point D
The setup focuses on:
✔ Bat Pattern retracement behavior
✔ Fibonacci harmonic ratios
✔ AB=CD projection concepts
✔ Potential reversal zones (PRZ)
This structure can help traders identify possible continuation and reversal areas while following harmonic market geometry.
⚠️ Educational content only — not financial advice. Always wait for confirmation and apply risk management before trading.
XAUT Expectation:XAUT is in dangerous position now,it catch the consolidation
and price start the decrease form the resistance zone 4720
point and 4545 point can work as support zone, but up
direction is dangerous for the GOLD now, because of DXY and
price has downside target 4350 point.
Generally the geopolitical conflicts, should be advantage for the GOLD, but in this
situation the countries need the liquid cash to produce the war, and they are selling
the GOLD, also the war crisis in the country need to handle and they are selling the
Gold also to cover the country expenses, and also global inflation risk makes the
Gold weak, as investment asset