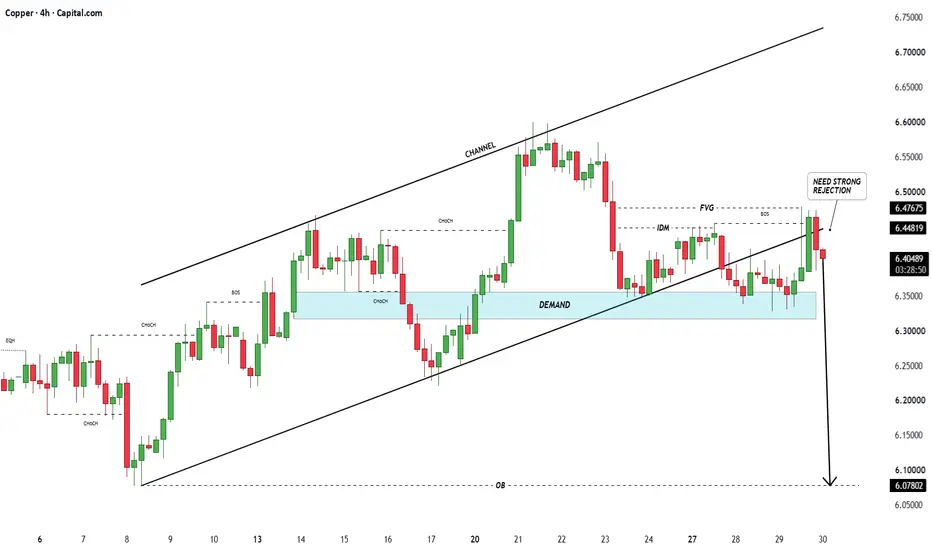
CopperXCUUSD - Order Block - Bullish Channel as an corrective pattern in Short Time Frame - Demand Zone - Break of Structure - Fair Value Gapby ForexDetective332
COPPER XCUUSDCopper (XCUUSD) Analysis + Use Cases + Manufacturing Process 1. Chart Analysis (Monthly – Shavyfxhub Style) Overall Structure: Copper is in a long-term ascending channel (green & red trendlines) since the early 2000s. The structure shows clear higher lows — bullish long-term market structure. Key Levels: Demand Floor (Green): Major support around $3.27 – $3.50 and the lower ascending trendline. Supply Roof (Red): Upper channel resistance currently near $6.00 – $7.00+. Current price is trading near the upper part of the channel after a strong multi-year rally. Technical Outlook: Long-term Bullish Bias. As long as price holds above the green demand floor, the secular uptrend remains intact. A break above the current highs would target the upper red channel lines. Verdict: Copper remains in a strong long-term bullish structure. Corrections are healthy within the bigger uptrend. 2. Copper Manufacturing Process Copper is produced mainly through two methods: Primary Production (Mining) Ore is extracted (open-pit or underground). Crushed and ground. Concentrated using flotation. Smelted to produce copper matte → converted to blister copper → refined by electrolysis to produce high-purity copper (99.99%). Secondary Production (Recycling) Scrap copper is melted and refined. Recycling is a major source of supply and is highly energy-efficient. 3. Major Use Cases of Copper Industrial Applications (Largest demand): Electrical & Electronics: Highest electrical conductivity after silver → used in wiring, motors, transformers, circuit boards. Construction: Plumbing, roofing, and building wiring. Renewable Energy: Critical for solar panels, wind turbines, and electric vehicle (EV) motors and charging infrastructure. Transportation: Cars, trains, and aircraft. Medical Applications: Antimicrobial Properties: Copper kills bacteria, viruses, and fungi on contact. Used in hospital surfaces, bed rails, door handles, and medical equipment to reduce infections. Wound dressings and some medical devices also incorporate copper. Key Point: Copper is often called “Dr. Copper” because its price reflects global economic health — especially industrial and construction activity. 4. Future Direction / Bias Long-term Bias: Bullish Driven by: Green energy transition (EVs, solar, wind) Global infrastructure spending Limited new mine supply Strong structural demand from AI data centers and electrification Short-term corrections are normal, but the multi-year structure remains upwardLongby Shavyfxhub2
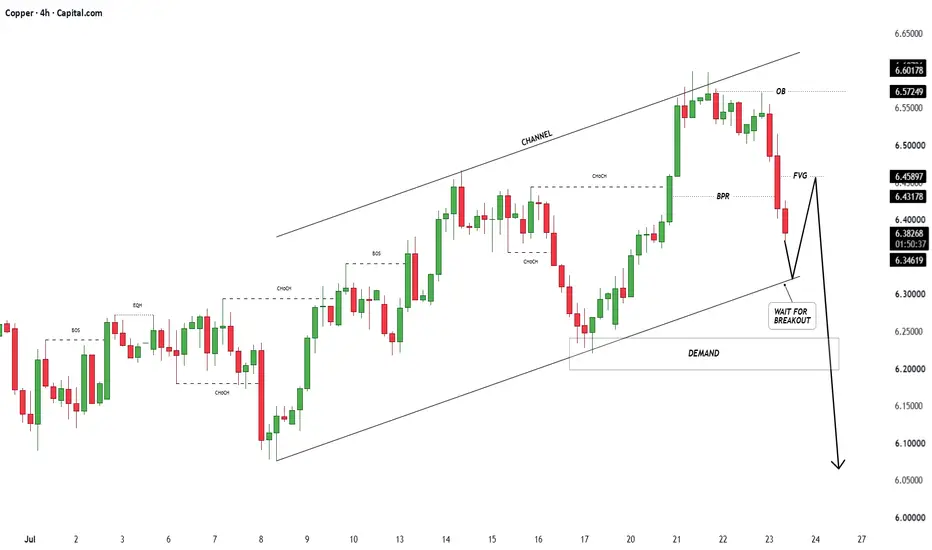
CopperXCUUSD - Fair Value Gap - Bullish Channel as an corrective pattern in Higher Time Frame - Demand Zone - Balanced Price Range - Order Blockby ForexDetective2
Copper Reversal Warns of More Pain AheadCopper has been taken to the woodshed as a breakout in the US dollar, alongside rising nominal and real Treasury yields, weighed on US dollar-denominated assets. Profit-taking may also have accelerated after the latest Section 301 tariff announcement excluded copper products already covered by Section 232, removing a catalyst some traders had anticipated. A textbook evening star reversal pattern beneath resistance at $6.60 a pound warns of growing downside risks. Attention now shifts to the confluence of the 50-day simple moving average, the minor uptrend from the July 8 low and horizontal support around $6.33 a pound. A convincing break beneath that zone would confirm the reversal pattern. Should price break below the support zone and hold there, shorts could be initiated with a tight stop above $6.33 a pound for protection. Initial downside targets are $6.23, where price bounced twice earlier this month, followed by the 100-day simple moving average at $6.145 and the more significant support zone around $6.04. Momentum indicators are neutral. RSI (14) sits at 51, while MACD remains above zero but is converging on its signal line. As a result, price action should take precedence. Good luck! DSShortby FOREX.com112
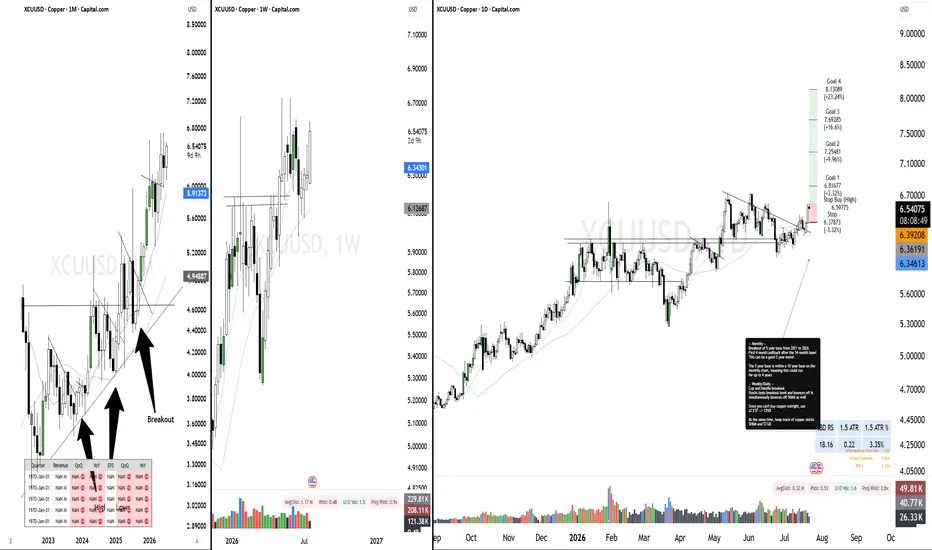
Copper: 5-Year Base Breakout & First PullbackThe Setup: AMEX:CPXR is a 2x leveraged ETF providing the cleanest way to get geared exposure to copper's breakout. Copper has officially broken out of a massive 5-year base (2021–2026) , which itself sits inside a larger 10-year base, suggesting the potential for a massive multi-year run. On the daily and weekly timeframes, we have a clear Cup and Handle breakout . Price is currently executing its very first 4-month pullback after the 54-month base, testing the breakout level and bouncing off it while simultaneously finding support at the 50-Day MA . Tip: Trade copper through AMEX:CPXR (2x). And keep the copper miners NYSE:HBM and AMEX:TGB on your radar. Reasoning: 5-Year Base Breakout (Major macro structure resolving upward) First 4-month pullback (Highest-probability entry point after a macro shift) Cup and Handle breakout (Shorter timeframe execution signal) Bounce off breakout level & 50-Day MA (Old ceiling converting flawlessly into new floor) Leverage Option: AMEX:CPXR (2x ETF) Longby vssebuyungo2
**Copper Chart: Key Price Levels Based on the 1-2-3 Analysis**In this chart, I have identified two key price zones where I expect the market to revisit. The first zone is based on the structure of the well-defined bearish channel. The second zone represents the **"Price Debt"** (an unresolved price level) according to my proprietary **1-2-3 Analysis** methodology. Shortby Behrouz-Hosseini_0
Copper FuturesI think I plotted the wrong copper futures, this one reflects actual price. You can see it's going to retest the top, possibly as soon as tomorrow.by hungry_hippo0
copper updatecopper will go further down toward support level then start going up as depicted on the chart .tps are spotted on the chart let see what would be the reaction by MtICHIUpdated 0
COPPER ISN'T JUST A METAL. ITS A LIQUIDITY SIGNALCopper has just reclaimed a resistance trendline that capped every major rally for nearly two decades. The first chart shows the long-term structure. Every rejection from this trendline led to a meaningful slowdown in global growth expectations. Today, that same structure has flipped into support for the first time. The second chart zooms into the breakout. Price didn't simply break above resistance. It came back, tested it from above, held the level, and continued higher. That's classic trend confirmation. Why does this matter for crypto? Because copper is one of the purest barometers of industrial demand and global economic activity. Strong copper prices usually reflect improving liquidity conditions, stronger manufacturing expectations, and expanding risk appetite. Bitcoin has historically performed best when liquidity expands, not contracts. No single chart predicts the future. But macro markets leave clues long before the narrative changes. Right now, copper is telling a very different story than the fear dominating crypto timelines. If this breakout continues to hold, it strengthens the broader case that the current weakness across digital assets is taking place within an improving macro backdrop rather than the beginning of a prolonged contraction. Sometimes the market that says the least tells you the most. COPPER/GOLD Longby Cryptollica12
Potential bullish bounce?Copper is falling toward the support level, which aligns with the 38.2% Fibonacci retracement and could bounce from this level to our take profit. Entry: 6.2121 Why we like it: There is a pullback support level that aligns with the 38.2% Fibonacci retracement. Stop loss: 6.0919 Why we like it: There is a pullback support level. Take profit: 6.3820 Why we like it: There is an overlap resistance level. Enjoying your TradingView experience? Review us! Please be advised that the information presented on TradingView is provided to Vantage (‘Vantage Global Limited’, ‘we’) by a third-party provider (‘Everest Fortune Group’). Please be reminded that you are solely responsible for the trading decisions on your account. There is a very high degree of risk involved in trading. Any information and/or content is intended entirely for research, educational and informational purposes only and does not constitute investment or consultation advice or investment strategy. The information is not tailored to the investment needs of any specific person and therefore does not involve a consideration of any of the investment objectives, financial situation or needs of any viewer that may receive it. Kindly also note that past performance is not a reliable indicator of future results. Actual results may differ materially from those anticipated in forward-looking or past performance statements. We assume no liability as to the accuracy or completeness of any of the information and/or content provided herein and the Company cannot be held responsible for any omission, mistake nor for any loss or damage including without limitation to any loss of profit which may arise from reliance on any information supplied by Everest Fortune Group.Longby Vantage5
Copper set to outperform gold and silver!!??Whilst gold and silver had huge percentage gain run ups with big retracements, copper made a fair run up but did not double in price. With strong technicals, fundamentals un relative un evaluation I would expect copper to make a huge run up here!Longby alexishistory111
Copper: 18 months in the making ; The chart says buy?The video is an analysis of Copper, along with the trade setup I created on 1 July 2026, the day after the US Commerce Department released its recommendation regarding Section 232 refined copper tariffs to the White House ; the event that has been years in the making. Given the Goldman Sachs' upgrade of the year-end price target to $13,735 per tonne, coupled with the formation of a supply deficit on the global scene due to mine disruptions in Indonesia, Chile and DRC, the structural bullish case has never been more pronounced. This is a comprehensive analysis of Copper in which I take you through the chart, EMA structure, the implications of the RSI and MACD on the dip, and the exact way in which I intend to trade it from here. If you are interested in trading commodities or learning technical analysis, then you will find this video interesting.Long03:13by Kearabilwe-Nonyana6
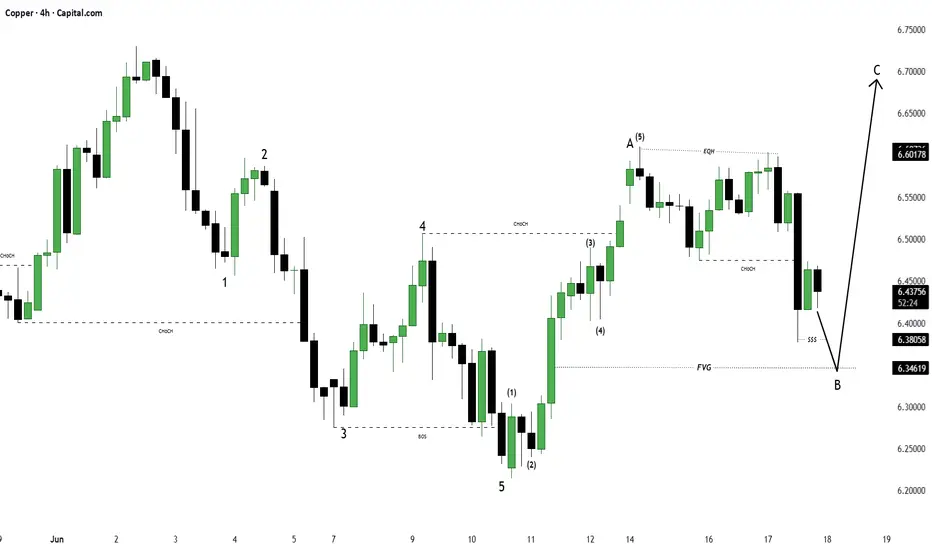
CopperXCUUSD - Completed " 1234 " Impulsive Waves - Fibonacci Level - 61.80% - Bullish Channel as an corrective pattern in Lower Time Frame - Sell Side Liquidity - Fair Value Gapby ForexDetective115
Copper:Tariff decision made. Exhaustion or buying opportunity?Copper arrives in July at an inflection point that has been building in the market over the past eighteen months. The US Commerce Department delivered its Section 232 recommendation on a tariff on refined copper to the White House on June 30, and the result is critical. If approved, a tariff of 15% in 2027 and 30% in 2028 will without a doubt cause another round of pre-tariff stockpiling in the second half of this year, and will result in higher prices on COMEX and LME outside the US. The reason for such a forecast is anything but speculation is the global copper market is expected to enter a deficit amounting to about 35,000 tons in 2026 because of the decline in mine production in Indonesia, Chile, DRC, and Zambia, in addition to the sustained end-use demand resulting from electrification, AI data centers, and grid modernis4ation. In just one year, copper has appreciated by more than 36%, and so far this year by 14%. The current price is addressing the question of whether the retracement from its all-time high at $6.72 per pound in May is exhaustion; or the best opportunity to buy it in the entire year. The price gives convincing reasons to go with the latter. What the price behavior shows us is the strong correction from an extended high that has taken place with price finding its support exactly where it should have 31.8% pullback of the March to May move towards the $6.15 area, while it is consolidating in an area that has shown itself to be solid resistance turned to support. There is no breakdown in the EMA formation yet. The EMA 9 at $5.55 and EMA 20 at $5.66 continue rising and are way below the current price level, maintaining the bullish construction despite any short-term weakness. The MA Cross of the 9 and 21 EMAs comes out at $5.55 and $5.74 respectively. The most straightforward metric on our chart at this point is the RSI. Its value stands at 41.02 ;not quite oversold territory just yet, although getting close and it is trading under its own signal line at 43.87, indicating the presence of selling pressure that has begun to slow down rather than escalate. In the case of a structurally bullish commodity with a real shortage problem, the experience tells us that the patience of long-term investors kicks in when the RSI approaches such values, even before reaching oversold territory. Trade recommendation Direction : Long Entry horizon : $6.10 – $6.25 (current consolidation band, former resistance now support) Primary target : $6.49 Secondary target : $6.72 Stop loss : $5.76 Technical scenarios Tariff confirmation breakout : White House confirmation of a phased 15% refined copper tariff for January 2027 triggers US stockpiling and tightens LME supply. Technical indicators turn positive as price clears $6.49 resistance. This targets the $6.72 all-time high, with Goldman Sachs' $14,000 LME forecast suggesting COMEX prices above $6.35, potentially reaching $7.00 by year-end. Consolidation and patience : Vague or delayed tariff outcomes result in range-bound trading between $6.10 support and $6.49 resistance. Sideways RSI and compressed MACD reflect a market waiting for clarity. The entry zone remains valid for accumulation while awaiting the catalyst. Tariff rejection unwind : Outright rejection removes the stockpiling premium, compressing the COMEX-LME spread. RSI dropping below 38 and a break of the $5.76 EMA 200 would target the $5.44 June low. Though unlikely, this high-velocity downside scenario requires a strict stop at $5.76. Longby Kearabilwe-Nonyana5
Equal Highs, Weak RSI: Copper Signals Bearish ContinuationHi Guys 👋 Lets look at the Copper Chart 👀 📌 By analyzing the daily chart of Copper against the US Dollar, we can observe the convergence of price highs, followed by the formation of equal highs, and ultimately the breakdown of the most recent low. This price behavior reflects a Wyckoff distribution structure in the market. 📌Additionally, with the formation of equal highs, a clear weakness can be seen in the RSI indicator, suggesting a continuation of the bearish momentum. 📌It is expected that the price will pull back to the base of the Wyckoff breakdown zone, which aligns precisely with a supply area, and then resume its downward movement. 📌 Finally, the price is likely to reach a valid demand zone, as illustrated, where we may observe a bullish reaction. ⚠️ All published content reflects the analyst’s opinion only and does not constitute any financial or investment advice. Feel Free to share your thought and comments on this post 😊 Sincerely, Hossein PoursaeiShortby Nexi-Market0
Market DNA Copper Cycle 4 Fractal 2 ObservationTitle: Market DNA – Cycle4 Fractal 2 Structural Observation Sub-title: Multi-Asset Structural Progression (Fractal 1 → 2 → 3) Metadata: • Date: 2026-06-26 10:45 EST • Assets: Copper (Copper) • Cycle IDs: 4 1- Context This document presents a structural observation across multiple Market DNA cycles. The analysis is based on previously published and time-stamped cycle records, tracking their progression from Fractal 1 through Fractal X. 2- Observation Summary • Multiple assets analyzed • Multiple cycles tracked • Consistent structural progression observed • Fractal 1 structures were previously defined and published. • Fractal 2 completion observed across cycles. • Fractal 3 currently approaching completion across multiple assets. • Completion tends to occur within or near the trapezoidal time window. 3- Fractal Cycle Evolution (F1 → F2 → F3) Observed Evolution: Fractal 1 → Initial structural encoding of the cycle (M–P(c) definition and initial boundary formation). Fractal 2 → Structural development and interaction within defined boundaries. Fractal 3 → Activation window for structural release and completion of the primary cycle. 4- Hypothesis Fractal 3 may represent a dominant structural activation window where accumulated time-pressure and structural interactions lead to directional release and cycle completion. 5- Status This is an ongoing observation and not yet a validated law. Further documentation and additional samples are required. 6- Cross-Asset Observation Across all analyzed assets, Fractal 3 structures show consistent alignment in both price interaction and time progression. Completion tends to occur within a bounded time window, with limited deviation. 7- Key Insight Fractal 3 appears to act as a structural activation window, where accumulated field pressure and temporal distortion (time bending) interact and resolve through accelerated price movement. 8- Conclusion Current observations indicate a consistent structural behavior across multiple Market DNA cycles, where Fractal 3 functions as a critical activation and completion layer. Multiple instances have now been documented. Further validation is required to determine whether this behavior represents a general structural principle. 9- Disclaimer This document is part of the Market DNA structural market research framework. It does not constitute financial advice. by alimalek19780
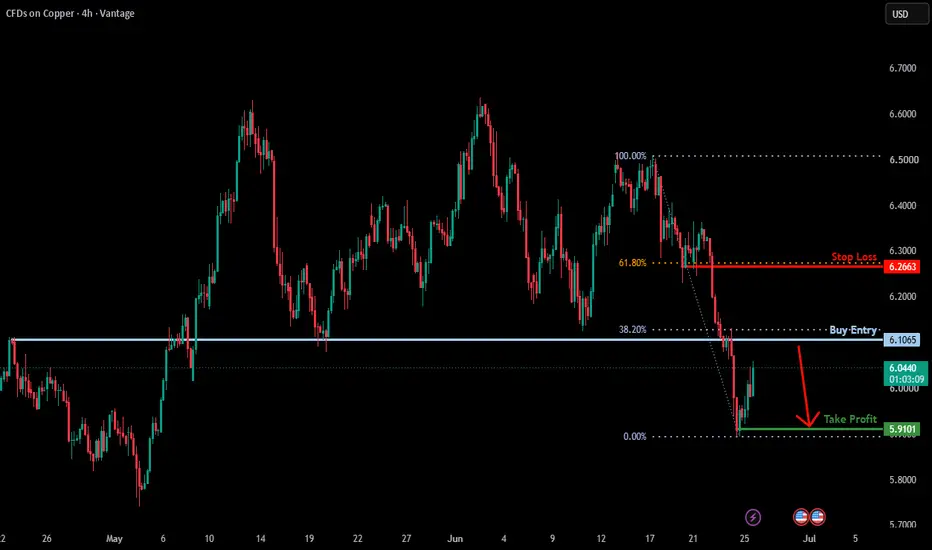
Bearish continuation setup?COPPER is rising towards the resistance level, which has been identified as an overlap resistance that aligns with the 38.2% Fibonacci retracement and could reverse from this level to our take profit. Entry: 6.1065 Why we like it: There is an overlap resistance level that aligns with the 38.2% Fibonacci retracement. Stop loss: 6.2663 Why we like it: There is a pullback resistance level that aligns with the 61.8% Fibonacci retracement. Take profit: 5.9191 Why we like it: There is a pullback support level. Enjoying your TradingView experience? Review us! Please be advised that the information presented on TradingView is provided to Vantage (‘Vantage Global Limited’, ‘we’) by a third-party provider (‘Everest Fortune Group’). Please be reminded that you are solely responsible for the trading decisions on your account. There is a very high degree of risk involved in trading. Any information and/or content is intended entirely for research, educational and informational purposes only and does not constitute investment or consultation advice or investment strategy. The information is not tailored to the investment needs of any specific person and therefore does not involve a consideration of any of the investment objectives, financial situation or needs of any viewer that may receive it. Kindly also note that past performance is not a reliable indicator of future results. Actual results may differ materially from those anticipated in forward-looking or past performance statements. We assume no liability as to the accuracy or completeness of any of the information and/or content provided herein and the Company cannot be held responsible for any omission, mistake nor for any loss or damage including without limitation to any loss of profit which may arise from reliance on any information supplied by Everest Fortune Group.Shortby Vantage4
CopperXCUUSD - Bearish Channel as an corrective pattern in Short Time Frame - Break of Structure - Order Block - Completed " 123 " Impulsive Waves - Point of Interestby ForexDetective2
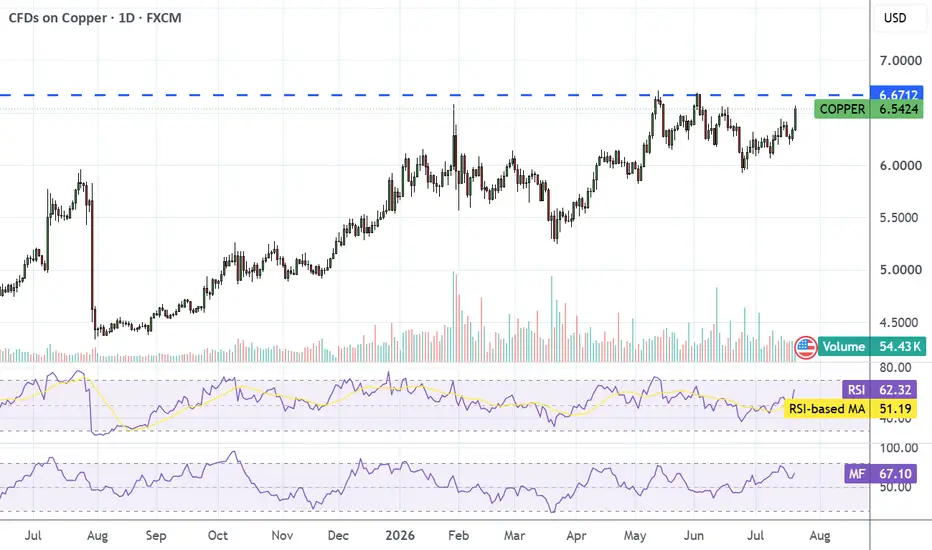
Copper bulls on notice beneath 50DMACopper has spent the past month compressing following the failed breakout above $6.73 a pound. Lower highs have emerged, but higher lows continue to print, leaving price action looking a lot less directional than it did earlier in the quarter. The 50-day moving average has been an important support level since April, repeatedly rejecting bearish probes. With copper now trading below the level and on track for its first close beneath it since the April breakout, it's another sign that the bullish trend may be vulnerable to a larger pullback. RSI(14) has been setting lower highs since early June while MACD has crossed below its signal line and is threatening to move into negative territory. Together, they suggest upside momentum has faded and downside risks may be starting to build. If copper were to close beneath the 50-day moving average, one setup to consider would be initiating shorts below the level with a tight stop above. The bearish case would be strengthened further if the market were to subsequently retest the 50DMA and fail, potentially opening the door for a move towards $6.20 a pound initially. Should $6.20 give way, it would be a more significant development, bringing the 100-day moving average and $6.04 a pound into play. The latter acted as both support and resistance earlier this year. However, given the recent history at the 50-day moving average, if copper were to reverse back above the level and close there, it would create a potential long setup. Positions could be initiated with a tight stop beneath the 50DMA, targeting $6.50 and $6.60 a pound, with the latter capping gains on several occasions earlier this month. Given the strong advance that preceded the recent consolidation, a topside break would also be consistent with the broader bullish trend remaining intact. Good luck! DSby FOREX.com3
Copper (XCUUSD) | Consolidation Before Expansion?🟠 Copper (XCUUSD) | Consolidation Before Expansion? Long-Term Opportunity Under the Surface Hello to all TradingView followers 👋❤️ Hope markets are treating you well and your trades stay disciplined and patient. Today let’s take a closer look at Copper (XCUUSD) — one of the most important industrial commodities globally and an asset that many investors consider a long-term macro opportunity. 📊⚡ 🏗 Why Copper Matters — The Long-Term Value Story Copper is often called “the metal of economic growth” because of how deeply it is connected to global development and industrial activity. Its demand continues to be supported by: ⚡ Expansion of renewable energy infrastructure 🚗 Growth of electric vehicles 🏭 Industrial production and manufacturing 🏗 Urbanization and construction projects worldwide 🔋 Energy transition and electrification trends Because of these structural themes, copper remains one of the commodities with strong long-term investment interest whenever accumulation phases appear. 📈 Technical Analysis — Uptrend Still Intact, But Momentum Is Compressing Looking directly at the chart structure: Price has been moving inside a clear bullish trend for an extended period while respecting the rising dynamic support line very well. 🟢 However, over the last sessions the market behavior has changed. Instead of continuing impulsively higher, price has transitioned into a 4H range structure, creating a visible consolidation zone between support and resistance. 📌 This type of behavior often appears when: ✔ Market participants absorb liquidity ✔ Larger orders get filled ✔ Momentum resets before the next expansion phase At this stage, the chart suggests the market may be entering an order-filling / consolidation phase rather than immediate trend continuation. 🟡 Bullish Scenario — Breakout for Long-Term Long Positions If buyers manage to: ✅ Hold above dynamic support ✅ Break the upper resistance zone ✅ Confirm acceptance above the range structure then the probability of continuation toward higher levels increases. In that scenario, a confirmed breakout could become an attractive trigger for long-term long positioning rather than anticipating the move too early. 🚀📈 Patience around confirmation may provide better structure than chasing inside consolidation. 🔴 Alternative Scenario — Range Continues We should not ignore the possibility that: ⚠ Price remains trapped inside the consolidation zone ⚠ Multiple failed breakouts occur ⚠ Temporary downside liquidity sweeps appear before expansion As long as support remains respected, the broader bullish structure still remains constructive. 🧠 Market View 📌 Long-term bias: Bullish 🟢 📌 Short-term structure: Range / Consolidation 🟡 📌 Preferred execution: Wait for confirmation above resistance 📊 Poll What’s your next expectation for Copper? 🟢 Breakout → Long continuation 🟡 More consolidation inside range 🔴 Temporary correction before expansion Vote below 👇 ⚠️ Disclaimer This analysis is shared for educational and informational purposes only and does not constitute financial advice or a recommendation to buy or sell any asset. Always manage risk and build your own trading plan. #Copper #XCUUSD #Commodities #TechnicalAnalysis #PriceAction #TradingView #Investing #LongTermInvesting #SwingTrading #CommoditiesTrading #SupportAndResistance #Bullish #MarketAnalysis #CopperMarket #TradingIdeasLongby forexcitypro_leemeenal7
CopperXCUUSD - Sell Side Liquidity - Equal High - Completed " 12345 " Impulsive Waves and " A " Corrective Waves - Fair Value Gap - Demand Zoneby ForexDetective2
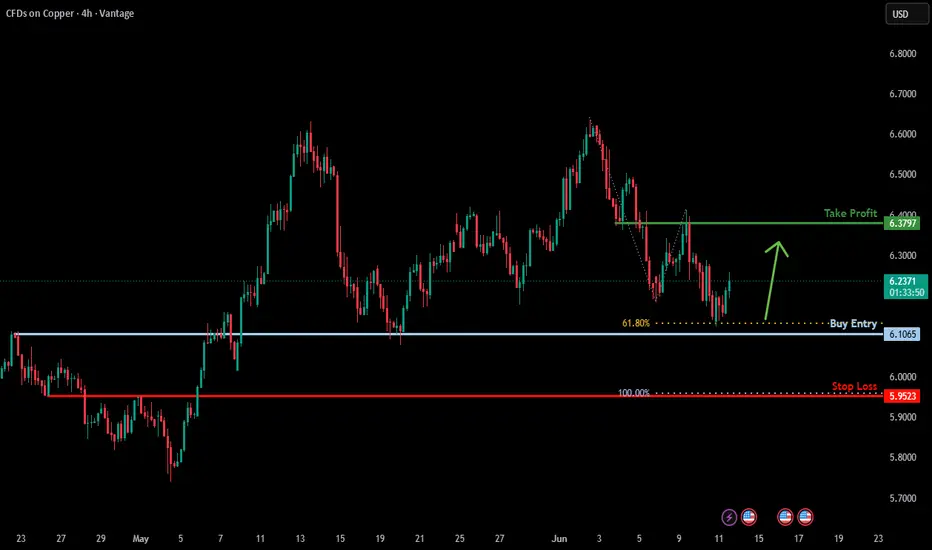
Bullish bounce off key support?Copper is falling towards the support level, which is an overlap support that aligns with the 61.8% Fibonacci projection and could bounce from this level to our take profit. Entry: 6.1065 Why we like it: There is an overlap support that aligns with the 61.8% Fibonacci projection. Stop loss: 5.9523 Why we like it: There is an overlap support level that aligns with the 100% Fibonacci projection. Take profit: 6.3797 Why we like it: There is an overlap resistance level. Enjoying your TradingView experience? Review us! Please be advised that the information presented on TradingView is provided to Vantage (‘Vantage Global Limited’, ‘we’) by a third-party provider (‘Everest Fortune Group’). Please be reminded that you are solely responsible for the trading decisions on your account. There is a very high degree of risk involved in trading. Any information and/or content is intended entirely for research, educational and informational purposes only and does not constitute investment or consultation advice or investment strategy. The information is not tailored to the investment needs of any specific person and therefore does not involve a consideration of any of the investment objectives, financial situation or needs of any viewer that may receive it. Kindly also note that past performance is not a reliable indicator of future results. Actual results may differ materially from those anticipated in forward-looking or past performance statements. We assume no liability as to the accuracy or completeness of any of the information and/or content provided herein and the Company cannot be held responsible for any omission, mistake nor for any loss or damage including without limitation to any loss of profit which may arise from reliance on any information supplied by Everest Fortune Group.Longby VantageUpdated 4
Copper: Generational 5-Year Macro Base PullbackThe Setup: Copper ( CAPITALCOM:XCUUSD ) is flashing a generational macro setup after officially breaking out of a massive 5-year base spanning from 2021 to 2026 . After clearing this 54-month accumulation zone, the commodity is now serving up its very first 4-month pullback . On the shorter timeframes, this pullback has formed a clean Cup and Handle breakout and structural retest , with price actively bouncing off the old macro resistance ceiling. This possesses the multi-year technical juice required to fuel a sustained 2-year trend. Tip: Use AMEX:CPXR for 2x leveraged exposure. Reasoning: 5-Year Macro Breakout (54 months of stored energy resolving upward) First 4-Month Pullback (Historically the highest-probability entry point after a macro shift) Structural Retest & Bounce (Old ceiling converting flawlessly into new floor) Cup and Handle Trigger (Shorter timeframe execution signal) Leverage Option: AMEX:CPXR (2x ETF) Longby vssebuyungo2