Episode 12 — The Complete Market Cycle# 🎬 The Chronicles of Mr. Nobody
## Season I — The History of the Elliott Wave Principle
### Episode 12 — The Complete Market Cycle
⏱️ **Reading Time: 3 minutes**
In the previous episode, we explored how a motive wave can appear more complex than a simple five-wave pattern. We learned that under
Key stats
Fund info
Home page
Inception date
Apr 29, 2026
Structure
Debt Security
Replication method
Physical
Dividend treatment
Distributes
Primary advisor
Leverage Shares Management Co. Ltd.
ISIN
XS3337192234
FIGI
BBG0227G0L85
Identifiers
ISIN XS3337192234
IncomeShares Oracle (ORCL) Options ETP dynamically allocates between directly investing in Oracle shares and selling put options on ORCL, capturing intrinsic and extrinsic value.
Classification
What's in the fund
Exposure type
Technology Services
Cash
Breakdown by region
Top 10 holdings
DRM3 — 1H | REVERSAL BREAKOUT SETUPDRM3 is starting to look interesting after an absolutely savage reset from the June highs.
The ETP ran as high as **$24.10** before sellers took complete control. Since then, the tape has been a textbook sequence of **lower highs + lower lows**, with every relief rally getting sold and price eventu
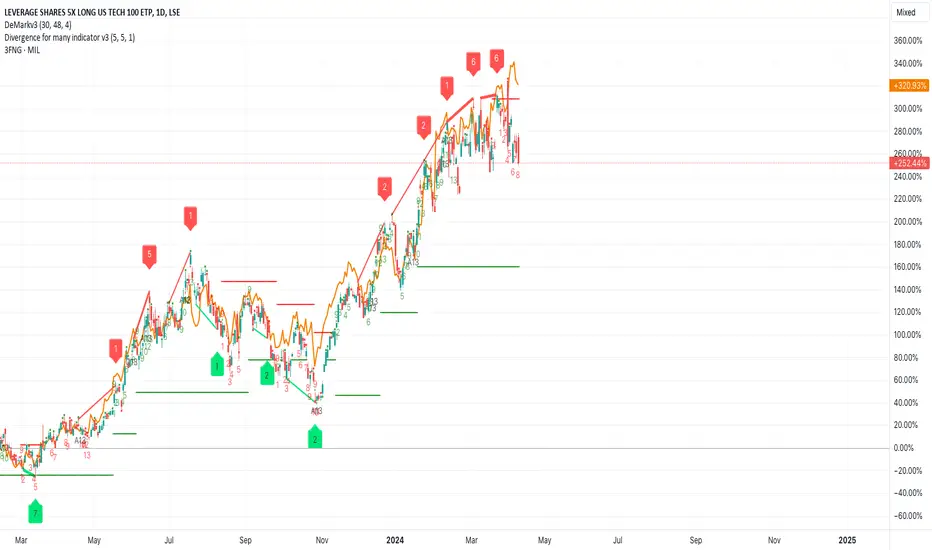
#3NVD Leveraged 3x Long with Nvidia Corporation StocksAll the World chipmakers are on the rush this night, due to Nvidia ( NASDAQ:NVDA ) Q1'23 Earnings Report.
LSE:3NVD is the Leverage Shares 3x Nvidia ETP Securities that seeks to track the iSTOXX Leveraged 3x Nvidia Index, which is designed to provide 3x the daily return of Nvidia stock, adjus
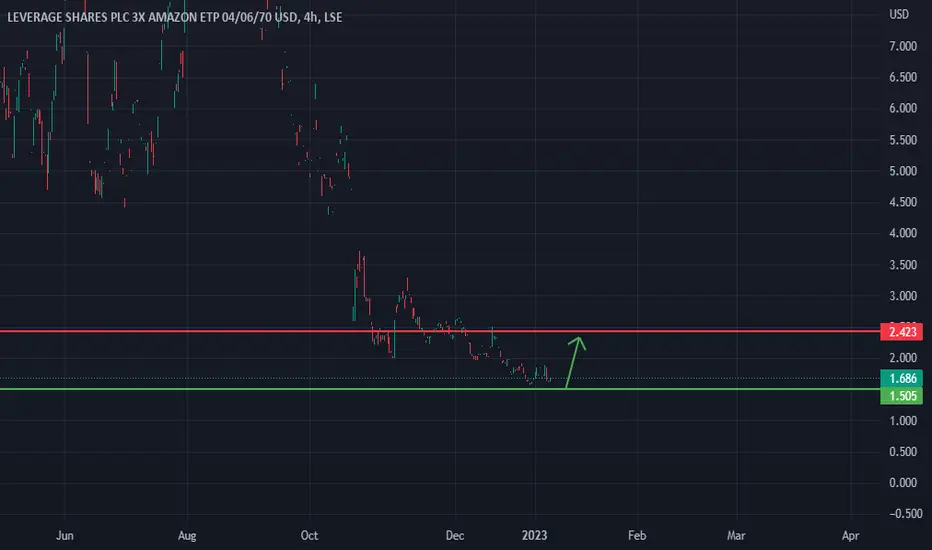
Amazon 3x Shares, Long OpportunityHi Traders, I hope you're all killing it in the markets, I'm looking at a potential long opportunity here on AMZ3. I am looking to capitalise on a what I believe to be a probable support area at the 1.5 significant number. This not purely a TA based trade, I have looked at Amazon from a fundamental
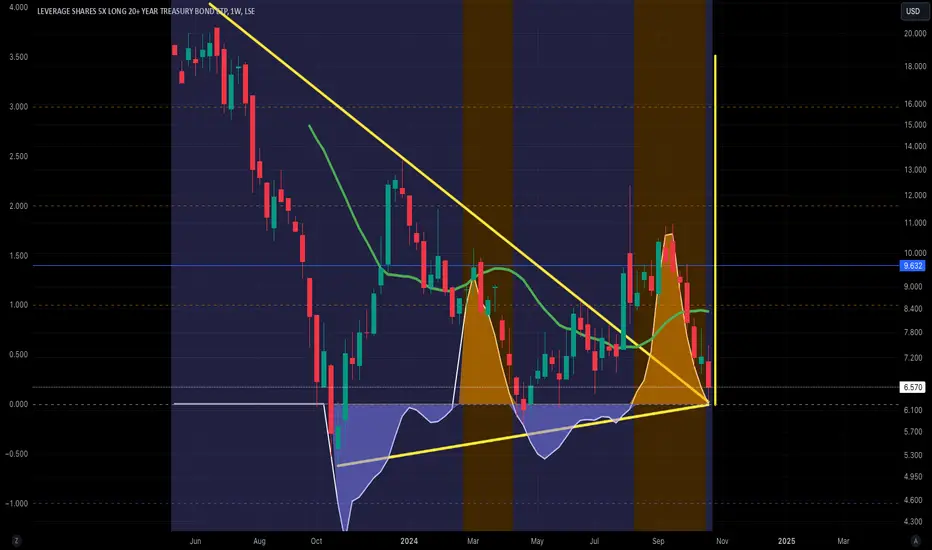
-3x Short ARKK ETP -> Santa Claus RallyGet on the sled of Santa Claus for your end of year rally. Take a look at Cathie Wood her picks in the ARKK ETF one more time and decide for yourself.
SARK has made some gains the past weeks, but now it's time to leverage this baby.
Buy in: 6.4 - 6.7
Target: 10.00
Stop-loss: 5.5
Not financial
I wish this fund would be made available on a US exchange.AAP3 is an absolutely wonderful investment opportunity. I just can't get in on it because I live in the US. Hopefully, this fund will be expanded to the US market. Those who live in the UK have a marvelous chance to make some very serious gains.
See all ideas
Summarizing what the indicators are suggesting.
Oscillators
Neutral
Oscillators
Neutral
Summary
Neutral
Summary
Neutral
Summary
Neutral
Moving Averages
Neutral
Moving Averages
Neutral
Frequently asked questions
An exchange-traded fund (ETF) is an investment product that holds a basket of assets such as stocks, bonds, futures, or other instruments, and trades on an exchange like a regular stock.
Why investors use ETFs:
– Easy way to gain exposure to sectors like stocks, bonds, real estate, or crypto
– Lower barrier to entry compared to buying individual assets
– Can help reduce volatility through diversification
Explore the largest ETFs: they are considered the most trusted and secure and will help you start your journey on the ETF markets.
Why investors use ETFs:
– Easy way to gain exposure to sectors like stocks, bonds, real estate, or crypto
– Lower barrier to entry compared to buying individual assets
– Can help reduce volatility through diversification
Explore the largest ETFs: they are considered the most trusted and secure and will help you start your journey on the ETF markets.
Markets don't sleep, here's what's going on with ORAI at the moment:
– REG - Leverage Shares PLC Leverage 3XLong Ant$ Leverage 3XLong Ant£ Leverage 3XLong Ant€ - Notification of New Series - 3x Anthropic
– REG - Leverage Shares PLC Leverage 3XLong Ant$ Leverage 3XLong Ant£ Leverage 3XLong Ant€ - Market Notification - 3x Anthropic -Cash Portfolio
– IncomeShares Monthly Investor Update – October 2026
See more updates in real-time with our News Flow.
– REG - Leverage Shares PLC Leverage 3XLong Ant$ Leverage 3XLong Ant£ Leverage 3XLong Ant€ - Notification of New Series - 3x Anthropic
– REG - Leverage Shares PLC Leverage 3XLong Ant$ Leverage 3XLong Ant£ Leverage 3XLong Ant€ - Market Notification - 3x Anthropic -Cash Portfolio
– IncomeShares Monthly Investor Update – October 2026
See more updates in real-time with our News Flow.
ORAI net asset value (NAV) is 4.13 EUR. It represents the total value of the fund's assets less liabilities.
Other key metrics:
– ORAI AUM — 374.03 K EUR
– ORAI discount/premium to NAV — 0.40%
– ORAI expense ratio — 1.10%
Explore more funds in our list of largest ETFs.
Other key metrics:
– ORAI AUM — 374.03 K EUR
– ORAI discount/premium to NAV — 0.40%
– ORAI expense ratio — 1.10%
Explore more funds in our list of largest ETFs.
To put today's price into context, compare ORAI's performance across different time periods:
– 1 day — −2.42%
– 1 week — +5.82%
– 1 month — −18.37%
ORAI's all-time low was 3.6684 EUR on Nov 5, 2026, while its all-time high was 10.4290 EUR on Jun 1, 2026.
For a deeper look at market activity, explore the ETF Heatmap and the ORAI price chart.
– 1 day — −2.42%
– 1 week — +5.82%
– 1 month — −18.37%
ORAI's all-time low was 3.6684 EUR on Nov 5, 2026, while its all-time high was 10.4290 EUR on Jun 1, 2026.
For a deeper look at market activity, explore the ETF Heatmap and the ORAI price chart.
The safest way to buy ORAI is through a reliable broker. Create an account, fund it, and place a buy order.
You can trade ORAI directly from TradingView:
– Choose a broker: Explore our supported trading partners and pick one that fits your needs
– Compare options: View available brokers side by side to evaluate fees and features
– Connect your account: Open Supercharts, click “Trade”, select your exchange, and log in
– Start trading: Place orders directly from the chart
Tip: If you’re new to trading, try paper trading first — it lets you practice strategies in real market conditions without risking funds.
You can trade ORAI directly from TradingView:
– Choose a broker: Explore our supported trading partners and pick one that fits your needs
– Compare options: View available brokers side by side to evaluate fees and features
– Connect your account: Open Supercharts, click “Trade”, select your exchange, and log in
– Start trading: Place orders directly from the chart
Tip: If you’re new to trading, try paper trading first — it lets you practice strategies in real market conditions without risking funds.
IncomeShares Oracle (ORCL) Options ETP expense ratio is 1.10%. It represents the annual cost of managing the fund, expressed as a percentage of its assets.
Other key metrics:
– ORAI AUM — 374.03 K EUR
– ORAI NAV — 4.13 EUR
– ORAI discount/premium to NAV — 0.40%
Explore more ETFs with highest expense ratio and find even more stats in the ETF Screener.
Other key metrics:
– ORAI AUM — 374.03 K EUR
– ORAI NAV — 4.13 EUR
– ORAI discount/premium to NAV — 0.40%
Explore more ETFs with highest expense ratio and find even more stats in the ETF Screener.
ORAI trades at a premium (0.40%).
Premium/discount to net asset value (NAV) expresses the difference between the ETF's price and its NAV value.
– A positive percentage indicates a premium, meaning the fund trades at a higher price than the calculated NAV.
– A negative percentage indicates a discount, suggesting the ETF trades at a lower price than NAV.
You can find more funds in the list of highest premium to NAV.
Premium/discount to net asset value (NAV) expresses the difference between the ETF's price and its NAV value.
– A positive percentage indicates a premium, meaning the fund trades at a higher price than the calculated NAV.
– A negative percentage indicates a discount, suggesting the ETF trades at a lower price than NAV.
You can find more funds in the list of highest premium to NAV.
The fund's management style is active, meaning its holdings are selected and adjusted at the manager’s discretion to try to outperform the market.
What it means:
– Active selection: Managers choose securities based on research and market outlook
– Flexible allocation: Holdings can change frequently in response to opportunities or risks
– Goal: Beat a benchmark index rather than track it
Combine this knowledge with other metrics:
– ORAI AUM — 374.03 K EUR
– ORAI NAV — 4.13 EUR
– ORAI expense ratio — 1.10%
Explore more details in the Profile section and follow more actively managed funds on TradingView.
What it means:
– Active selection: Managers choose securities based on research and market outlook
– Flexible allocation: Holdings can change frequently in response to opportunities or risks
– Goal: Beat a benchmark index rather than track it
Combine this knowledge with other metrics:
– ORAI AUM — 374.03 K EUR
– ORAI NAV — 4.13 EUR
– ORAI expense ratio — 1.10%
Explore more details in the Profile section and follow more actively managed funds on TradingView.
Today, ORAI trades at 4.0416 EUR.
For broader market analysis, dive into the technicals on the ORAI price chart and read the latest ORAI news:
– REG - Leverage Shares PLC Leverage 3XLong Ant$ Leverage 3XLong Ant£ Leverage 3XLong Ant€ - Notification of New Series - 3x Anthropic
– REG - Leverage Shares PLC Leverage 3XLong Ant$ Leverage 3XLong Ant£ Leverage 3XLong Ant€ - Market Notification - 3x Anthropic -Cash Portfolio
– IncomeShares Monthly Investor Update – October 2026
For broader market analysis, dive into the technicals on the ORAI price chart and read the latest ORAI news:
– REG - Leverage Shares PLC Leverage 3XLong Ant$ Leverage 3XLong Ant£ Leverage 3XLong Ant€ - Notification of New Series - 3x Anthropic
– REG - Leverage Shares PLC Leverage 3XLong Ant$ Leverage 3XLong Ant£ Leverage 3XLong Ant€ - Market Notification - 3x Anthropic -Cash Portfolio
– IncomeShares Monthly Investor Update – October 2026
ORAI assets under management (AUM) is 374.03 K EUR. It represents the total market value of all assets held by the fund.
Other key metrics:
– ORAI NAV — 4.13 EUR
– ORAI expense ratio — 1.10%
– ORAI premium/discount to NAV — 0.40%
Explore more funds in our list of largest ETFs. For deeper analysis, check the ETF Screener.
Other key metrics:
– ORAI NAV — 4.13 EUR
– ORAI expense ratio — 1.10%
– ORAI premium/discount to NAV — 0.40%
Explore more funds in our list of largest ETFs. For deeper analysis, check the ETF Screener.
ORAI fund flows account for 448.66 K EUR, showing the net amount of money entering or leaving the fund over 1 year. Many traders use it to get insight into investors' sentiment and evaluate whether it's time to buy or sell the fund.
Other key metrics:
– ORAI AUM — 374.03 K EUR
– ORAI discount/premium to NAV — 0.40%
– ORAI expense ratio — 1.10%
For broader market analysis, read the latest market news and read the ETF trading ideas.
Other key metrics:
– ORAI AUM — 374.03 K EUR
– ORAI discount/premium to NAV — 0.40%
– ORAI expense ratio — 1.10%
For broader market analysis, read the latest market news and read the ETF trading ideas.
ORAI invests in cash. See more details in our Profile section.
No, ORAI isn't leveraged, meaning it doesn't use borrowings or financial derivatives to magnify the performance of the underlying assets or index it follows.
ORAI shares are issued by Leverage Shares LLC.
ORAI started trading on Apr 29, 2026. The launch date marks the fund's first day on the exchange and the start of its publicly available price history.
The age of a fund can be useful when evaluating its track record, as older funds typically provide more historical data for analyzing performance across different market conditions.