XMR / USDT Holding Strong Above Key Level — $348 Target in FocusXMR / USDT is showing a strong structure and gaining momentum above our key support level. As long as price remains above this zone, there is a high probability of a bullish rally toward the $348 target. Any confirmed breakdown below the key level will weaken the bullish outlook. Manage risk wisely, and always do your own research before entering any trade. 🚀📊
In-depth trading ideas
XMR: local squeeze with $406.84 destinationThe Macro Picture 🗺️
XMR based through late June, then staged a steady V-recovery off the lows back to $350.94, reclaiming ground above the $318.81 local low. The trend has flipped from the June flush to a firm reclaim — buyers in control and pressing toward the range top.
The Setup ⚙️
The Range Floor 🟢
$318.81 (Local Low) is the near demand shelf holding the recovery, with $292.08 (Macro Support) as the deeper structural base. As long as $318.81 holds on pullbacks, the bid stays intact.
The Decision Point 🔴
$382.82 (Local High) is the gate. A daily close above it clears the last local resistance and opens the path to the $406.84 measured-move target.
The Roadmap 🛣️
Hold above $318.81 → break $382.82 → run toward $406.84. Invalidation is a clean daily close below $318.81 — that stalls the recovery.
This is a GRID Range Play: a defined band to rotate, buying pullbacks toward the floor and scaling out into the breakout.
#XMR #Monero #crypto #trading #TA #3Commas #GRID
XMR Trades Within Key RangeMonero (XMR) is currently trading around its Point of Control (POC), the price level that has attracted the highest trading volume within the current range. While this level is acting as an important area of balance between buyers and sellers, the broader market continues to trade within a well-defined high-timeframe range between $261 and $465.
From a technical perspective, the Point of Control is a critical level to monitor. If XMR loses this support on a closing basis, the probability increases for a rotational move toward the range low around $261, where buyers will need to defend the broader structure. A retest of the lower boundary would still be consistent with the current range-bound environment rather than a confirmed bearish breakdown.
As long as the range low continues to hold, the broader outlook remains constructive. A bullish reaction from this support would increase the probability of another rotational move toward the $465 range high, continuing the established pattern of price moving between the outer boundaries of the trading range.
For now, Monero remains in a consolidation phase rather than a trending market. Traders should closely monitor the reaction around the Point of Control and, if tested, the $261 support, as these levels are likely to determine whether XMR resumes its rotation toward higher prices or extends its corrective move within the broader range.
XMR: Initial Resistance Continues to Cap the BullsMonthly Support Holding
Monero continues to base around the $300 support zone, with buyers repeatedly stepping in to defend this important area. The repeated reactions suggest demand remains healthy, although the recovery is still lacking strong follow-through.
Bearish Moving Average Structure
The 100/50-day EMAs remain bearishly crossed, with price continuing to trade beneath both moving averages. Until those averages are reclaimed, the broader daily trend remains tilted in the bears' favour.
Resistance Still the Key Hurdle
Price has now been rejected four successive times around the $335 resistance area, while continuing to print a series of lower highs. A decisive break above $335 would improve the short-term outlook and bring the next resistance around $380 back into focus.
Momentum Remains Neutral
Volume continues to decline as price stalls beneath resistance, while the RSI remains around the 50 level and the StochRSI continues to work off overbought conditions. This suggests momentum remains balanced as the market waits for a breakout in either direction.
Summary
Monero continues to defend the key $300 support zone, but the bears retain the upper hand while price remains beneath the bearishly crossed 100/50-day EMAs and the $335 resistance area. A break above $335 would be the first meaningful sign of improving strength, while continued rejection would keep the recent pattern of lower highs intact.
XMRUSDT SHORTInstructions:
Entry point: yellow
Stop loss: red
Take profit: green
👉Leverage x 5-10-20 for crypto
👉Leverage x 20-50-100 for commodities, stocks, indices, and forex
👉Margin 1-5% max.
Always practice risk and money management.
Invest a maximum of 5% on any trade or across all your trades.
Invest only what you can afford to lose, as no one is in control of the market.
👉Our analyses are primarily based on:
breakouts: two trend lines (ascending and descending) and a line indicating a horizontal breakout.
chart patterns: shoulders and head, triangle parttern, elliott impulse, etc etc.
We don't always have the time to track them at all times or to represent them visibly, given the numerous signals, the number of channels to manage, and especially because of the often rapid pace of market movements.
indicators: We associate at least two indicators with this technique.
👉Depending on the circumstances, we use specific indicators, often setting 3 or more take profit levels.
👉Indeed, there are good days in trading and also bad days. No one can promise to win every trade, and like all traders worldwide, we also experience stop-loss orders. However, we win more than we lose and remain positive.
👉You can close the position before or after the take profit orders indicated by the green lines if you are personally satisfied; the same applies to stop loss orders.
👉We must stay positive, clear-headed, and humble.
we cannot provide all instructions or all trades here on this channel.
Good luck to us all, and may God guide us. Amen
XMR: liquidity sweep before recovery toward $380The Macro Picture 🗺️
XMR spent May distributing under the $420 macro ceiling before rolling over into a sharp June flush that swept the $295 macro floor — a classic liquidity hunt that cleared out over-leveraged longs at the lows. Price has since reclaimed the $310 shelf and is now curling up from the $325 equilibrium, with RSI recovering back toward its midline. This is the structural reset the market needed: the weak hands are gone, the floor held, and the path of least resistance is tilting back toward the upper range.
The Setup ⚙️
The Reaction: The $295 macro support (solid green) absorbed the entire June capitulation and produced an immediate rejection higher. As long as daily closes hold above it, the recovery structure stays valid.
The Accumulation Zone: The $310–$325 band is a textbook pocket for staggered, averaging-based entries — price is basing here after the sweep, offering a mechanical way to build a position while the recovery confirms rather than chasing a single entry.
The Ceiling: The $380 local decision (red dashed) is the first real test. A reclaim there flips the broken structure and opens the door back toward the $420 macro shelf.
The Roadmap: Primary target sits at $380 — the green roadmap points toward a steady grind back into the range as buyers defend the reclaimed floor. Invalidation: a sustained 1D close below $295 would void the recovery and trigger sell stops toward a deeper leg down.
More setups in profile.
XMR — Make or Break StructureMonero has repeatedly failed to establish a higher high at the $303 resistance level, with volume gradually declining, indicating weakening bullish momentum and seller dominance at this zone.
The market structure continues to favor downside expansion, making the primary scenario a continuation of the bearish trend with sell-side positioning.
However, a short-term bullish deviation becomes valid only if price reclaims and holds above $316, confirming a structural shift and potential reversal of momentum.
Until that condition is met, rallies into resistance are considered distribution opportunities rather than trend continuation.
XMR USDT LONG SIGNALXMR /USDT – Trade Setup (LONG)
📈 Position Type: LONG
🕒 Timeframe: 1 H
📊 Market: Futures
💰 Entry Zone:
305.22
296.70
🛑 Stop-Loss:
290.77
🎯 Take-Profit Targets:
• TP1:315.75
• TP2: 324.78
• TP3: 332.94
• TP4: 340.52
TP5: 347.98
TP6: 354.82
⚙️ Leverage:
5- 3
⚠️ After reaching TP1, move Stop-Loss to Entry Price.
📌 Risk Management:
Risk only 1–2% of your capital per trade.
Always confirm the setup on your chart before entry
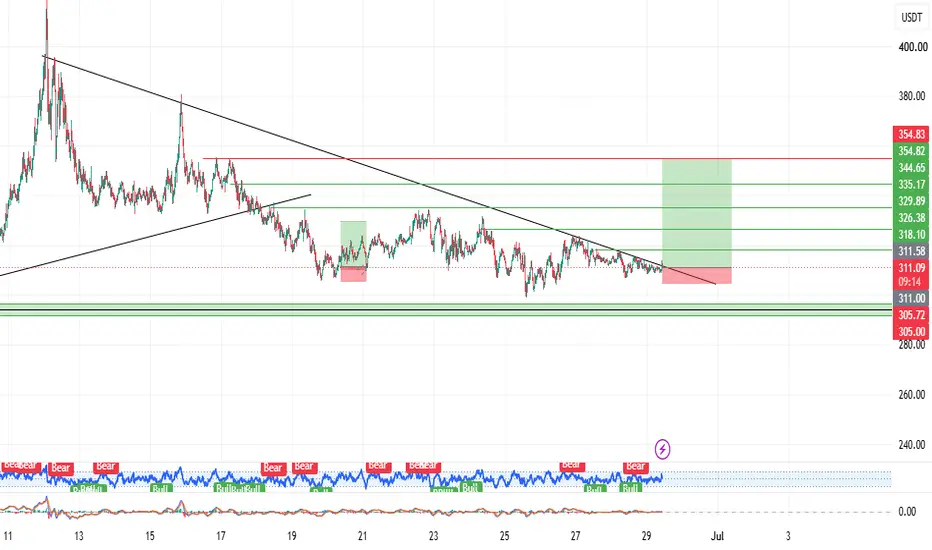
XMR USDT LONG SIGNALXMR/USDT – Trade Setup (LONG)
📈 Position Type: long
🕒 Timeframe: 1 H
📊 Market: Futures
💰 Entry Zone:
310.97
🛑 Stop-Loss:
305
🎯 Take-Profit Targets:
• TP1: 318.14
• TP2: 326.38
• TP3: 335.17
• TP4: 344.65
TP5: 354.82
TP6:
⚙️ Leverage:
5-10
⚠️ After reaching TP1, move Stop-Loss to Entry Price.
📌 Risk Management:
Risk only 1–2% of your capital per trade.
Always confirm the setup on your chart before entry
XMR at macro floor: bullish reversal toward $360The Macro Picture 🗺️
XMR has just printed its third defense of the macro floor in five months — and the structural fingerprints underneath are not the same. February's $285 wick came with RSI parked at 25, the early-June $300 flush printed RSI 35, and the late-June reaction at $290 held with RSI in the 40s. Each successive test has reached comparable price territory but with progressively shallower momentum exhaustion — a textbook bullish divergence pattern that signals sellers are running out of fresh supply at the floor. The broadening formation that defined the May–June chop is now compressing into a base, and the path of least resistance is starting to favor mean reversion back into the upper half of the range.
The Setup ⚙️
The Defense: The $285–$300 macro floor zone has now absorbed three separate liquidity hunts since January, with each test triggering a sharper recovery wick. This is the kind of triple-tag base where structural buyers reload after the over-leveraged side has been fully washed out.
The Divergence: RSI carved a higher low on the late-June flush despite price retesting comparable territory — the cleanest bullish divergence print of the cycle. Momentum is no longer confirming the downside, and the moving average has flattened beneath the 50 mid-line, the kind of basing signature that precedes structural reversals rather than continuations.
The Trigger: The $310 prior box floor sits as the immediate breakout shelf to clear. Bears are defending this level on every push, but trapping them above it would trigger buy stops layered into the $360 prior breakout shelf — the first meaningful overhead structural target.
The Roadmap: Primary target sits at $360 — the prior breakout shelf where bears have defended every bounce since the May rejection and the natural mean-reversion destination from the macro floor zone. Invalidation: a sustained 1D close below $285 would invalidate this bullish thesis and confirm the macro floor is breaking, opening the trapdoor toward the $250s.
XMR USDT LONG SIGNALXMR/USDT – Trade Setup (LONG)
📈 Position Type: LONG
🕒 Timeframe: 15M
📊 Market: Futures
💰 Entry Zone:
311.78
🛑 Stop-Loss:
305.63
🎯 Take-Profit Targets:
• TP1: 315.76
• TP2: 321.82
• TP3: 329.96
• TP4:
TP5:
⚙️ Leverage:
5–10
⚠️ After reaching TP1, move Stop-Loss to Entry Price.
📌 Risk Management:
Risk only 1–2% of your capital per trade.
Always confirm the setup on your chart before entry
XMR: liquidity sweep before bearish moveThe Macro Picture 🗺️
XMR is unwinding a textbook Broadening Formation — both extremes have been swept in the span of two weeks. The mid-June spike to $435 grabbed breakout-long liquidity above the May $425 ceiling, while the earlier $295 wick had already cleared the longs sitting under the prior box floor. With both sides of the volatility playground tagged, the structure is now bleeding back from the upper edge toward the lower boundary. RSI has slid from 70 down to the mid-40s with no buyer defense materializing, and the $285 macro floor remains untested by a daily close — leaving the downside path largely unblocked.
The Setup ⚙️
The Liquidity Grab: The single-candle spike to $435 swept the over-leveraged longs layered above the May high and was rejected the same session. This is the kind of wick that marks distribution, not continuation — and price has bled steadily since, confirming the level as a structural peak rather than a breakout.
The Rejection: The $390 prior support flip is now defended firmly as overhead resistance. Every bounce attempt since the spike has stalled beneath it, painting a clean sequence of lower highs that compresses price into the lower half of the broadening structure.
The Reaction: RSI has rolled to the mid-40s with momentum visibly draining and no bullish divergence in sight. As indicated by the white projection, the roadmap points toward a short-term chop near current levels followed by a clean breakdown leg into the swept floor.
The Roadmap: Primary target sits at $310 — the prior box floor that bulls failed to defend on the first sweep and the most obvious magnet on the downside. Invalidation: a sustained 1D close back above $390 would invalidate this bearish thesis and re-open the path toward the $425–$435 upper liquidity zone.
XMR: Large Bull Trap At ResistanceThe Breakout Didn't Last Long
• XMR briefly pushed above the May high at $438.36, suggesting bulls were finally ready to challenge higher levels.
• Instead, the breakout quickly failed and price was driven back below resistance, trapping late buyers.
A Classic Liquidity Sweep
• The spike to $475 swept liquidity above the previous highs before reversing sharply lower.
• These types of moves often occur when markets run stops before moving back in the opposite direction.
Sellers Returned Aggressively
• A significant increase in selling volume accompanied the rejection candle.
• Buying interest has been noticeably weaker since the sell-off, suggesting bulls have lost momentum.
The Moving Averages Remain Bearish
• The 100/50-day EMAs remain bearishly crossed, with price currently trading beneath both averages.
• Until those levels are reclaimed, the broader trend continues to favour the bears.
Momentum Remains Neutral
• RSI is hovering around the 50 level, reflecting a lack of clear directional control.
• StochRSI has rolled over from recent highs and continues to drift lower in mid-range territory.
Bulls Need To Reclaim Resistance
• The $438 area remains the key level to watch after the failed breakout attempt.
• A move back above that zone would improve sentiment, while failure increases the odds of another test of the recent lows.
In Summary
XMR appeared ready to break higher after pushing above the May highs, but the move quickly turned into a classic bull trap. The sharp rejection, heavy selling volume and bearish moving average structure all favour caution in the near term. While support continues to hold around the recent lows, bulls now have work to do after losing control at resistance. For now, the failed breakout remains the dominant feature of the chart.
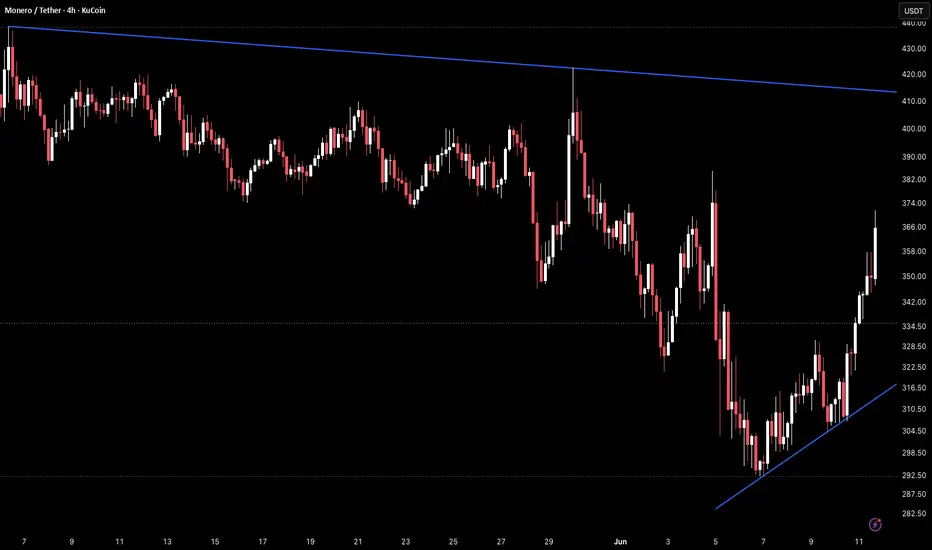
XMR 4H – Bounce Off Rising Trendline Into Key ResistanceXMR on the 4H timeframe is currently trading around 366 after a sharp sell-off from the May range near 390–420 that pushed price down to a low near 292 before buyers stepped in and produced a strong recovery.
Price has been bouncing off a rising trendline from the June lows and is now pressing directly into the 366–370 horizontal resistance zone that had been a consistent support level throughout the prior range and has now flipped to resistance.
The descending resistance trendline from the May highs near 440 is also sitting overhead near 410–420, creating a clear ceiling structure above.
Key Levels To Watch
440 → Prior high, descending resistance origin
410–420 → Descending resistance trendline, major overhead ceiling
390–400 → Prior range support, now resistance
366–370 → Horizontal resistance, current test
342–350 → Prior support, now minor support below
304–316 → Rising trendline support (dynamic, climbing)
Below 282 → Full structure breakdown
The rising trendline from the June lows has been producing higher lows since the bottom near 292 and is now climbing toward 304–316. The current push toward 366–370 is the first significant resistance test since the recovery began.
A clean break and close above 370 would clear this horizontal resistance and open room toward 390–400 and the next resistance zone below the descending trendline.
Failure to break above 366–370 and a pullback below 342–350 shifts focus back to the rising trendline near 304–316 as the next key support.
This is a key resistance test following a trendline bounce.
Break above 370 → resistance cleared, eyes on 390–400.
Reject at 366–370 → pullback toward trendline at 304–316.
Structure recovering above rising trendline.
Bias shifts bearish only on trendline breakdown below 304.
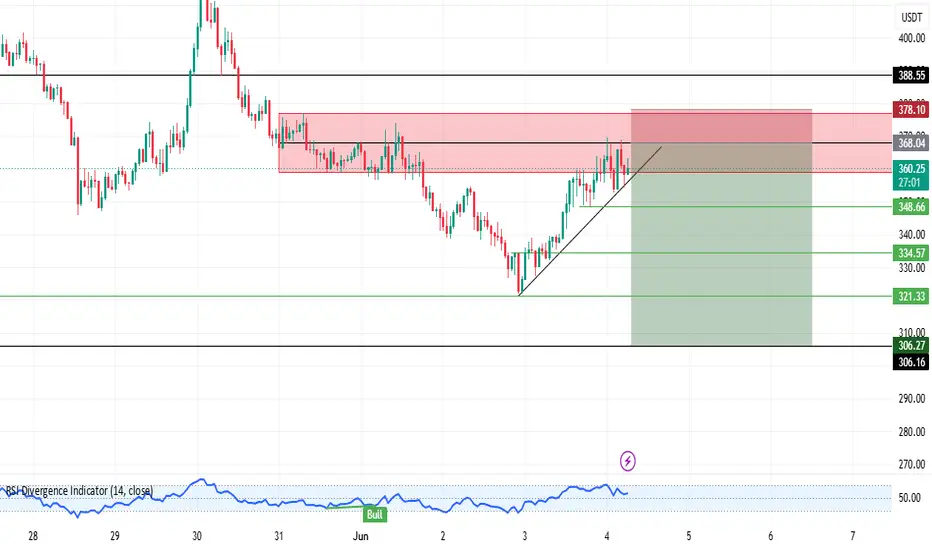
XMR USDT SHORT SIGNALXMR/USDT – Trade Setup (lshort)
📈 Position Type:long
🕒 Timeframe: 15M
📊 Market: Futures
💰 Entry Zone:
335.
🛑 Stop-Loss:
343.35
🎯 Take-Profit Targets:
• TP1: 317.13
• TP2: 304.08
• TP3: 294.09
• TP4: 275.35
. TP5: 257.86
⚙️ Leverage:
5–10
⚠️ After reaching TP1, move Stop-Loss to Entry Price.
📌 Risk Management:
Risk only 1–2% of your capital per trade.
Always confirm the setup on your chart before entry
Monero (XMR) price action remains bearish Monero (XMR) price action is currently trading around the important $300 psychological support level, a region that could play a major role in determining the next directional move. Following a strong rejection from the $424 resistance level, price has rotated lower and remains under pressure as sellers continue to defend the upper boundary of the current trading range.
The rejection from $424 is technically significant because it confirms that buyers were unable to generate enough momentum to break resistance and establish a new leg higher. Instead, the market has continued to respect the broader range structure, with price rotating from resistance back toward support.
As long as Monero remains below the $424 resistance zone, the overall short-term bias remains bearish. The current focus is on whether the $300 support level can hold and attract demand. A successful defense of this region could allow for another rotation within the existing range and potentially provide relief from the recent selling pressure.
However, failure to hold above $300 would significantly weaken the technical outlook. A confirmed breakdown below this support would increase the probability of a deeper corrective move toward the next major higher-timeframe support around $194.
For now, Monero remains vulnerable to further downside. The rejection from resistance and continued weakness around support suggest that the broader bearish trend remains intact unless buyers can reclaim control and invalidate the current market structure.
Monero/ Head & Shoulders patternHead and shoulders pattern may play out on Monero to the down side
The reasons being (weekly chart)
1.weekly trend brake
2.A nice retest to the left shoulder after the brake of trend
3.After the retest, price has gone back down below the base line of the head and shoulders
4 . Brake of structure
target prioce is measured from the top of the head to the baseline ,which shows a target level on the previous support around $130
Daily chart
1. currently retesting the baseline of the head and shoulders
XMR USDT LONG SIGNALXmr/USDT – Trade Setup (LONG)
📈 Position Type: LONG
🕒 Timeframe: 15M
📊 Market: Futures
💰 Entry Zone:
295.10
🛑 Stop-Loss:
291.20
🎯 Take-Profit Targets:
• TP1: 302.93
• TP2: 312.52
• TP3: 320
• TP4: 327.35
. TP5: 335
⚙️ Leverage:
15–10×
⚠️ After reaching TP1, move Stop-Loss to Entry Price.
📌 Risk Management:
Risk only 1–2% of your capital per trade.
Always confirm the setup on your chart before entry.
XMR: liquidity sweep before bullish moveThe Macro Picture 🗺️
After the May breakout failed at the $425 local high and structure crumbled through every defended level, XMR has been dragged back into the prior accumulation range and now sits just above the $285 macro floor. The recent flush wick into $300 swept the liquidity layered below the original $310 box low — a textbook liquidity hunt that punished both sides of the trade in a single session. With RSI parked in the 40s and the macro floor still untouched, the post-blow-off accumulation structure is reasserting itself rather than breaking down.
The Setup ⚙️
The Sweep: Price violently flushed into $300 and recovered the same session, clearing out over-leveraged longs from the May breakout while trapping breakout-short traders below the $310 box floor. This is exactly the kind of liquidity pocket needed before structure can rebuild.
The Reaction: RSI has slid into the 40s with momentum visibly draining, but no capitulation print on the daily — a structural reset rather than a trend-ending flush. Bulls are now defending the swept level, and the recovery wick on the flush candle reads as absorption, not panic.
The Trigger: The $360 prior breakout shelf sits as the immediate reclaim zone. Bears are defending this overhead level, and clearing them above it would trigger buy stops layered into the $390 prior support flip — opening the path of least resistance back into the upper half of the accumulation range.
The Roadmap: Primary target sits at $360 — a clean reclaim opens expansion toward the $390 prior support flip as the post-sweep recovery extends. Invalidation: a sustained 1D close below $300 would invalidate this bullish thesis and open the trapdoor toward the $285 macro floor test.
Monero Bearish Restest Indicates Lower Prices Monero (XMR) price action is showing increasing signs of weakness after multiple failed attempts to break through the key $410 resistance level. Despite several tests of this region, buyers have been unable to generate enough momentum to establish acceptance above resistance, resulting in repeated rejections and reinforcing the importance of this level.
From a market structure perspective, these rejections are significant because they suggest that sellers remain active whenever price approaches higher levels. The inability to break resistance has shifted momentum in favor of the bears and increased the likelihood of further downside rotation.
Adding to the bearish outlook, XMR has lost the value area high and has since rotated lower toward the value area low, completing a full auction within the current trading range. Price is now trading around the point of control, which represents the area of highest traded volume and often acts as a battleground between buyers and sellers.
At present, the overall structure remains bearish unless price can reclaim the lost resistance levels and re-establish acceptance above them. Failure to do so opens the probability of a deeper corrective move toward the $261 region, which represents a major support level within the broader trading range.
For now, Monero remains under pressure. The repeated rejections from resistance continue to favor the bears, making lower prices the higher-probability outcome in the immediate short term unless a significant shift in momentum occurs.
xmrusdt longInstructions:
Entry point: yellow
Stop loss: red
Take profit: green
👉Leverage x 5-10-20 for crypto
👉Leverage x 20-50-100 for commodities, stocks, indices, and forex
👉Margin 1-5% max.
Always practice risk and money management.
Invest a maximum of 5% on any trade or across all your trades.
Invest only what you can afford to lose, as no one is in control of the market.
👉Our analyses are primarily based on:
breakouts: two trend lines (ascending and descending) and a line indicating a horizontal breakout.
chart patterns: shoulders and head, triangle parttern, elliott impulse, etc etc.
We don't always have the time to track them at all times or to represent them visibly, given the numerous signals, the number of channels to manage, and especially because of the often rapid pace of market movements.
indicators: We associate at least two indicators with this technique.
👉Depending on the circumstances, we use specific indicators, often setting 3 or more take profit levels.
👉Indeed, there are good days in trading and also bad days. No one can promise to win every trade, and like all traders worldwide, we also experience stop-loss orders. However, we win more than we lose and remain positive.
👉You can close the position before or after the take profit orders indicated by the green lines if you are personally satisfied; the same applies to stop loss orders.
👉We must stay positive, clear-headed, and humble.
we cannot provide all instructions or all trades here on this channel.
Good luck to us all, and may God guide us. Amen.