XPDUSD H1: Hold 1,271.00 or Fall to 1,186.00?▪️ XPDUSD H1 SNAPSHOT — EXECUTIVE SUMMARY
▪️ Palladium trades near 1,228.77 in the belly of its range, with clear supply overhead and clear demand beneath. Neither side has forced the issue — structure is compressing.
▪️ Primary outlook is neutral — 1,271.00 is the hinge. Expect the range to resolve, not to persist forever; trade the edges until it breaks.
▪️ Key resistance zone: 1,271.00, leaned on 8 times. Beyond it, 1,306.50 is the next hurdle.
▪️ Major defense line: 1,186.00 — a moderate level at 12 retests, the shelf that anchors the whole structure.
▪️ Primary downside targets: 1,186.00, where liquidity and demand are stacked.
▪️ Major liquidity magnet below: 1,271.00–1,186.00 — this pocket is the downside draw on a break.
▪️ Bullish scenario: A daily close back above 1,271.00 re-opens the topside toward 1,306.50.
▪️ KEY LEVELS
▪️ Current Price: 1,228.77
RESISTANCEs
▪️ 1,306.50 — ★★★ 7.6 Strong · 6 retests
▪️ 1,271.00 — ★★★ 8.0 Strong · 8 retests
SUPPORTs
▪️ 1,186.00 — ★★ 6.2 Moderate · 12 retests
▪️ ProjectSyndicate Levels Desk — Overview of key S/R zones for metals, indices, NVDA, NQ, ES & GC traders every week. Subscribe to stay up to date with the latest levels.
In-depth trading ideas
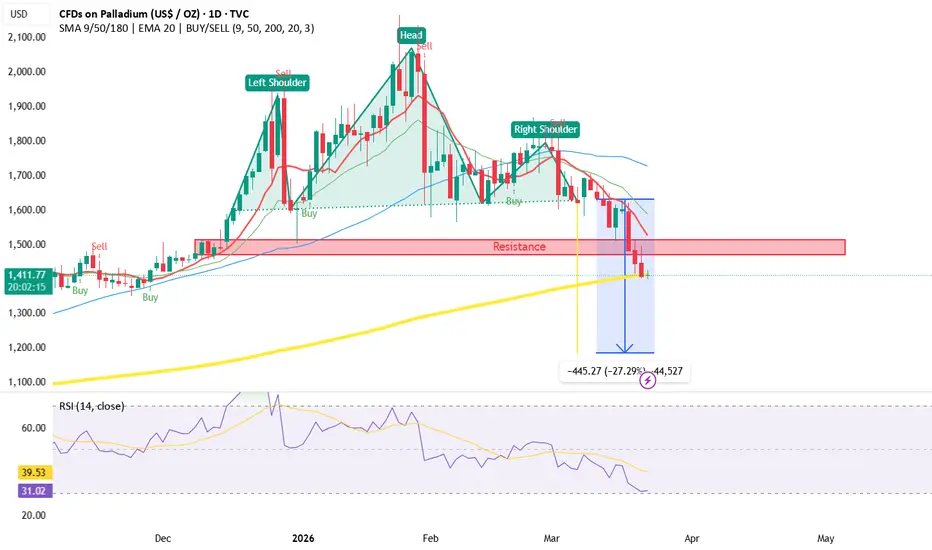
Palladium: Triangle Breakdown? A High-Probability Short SetupTo be honest, precious metals have been trading with relatively weak momentum lately. The entire sector remains under significant pressure, and in my view, the correction is not over yet. I still see room for further downside, not only in palladium but across the metals complex.
What I like most is the current technical setup in palladium. Price has been consolidating inside a triangle pattern, while remaining below both the 18-period and 50-period moving averages on the daily chart. As long as price stays below these moving averages, I consider the primary trend to remain bearish.
My expectation is for a downside breakout from this triangle, making the current setup one of the cleanest risk-to-reward opportunities among the precious metals.
The trading plan is straightforward: I'm looking for a short position, with a stop-loss above today's high at 1277 and an initial target around 1100.
Another reason I like this setup is the relatively tight stop-loss. It allows for efficient risk management while maintaining an attractive risk-to-reward ratio. Even if the trade doesn't work out, the predefined risk remains limited, which is exactly the kind of setup I prefer.
As always, manage your position size carefully, respect your stop-loss, and never risk more than you are comfortable losing.
Deep dive analysis on PalladiumCAPITALCOM:XPDUSD
In summary I go over all my support and resistance levels and what I think about the metals. In my humble opinion its starting to look attractive to buy at the support levels and were getting closer to the lows. What do you think? If you like leave a comment and boost/like the idea it would be much appreciated. I'm using the AMEX:PALL ETF to go long in my portfolio but for this instance I am using this chart to base my trade off of and to follow in the paper trading account were using.
XPDUSD: Trend in daily time frame (possible scenario)The color levels are very accurate levels of support and resistance in different time frames.
A strong move requires a correction to major support and we have to wait for their reaction in these areas.
So, Please pay special attention to the accurate trend, channel, colored levels, and you must know that SETUP is very sensitive.
BEST,
MT
Palladium Wave Analysis – 20 May 2026- Palladium reversed from support zone
- Likely to rise to resistance level 1450.00
Palladium recently reversed up from the support zone between the key support level 1350.00 (which has been reversing the price from October) and the lower daily Bollinger Band.
This support zone was further strengthened by the support trendline of the daily down channel from the start of April.
Given the strength of the support level 1350.00 and the oversold reading on the daily Stochastic indicator, Palladium can be expected to rise to the next resistance level 1450.00 (former support from April).
PALLADIUM starting a new Bearish Leg to the 1W MA100.Last time we looked at Palladium (XPDUSD) was 5 months ago (December 05 2025), giving a strong Buy Signal that eventually hit our $2000 Target, before correcting and breaking the Channel up pattern:
The pattern that emerged has been a Channel Down with two similar Bearish Legs so far (-27.69% and -28.69% respectively) and since the 1D MA50 (blue trend-line) rejection, we have technically started the third.
With the 1D RSI also rejected at the top of its range, we expect Palladium to decline towards the 1W MA100 (red trend-line) at least, targeting 1200.
---
** Please LIKE 👍, FOLLOW ✅, SHARE 🙌 and COMMENT ✍ if you enjoy this idea! Also share your ideas and charts in the comments section below! This is best way to keep it relevant, support us, keep the content here free and allow the idea to reach as many people as possible. **
---
💸💸💸💸💸💸
👇 👇 👇 👇 👇 👇
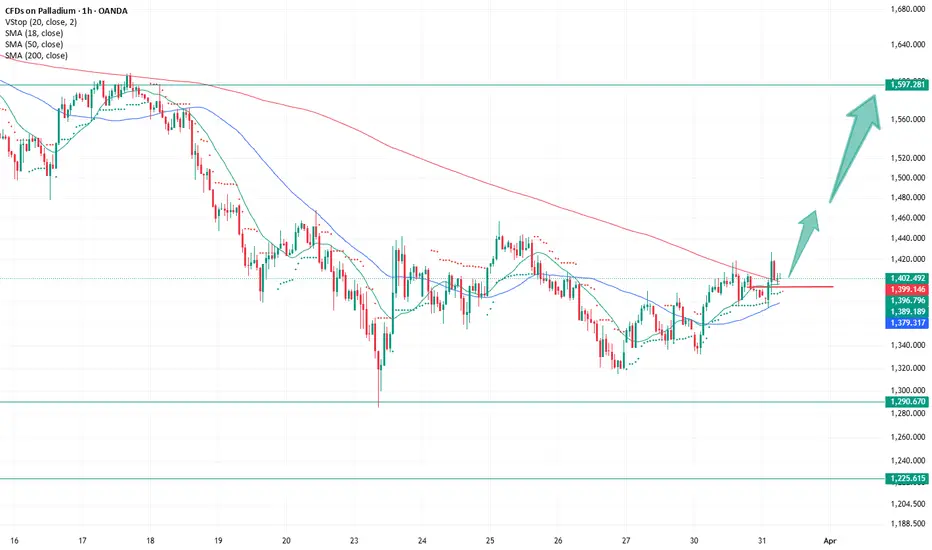
Palladium Wave Analysis – 2 April 2026
- Palladium reversed from support zone
- Likely to rise to resistance level 1600.00
Palladium recently reversed up from the support zone between the key support level 1360.00, which has been reversing the price from last October.
The upward reversal from the support level 1360.00 created the daily Morning Star – which started the active impulse wave 1.
Having just broken the daily down channel from February, Palladium can be expected to rise to the next round resistance level 1600.00, former support from February.
XPD/USD Massive Move Incoming – Don’t Miss This!🚀 XPD/USD Bullish Structure – Liquidity Build-Up Before Expansion
📊 Asset Overview
XPD/USD – Palladium vs U.S. Dollar
Metals Market | Institutional Order Flow | Day/Swing Trade Setup
📈 Market Bias: BULLISH 🟢
Current structure suggests accumulation + liquidity engineering phase, with potential upside expansion once key resistance zones are cleared.
🎯 Entry Strategy (Layering Model)
This strategy follows institutional-style scaling (layer entries) rather than a single entry.
🔹 Primary Entry Zones (Buy Limits / Scaling In):
1380
1400
1420
1440
📌 You can expand additional layers based on volatility & liquidity sweeps.
💡 Alternative: Traders may also execute any price level entry with proper confirmation (structure + momentum shift).
🧠 Strategy Logic (Institutional Concept)
Liquidity engineered below & above key zones
Market likely building positions before expansion
Layering allows better average price + risk distribution
Designed to capture smart money accumulation phases
🎯 Target Plan (Take Profit Zone)
🚨 Target: 1530
🔎 Expect:
Strong resistance (institutional supply zone)
Overbought conditions
Possible bull trap → correction phase
👉 Secure profits aggressively near target zone
🛑 Stop Loss (Risk Control)
SL: 1360
⚠️ This is a structured protection level — adjust based on your risk model.
📌 Important Note
Dear Ladies & Gentlemen,
This setup provides a framework, not financial instruction.
You can scale out profits or manage risk based on your own trading plan.
🔗 Correlated Markets to Watch
Monitoring correlations gives confirmation 👇
XAU/USD (Gold) 🟡
→ Strong bullish metals sentiment supports palladium
XAG/USD (Silver) ⚪
→ Risk appetite + inflation hedge alignment
XPT/USD (Platinum) 🔵
→ Closely related industrial metal (PGM complex leader)
DXY (U.S. Dollar Index) 💵
→ Weak USD = bullish metals
→ Strong USD = pressure on XPD/USD
🌍 Fundamental & Macro Drivers (Latest Market Context)
🔥 Key Bullish Factors:
Palladium remains in a long-term supply imbalance environment despite fluctuations
Prices have shown strong recovery momentum with recent rallies above $1,900 levels in 2026
Analysts expect potential upside ranges toward $2,200+ in bullish scenarios
⚠️ Risk Factors:
Demand heavily tied to automotive sector (catalytic converters)
Rise of electric vehicles reduces long-term demand pressure
Market remains highly volatile due to liquidity and thin market depth
🧩 Emerging Developments:
New industrial demand (China fiberglass sector, electrochemistry use) could support future demand diversification
Supply risks from Russia & South Africa (major producers) continue to influence price action
🗓️ Upcoming Economic Catalysts to Watch (London Session Focus)
USD Inflation (CPI)
Federal Reserve rate expectations
U.S. Jobless Claims
PMI Data (Manufacturing / Services)
👉 Strong USD data = short-term pressure
👉 Weak USD data = bullish continuation
💬 Execution Mindset
Patience during accumulation
Precision during entry
Discipline during exit
🏴☠️ Trader Motivation
“The market rewards patience, not impulse.”
“Smart money builds quietly — retail reacts loudly.”
“Consistency > One big win.”
⚡ Final Thought
This setup is built on liquidity, structure, and macro alignment.
Trade the plan — not emotions.
Palladium Entry PlanI like how metals are aligning now on daily and weekly charts. It feels like we’ve hit levels of decline—I dare say, this looks like a decent moment to take this reversal.
On silver, I opened a position yesterday. It didn’t close because my broker shuts down trading overnight. So, that overnight drop (or Asian session drop, depending on time zone) didn’t hit me. Honestly, I’m somewhat glad it didn’t. Of course, there’s a flip side—sometimes it opens with gaps, and losses can be bigger, which isn’t great, but we work with what we’ve got. In any case, I kept my silver stop under today’s low, which is acceptable.
Now, on palladium, I’m also eyeing a long position . Since I’ve got a fair bit of risk in the silver trade, I’ll place the stop under today’s low—so around 1394. My first target is 1470, then 1600.
Overall, I believe nothing external has changed. We are still in the paradigm of a rising commodity cycle. After the solid correction in recent weeks, I think it’s a great time to go long—especially since the stop is very short. Let’s see if it holds. I’d like it to. But even if I get stopped out, I won’t stress—I’ll re-enter intraday if I see all the candles and patterns signaling further price growth. So far, everything favors continued growth.
PALLADIUM: Bounce, Trap, DropSeven failed attempts to break support have created a dangerous illusion of safety for the bulls. While the market prepares for a liquidity hunt to $1710.00 , the underlying structure points to a classic "trap-and-drop" sequence that could catch many off guard.
# - - - - -
Technicals:
1. Palladium is currently trading near a local high within a broad medium-term range of .
2. Since 2020, the lower boundary (S/R Mar. 2020) and the upper boundary (S/R June 2020) have REPEATEDLY served as support and resistance zones, depending on the market context.
3. After establishing a local high at $2129.00 and failing to sustain price action above , the price has been moving within a descending sideways range.
4. In February and March 2026, the price (2) twice tested the upper boundary of the channel with false breakouts, followed by a descending trend correction.
5. As of today (March 18, 2026), the median line of the medium-term channel is acting as the primary support zone. Since January 2026, the price has made 7 (SEVEN!) attempts to break through this zone on the 1D TF.
This indicates three key things:
- This support zone is exceptionally strong in the local picture and serves as a main point for determining the local trend.
- Should buyers hold this zone, the price may attempt a bounce toward to collect liquidity, with a maximum target of retesting $1815.00.
- In the event of a final breakdown and a confirmed close below $1545.00 , the price will head toward $1370.00.
# - - - - -
Conclusion:
In the medium term, the probability of continued downward movement toward $1350.00 is higher than a reversal and a continuation of the bullish trend.
The setup outlines 2 potential price action scenarios:
# - - - - -
Scenario 1: Price gets locally rejected from the zone
(Trigger: Entry ONLY after confirmation of a $1710.00 liquidity collection and weak price structure—evidenced by choppy movements or numerous upper wicks).
✅ Entry Point 1 SHORT : $1718.00
🛑 Stop-Loss: $1863.00
🤑 Target 1: $1431.00
🤑 Target 2: $1350.00
Continuous trading for 2-3 days at or above the zone will signal an upcoming breakout and bull trend continuation, invalidating this scenario.
# - - - - -
Scenario 2: Price penetrates the psychological zone
(Trigger: Entry after the price collects liquidity at $1515.00 and subsequently retests $1545.00 from below).
✅ Entry Point 2 SHORT : $1545.00
🛑 Stop-Loss: Above the high of the 1D candle that penetrates the zone.
🤑 Target 1: $1431.00
🤑 Target 2: $1350.00
A price close above the 1D candle that penetrates the zone invalidates the bearish continuation.
# - - - - -
Good Luck! ☺️
# - - - - -
DISCLAIMER: Not financial advice. Everyone must make trading decisions at their own risk, guided only by their own criteria and strategy for opening or not opening a trade.
# - - - - -
P.S. Everyone sees the support. Some definitely think there is a trap. I know which side I’m on. But where do you stand?
P.P.S. See analysis on other Metals in related publication on the >>>
Palladium Signals a Rebound OpportunityLong time no see, friends.
Unfortunately, my main job—yes, I do have a main job that covers all my essential needs besides investing—has had a lot of tasks lately, and I was struggling a bit. Plus, I’m a family person—I have family responsibilities. So, friends, I apologize. I promise that in the future, I will post more often with cool ideas for you.
Right now, I see decent opportunities to enter the commodities market . The metals have corrected well. I can’t say for certain that the correction is over, but right now, it seems you can try to take a position with a tight stop. Specifically, I’m looking at palladium, with a stop at 1,375 and a target around 1,500 for a rebound . Overall, what I like is that the metals are holding an uptrend. We see this in gold, silver, platinum, and palladium.
Gold would have been nice to buy around 4,000, but it didn’t give me that chance—I didn’t manage to get it near 4,100 today. And, in fact, it didn’t drop to 4,000, so we’re waiting.
For palladium, I like that we’ve now reached the zone of the 200 and 50 moving averages on the weekly chart—quite strong. So, I think from this level, you can carefully go down to a smaller timeframe. I chose the hourly chart, and the stop by volatility from the current level is long.
Platinum (PL) BounceHello Everyone
I observed a head and shoulders pattern on the platinum daily chart. RSI is currently showing to be overbought and although the general trend is still bearish with the head and shoulders drop to have only come to half way of its expected measure move, there will be a bounce off the 200 week moving average. Not sure if this will break the head and shoulders and reverse the entire trajectory of the chart or is the drop will continue. Price will run into resistance on the $1680 to the $1686 price point.
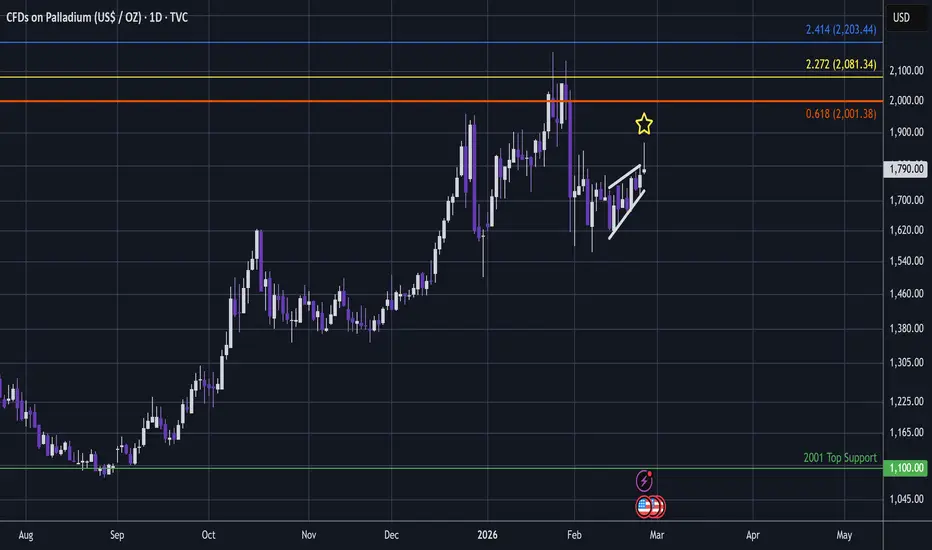
XPD/USD: CAN THE LSMA HOLD THE TREND?💎 XPD/USD | Palladium "The Silver-White Bull" – Market Blueprint 🚀
Asset: XPD/USD (Palladium Spot / US Dollar)
Trade Type: Day / Swing Trade 📈
Vibe: Professional Technical Analysis meets "Thief" Strategy Precision ⚔️
📊 The Game Plan: Bullish LSMA Pullback
We are tracking a high-conviction Bullish Continuation. The price has shown incredible resilience, staying near 4-week highs around $1,977 - $1,980. Our primary trigger is the LSMA (Least Squares Moving Average). We are looking for a tactical pullback to the LSMA line to confirm the next leg up.
The "Thief" is not a gambler—the Thief is a hunter. We don’t chase green candles; we wait for the price to come to our levels. 🏹
🏹 Entry Strategy: The "Thief" Layering Method
Instead of one "All-In" entry, we use Multiple Buy Limit Layers. This improves our average entry price and protects us against market noise.
Layering Zone (Buy Limits):
Layer 1: $1,980 (Immediate Momentum)
Layer 2: $1,950 (Support Re-test)
Layer 3: $1,930 (LSMA Sweet Spot)
Layer 4: $1,900 (Psychological Floor)
💡 Thief Tip: You can increase your limit layers based on your own capital. The goal is to "steal" the best average price as the market dips!
🎯 Targets & Risk Management
Main Target (Take Profit): $2,100 🏁
Analysis: There is a major resistance cluster + potential "Trap" zones near $2,100. Don't be greedy. Escape with the loot when we hit the target!
Stop Loss (Thief SL): $1,850 🛡️
Invalidation: If the price closes below $1,850, the bullish structure is broken.
⚠️ Note to the Crew (Thief OGs): I am not your financial advisor. Setting these specific TP and SL levels is my plan. It is your choice to follow or adjust. You make the money, you take the risk. 🤝
🌍 Fundamental & Economic Feed (Live Context)
Supply Scarcity: 🇷🇺 Russia and 🇿🇦 South Africa (80% of global supply) face ongoing export tensions. Supply deficits are projected to widen in 2026.
Geopolitical Chaos: President Trump’s recent moves regarding Greenland and European tariffs have triggered a flight to "Hard Assets."
Fed Factor: Uncertainty surrounding the new Fed Chair selection and central bank autonomy is weighing on the USD, making metals like XPD more attractive. 📉
Industrial Demand: 🇨🇳 China's industrial production rose 5.2%, signaling massive demand for catalytic converters and high-tech electronics.
⛓️ Correlations & Related Pairs to Watch
Keep these on your secondary screen to confirm the trend:
$XAU/USD (Gold): Currently hitting record highs near $4,700-$4,800. If Gold stays strong, XPD usually follows.
$XAG/USD (Silver): The "Volatile Cousin." Silver has torn through $93/oz. High Silver volatility often leads to "catch-up" rallies in Palladium.
$XPT/USD (Platinum): Closely correlated. If Platinum breaks its resistance, it clears the path for XPD to fly. ✈️
TVC:DXY (US Dollar Index): Inverse Correlation. Watch for DXY weakness. A falling Dollar is the fuel for our $2,100 target. ⛽
Hit the 👍 LIKE button if you’re riding with the Thief OGs today! Drop a comment below: Are you layering in or waiting for a breakout? 👇
#Palladium #XPDUSD #Commodities #TradingStrategy #TechnicalAnalysis #ThiefStrategy #PreciousMetals
pall and metalslooking at structure and targets for long call on the macro chart.
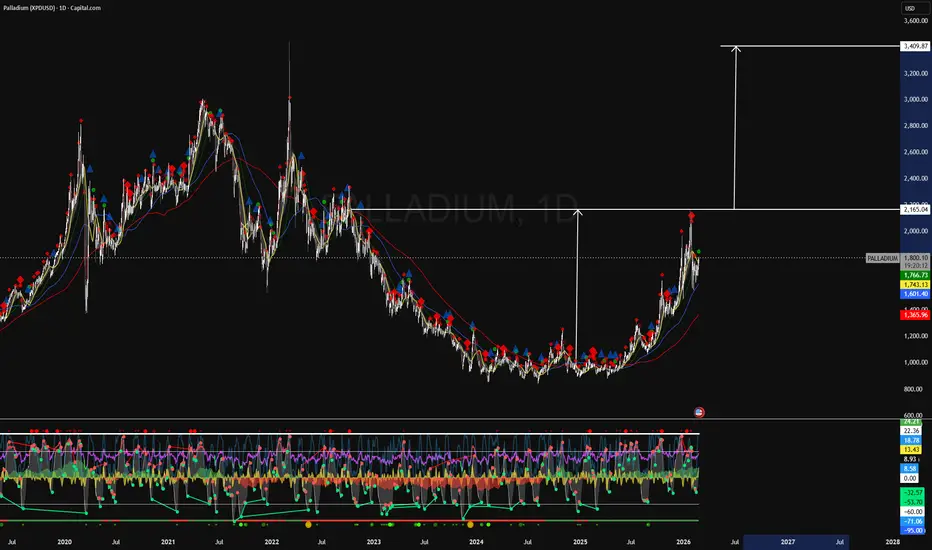
I am calling for over 3k on pall at the end of 2026-27
short term we have volatility and most analysis are calling the bull run over on metals. I will remain bullish long term on xag and xau
we will likely see a heathy correction over the next few months, but I am confident we haven't seen all-time highs on metals.
short term correction then we should consolidate but I don't believe we will see 2k on gold again.
PALLADIUM - Short Setup And Market WarningShooting Star is likely to complete this bearish ascending fractal.
Palladium tends to print the weakest action of the metals that I cover, and as yet other metals not really showing obvious frailty in LTF.
So, this may be a signal that they will follow into more bearish fractals soon - since in HTF they will likely move together.
I have re-entered my short at this improved price point.
Could be a long way down whenever this bearish trend gets underway 👍.
Palladium: The Overlooked Giant
My thoughts, I believe this is still a very early opportunity for entry, particularly compared to the other metals. I don't anticipate palladium will double-bottom, although I can understand that sentiment based on the past. And from here, 10-year, 10-bagger. It'll beat gold, silver, and platinum. Well, maybe gold will overshadow palladium far into the future.
Similar to platinum although less strengthThree technical patterns in play.
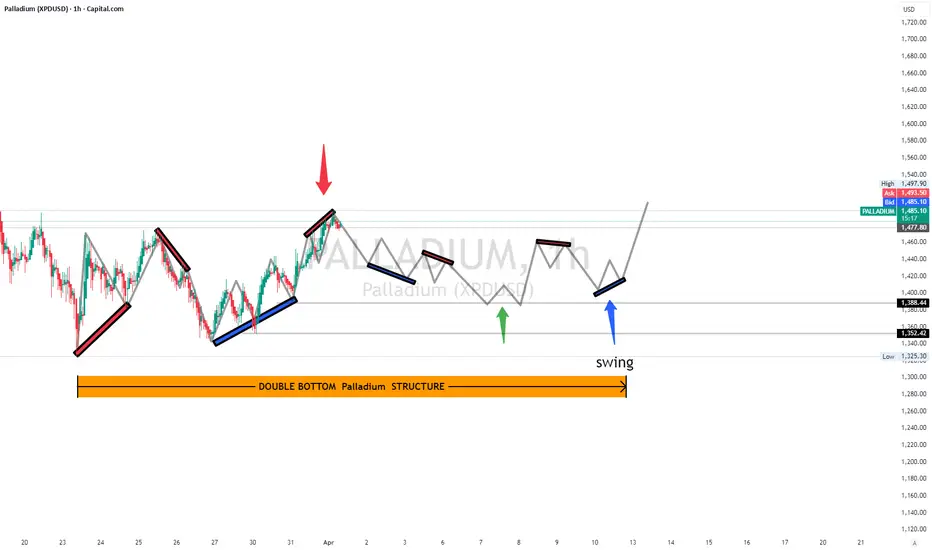
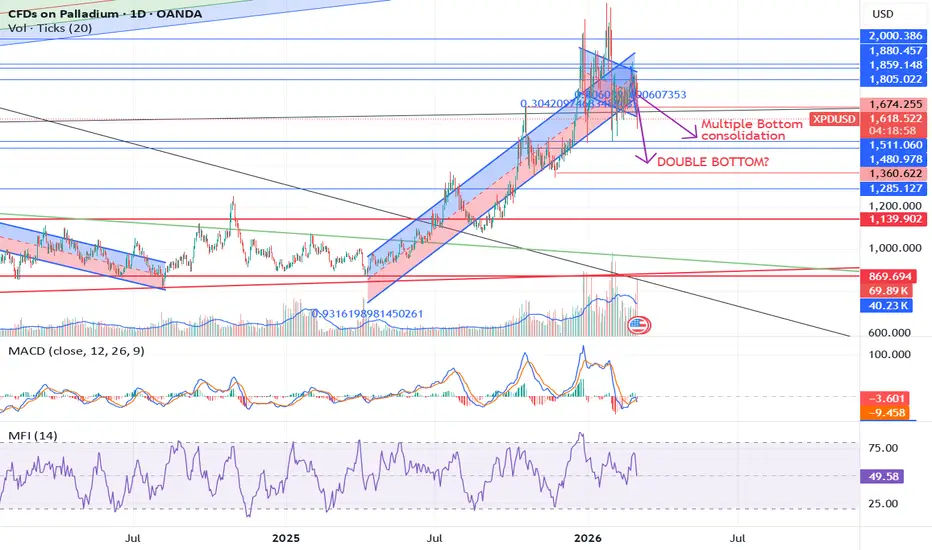
In one case palladium falls to $1369....that would be a head and shoulders/Double bottom. This seems likely if we get the slowdown scenario.
In the second case we get a double bottom or a flag pattern at $1500 ish... this is plausible if supplies remain tight and we get a moderate slowdown.
The third case is that this is only a flesh-wound. and some consolidation was in order. Not anymore at this point.
Long from 850ish.
Palladium - Bullish divergenceThe noble metal of Palladium has undergone a robust correction of fifty percent since the waning days of March in the year 2022. This fortuitous circumstance has begotten a plethora of reasons for one to adopt a bullish outlook. They include..
1) Price action and RSI resistance breakouts.
2) Bullish divergence. Six oscillators now print positive divergence with price action as measured over a 9 month period. Look left.
3) Not a big fan of targets. However the falling wedge pattern + breakout confirmation now forecast a 3000+ target.
Alas, is it not within the realm of possibility that the price action may suffer a further descent? Regrettably, this rhetorical inquiry must be met with an affirmative response. But, I beseech you, dear reader, to meditate on the concept of probability, for it is in this realm that the prospect of such an event becomes most implausible.
Gwd I need to stop reading the great works for Christopher Hitchens.
Ww
Type: Trade
Risk: <=6% of portfolio
Timeframe: Long from 1300 as the market allows.
Return: 100%
PLong