XRP/BTC - Likely LowThis will be a brief post, but it adds some additional support to my argument in my last XRP/USD idea, which you can find here:
XRP is poised to gain some strength against Bitcoin in the short term based on this ratio. The bounce XRP/BTC has just shown from oversold conditions on the daily timeframe gives the first major signal of trend momentum flipping back to the upside.
It is also worth noting that the 3D chart printed an inverted hammer on the last close, and this current candle could form a wick-off bottom, giving a solid setup for a potential reversal to the upside.
There are a few other supporting reasons, but as stated, I want to keep this post brief. Watch for a move back toward the black trendline, as that will be the main test for XRP. It is an extremely significant trendline on the 3-day timeframe for XRP/BTC. Once the ratio reaches that level, I will make a follow up post and go into more detail.
In-depth trading ideas
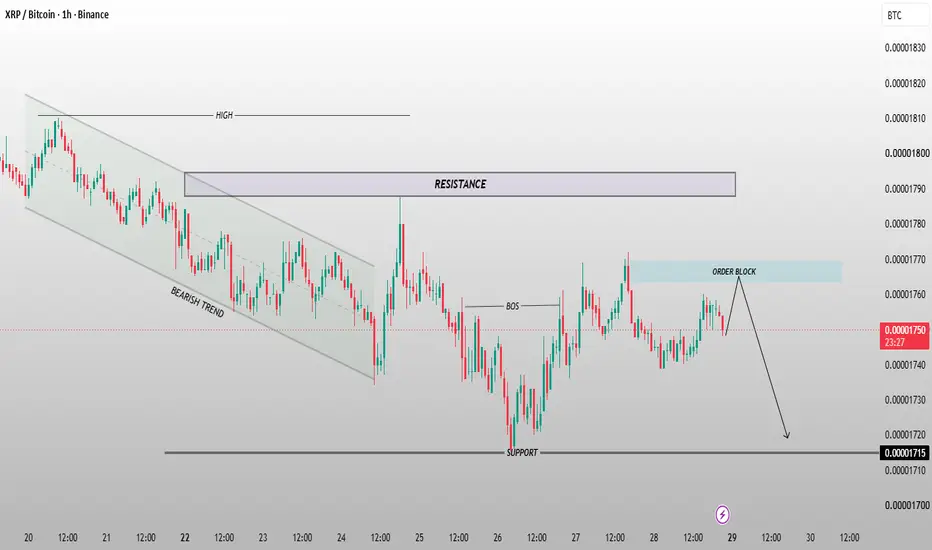
XRP/BTC 1H Market Analysis 📊 XRP/BTC 1H Market Analysis 🚨
🧭 Market Structure
Price has broken out of the previous bearish channel, signaling a shift in market structure.
A Break of Structure (BOS) confirms buyers have regained short-term control.
🟦 Key Resistance
Price is approaching a 1H Order Block around 0.00001760–0.00001770 BTC.
This zone is likely to attract strong selling pressure.
📉 Bearish Scenario
If the order block rejects price, a bearish move toward the 0.00001715 BTC support becomes highly probable.
📈 Bullish Scenario
A strong candle close above the order block could invalidate the bearish setup and open the way for higher resistance levels.
🎯 Trading Outlook
⚠️ Watch the Order Block closely. Rejection favors short positions targeting support, while a confirmed breakout shifts momentum back to the bulls.
XRP Looks Like It Will be the #1 Altcoin once It Breaks OutNo matter which angle I look at XRP from rather it be from the USD Denominated Perspective or it be from a more unique perspective we're exploring on this current chart; XRP always shows signs that on a macro perspective that it is setting up for something bigger and well beyond anything we've seen in any of the other Megacap Cryptocurrencies. In the chart explored here we can see that both XRP Dominance and the XRP to Bitcoin Ratio have traded within the same broader range since 2014 and ever since 2019 XRP has stabilized and gone into a much tighter range of consolidation within the lower part of the broader range and the ATR (Average True Range) is at an all time low and has been in decline ever since 2018 and we're yet to see any changes though this could be the signal for a future directional move, but with the price action it's endured over the years It almost seems as if XRP will never truly breakout or move again, but we've seen this sort of multi year stagnation within the lower part of the range before. Between 2015 and 2017 when it traded at this very level for years before one day just breaking out and when it did finally breakout there wasn't really any established resistance above, it just went straight up for over two months, eventually hitting a Total Crypto Dominance of 31.32%, making it the highest marketcap altcoin of the time and it even managed to surpass Bitcoin for a few hours, but XRP did this during a crypto bear market and could only go against the macro trend for so long before falling back down with the rest of the other coins just as fast as it pumped. It eventually found support at the lows of the range and attempted a rally in 2018 but that was when the SEC started to step in to litigate against Ripple and from there any progress in recovering from the lows were stuffed, leaving ripple stuck in the lower parts of the broader range for many more years than it had previously been there. I very much believe that if not for the SEC, XRP's performance would have continued the way it was going in 2017 and that it would have found its way back to having double digit dominance in the crypto space but instead it has been stuck in this tighter consolidation at the lows as the SEC's litigation went on almost as if the price action was just pending based on the results of the lawsuit. Now that the litigation has ended and Ripple is still around and operational and the SEC is no longer after them, XRP may be free to give us the type of comparative price action we originally knew it for pre litigation. If that's the case then we could soon see a move up in XRP dominance and XRP to BTC similar to what we saw in 2017 which if we take that fractal would bring the XRP Dominance back to around 31%, given how much higher the Total Crypto Marketcap is Today and How much Higher BTC itself is today, one could only imagine that XRP Dominance in that range would likely be congruent with XRP's USD pair trading in the $30s or even the $100s.
Ripple has more partnerships and is the most deeply established crypto company in the world right now, without the SEC holding it down it may very well be time for XRP price action to be completely let loose. As insane as a 30 dollar or even a triple digit XRP price sounds, the asset currently has a lot of catching up to do and has at least proven that it can be stable for nearly a decade even when it was attacked by a powerful outside force.
It is by this metric that I think XRP is the most battle tested coin in crypto and is one of the oldest as BTC, LTC and XRP have been around longer than mostly any other coin even ETH by comparison hasn't been around that long, BTC, LTC, and XRP really were the originals. With the success of XRP and in the case of heavy appreciation of XRP's price I would also suspect it to drag up the price of Stellar Lumens as that is XRP's closest competitor but in spite of that I think XRP will be the leader in this race.
XRP dump will cause the alt season.I have looked at many altcoin charts against XRP and all of them are bottomed out. This has caused me to believe this will be the true cause of the next alt season. Take a look at the alt vs xrp charts below and see for yourself
So yeah I think XRP will finally dip to the price I buy it at, let's see how this goes, I don't expect these alts to remain bottomed out against xrp forever
$XRP / $BTC bullish enough Ripple broke above the falling channel structure, which has existed since 2017, and also broke above the 50 EMA in November 2024. Following this breakout, the price entered a prolonged period of re-accumulation.
The recent market crash served as a technical retest of this structure.
While short-term volatility may appear misleading, over the long term, CRYPTOCAP:XRP still maintains a clearly bullish structure.
Ripple SatsI'm looking for a test of the top of this band, before coming back down. That's my $30 test. It comes way down after guys to make that retrace.
What is that in dollars? I don't know. $5-7?
We can go past $30 on this breakout. There's no reason we can't go much higher, but pure technicals advise caution over $30, and some would say to sell even before $30 if you like lowering your risk. You do you, but $30 coming at you fast.
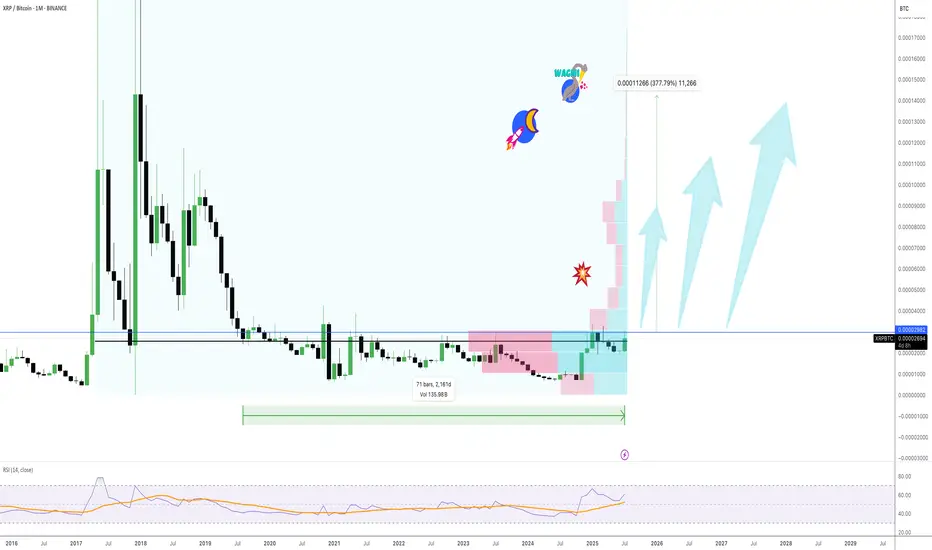
Xrp/Btc✨ Ripple vs Bitcoin — awakening from a long slumber?
📍 August 2025, Monthly Chart
A decade of swinging
between historic peaks and the heavy shadow of silence...
Now, XRP rests at 0.000026 BTC,
as if slowly awakening after years of dormancy.
🔸 RSI has moved off historic lows, gaining strength.
🔸 The long-term moving average (red) is drawing closer to price.
🔸 Key resistances ahead:
▫️ 0.000097 → 38.2% Fib
▫️ 0.000125 → 50% Fib
▫️ 0.000153 → golden 0.618 Fib.
🔮 Scenarios:
1️⃣ Break above 0.000097 → a mid-term wave toward 0.000153.
2️⃣ Failure to break → a pullback toward the 0.000062 ~ 0.000058 support zone.
📌 Is Ripple finally awakening?
Or is this just another breath before the next slumber?
Time will tell... ⏳
XRP/BTC - Perfect Prediction Please refer to our previous post:
After the XRP breakout we outlined that XRP/BTC was the most important pair to watch. Also, we outlined that the XRP/BTC pair was likely to push into our "potential supply zone" that ranges between around 0.0000285 and 0.000031.
This is exactly what happened with our XRP/BTC pair topping out around 0.0000307. Thus confirming resistance as sellers started offloading in this range. Once the pair broken down from the supply zone it tanked to our yellow dotted line "key level".
So far price has been respecting this key level with all candle bodies above. This has also been in alignment with the psychological $3 level. If XRP/BTC closes a 12H/1D candle body below the yellow dotted line the uptrend is likely not to stay in tact.
For now, with the pair respecting the yellow line a move back to test the bottom of our supply zone (0.0000285) is on the table.
Mastering XRP Structure with Bitcoin Dominance - (Hedge is Edge)📉📊 Mastering XRP Structure with Bitcoin Dominance - Educational Breakdown 🧠💡
Hey traders! FXPROFESSOR here 👨🏫
From now on, my TradingView Crypto posts will be 100% educational only . I won’t be sharing target charts or trade setups here anymore. Why? Because even with the best chart, most traders still struggle to execute properly. So instead, I’ll teach you how to think, read, and act like a real trader.
👉Let’s jump into today’s educational case:
🔍 Chart 1: XRP/BTC
We're facing a clear resistance zone around 0.00002780, rejecting after several tests. There’s also a wedge pattern forming, suggesting a drop is likely — possibly toward 0.00002690 or even further to the unchecked support at 0.00002469. That’s a 9.4% move — but remember, this becomes invalidated if XRP breaks back above 0.00002780.
🔍 Chart 2: Bitcoin Dominance
Dominance is sitting right on support. If BTC dominance rises, it means Bitcoin could gain strength relative to altcoins. This typically leads to:
BTC holding steady or rising
Some major Alts (like XRP) might correct
Watch this carefully — a BTC dominance rebound strengthens the XRP short thesis.
🔍 Chart 3: XRP/USD
XRP/USD is moving inside a large wedge formation. The current rejection level is around $3.34, with price possibly aiming for $2.88 or lower if the wedge plays out. Until we break above that resistance, the bias remains bearish.
🎯 Strategy Insight – The Hedge
What’s a calculated way to play this setup?
→ Go long Bitcoin (dominance at support)
→ Go short XRP (at resistance)
This way, you hedge your exposure while staying aligned with market structure. This is not financial advice — but a great exercise in developing strategic thinking.
📌 Remember: Managing the position is a whole different skill — one that you must learn through real-time practice and proper mentorship. But the charts today give you valuable food for thought to sharpen your edge.
Let’s stop gambling and start thinking like traders. No hype. No signals. Just structure, context, and logic.
One Love,
The FX PROFESSOR 💙
Disclosure: I am happy to be part of the Trade Nation's Influencer program and receive a monthly fee for using their TradingView charts in my analysis. Awesome broker, where the trader really comes first! 🌟🤝📈
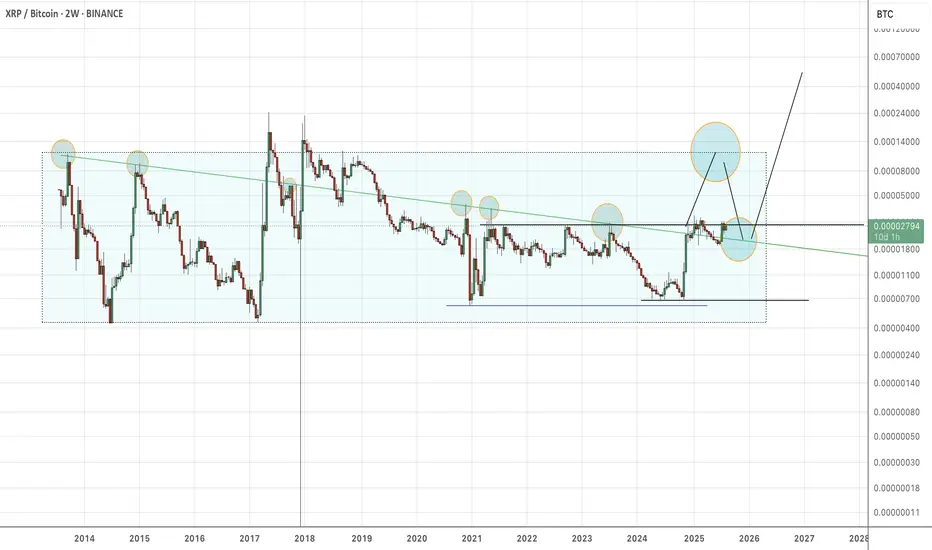
XRP about to rise agains BTC, ready for a liftoff. + 200% 6 years ago (in august) we dropped under the resistance zone marked in blue on the chart and couldn’t brake it.
6 years later we are coming close to this trend line with a new attempt. Maybe a coincidence that now in August we can brake it?
After being in a range for so long the bullish breakout on this could be wild.
And as we see on the chart, behind this resistance there is not much resistance left!
I personally expect a break for about 200 or 300% to the upside.
Everything is lining up perfectly, the SEC case, all the ETF’s waiting,…
This week will be huge for XRP and believe in august we brake through.
Have a nice Sunday.
XRP/BTC – Channel Midline in Play The XRP/BTC pair trade inside a multi-year channel, with price currently testing the midline of this structure — a pivotal level that could define the next macro leg.
If bulls manage to break the midline to the upside and successfully retest it as support, the upper boundary of the channel becomes the next major target.
🔼 Upside Scenario:
A confirmed breakout above the midline would signal structural strength and likely lead to a rally toward the upper channel resistance.
If this move aligns with BTC dominance dropping below the 60% threshold, we could see a full-blown altseason emerge.
Under such conditions, historical XRP/BTC behavior suggests that XRP/USD could reach $12–$24.
🔽 Downside Risk:
Losing the mid-channel from here would weaken the structure and invalidate the breakout thesis.
In that case, XRP/BTC would likely rotate back toward range lows, and a defensive strategy is warranted.
Macro Implication:
The 60% BTC Dominance level remains critical. A clean breakdown below it historically marks the beginning of altseason, where high-beta plays like XRP against BTC have outperformed. XRP’s current posture within the channel reflects this high-stakes moment.
XRP Eyes Explosive Growth: A Path to $10 and a 2025 "Euphoria PhThe cryptocurrency market is charged with renewed optimism, and much of the focus is now turning to established digital assets like XRP. After a prolonged period of consolidation, a powerful combination of bullish technical indicators, evolving market dynamics, and a compelling value proposition is fueling forecasts of a significant price surge. Market analysis now points to a potential future where XRP could trade in the $6 to $10 range, a move that hinges on Bitcoin achieving a landmark price of $144,000.
Adding to this momentum, detailed chart analysis suggests that XRP may be on the cusp of entering a "euphoria phase" between August and October of 2025, a window that could see unprecedented growth. As market leaders Bitcoin and Ethereum become increasingly expensive for the average investor, a strong argument is emerging that XRP currently offers a superior entry point, blending high potential with accessibility. This convergence of factors is positioning XRP as a token to watch, with many believing its next major bull run is not a matter of if, but when.
The Bitcoin Catalyst: Charting XRP's Trajectory to $10
A significant component of XRP's bullish outlook is directly tied to the performance of Bitcoin. The relationship between the two assets, often measured by the XRP/BTC trading pair, is showing signs of a historic shift. Technical analysis of the XRP/BTC monthly chart reveals that its price is coiling tightly just below a critical resistance level. A definitive monthly close above this threshold would represent a major technical breakout, signaling a powerful reversal of its long-term trend against Bitcoin. Such a move would be the first of its kind since 2018 and could unleash substantial upward momentum.
Should this breakout on the XRP/BTC chart materialize, technical projections indicate an initial move toward a higher valuation, with a primary target zone identified. If this rally in the trading pair coincides with Bitcoin’s price climbing to the projected $144,000 level, the math translates to a U.S. dollar valuation for XRP of between $6 and $10. The timing for such a move is projected for late 2025, assuming Bitcoin’s own bull run accelerates as anticipated.
The XRP/USD chart independently supports this constructive outlook. A recent weekly close above a key price level has flipped several long-term indicators to a bullish stance, generating a classic breakout signal. Using standard technical projection models, such as Fibonacci extensions, price objectives for XRP now stand at approximately $4.53, $6.31, and even as high as $9.22. The journey to these targets, however, remains heavily dependent on the broader market strength led by Bitcoin. A stall in Bitcoin's advance would likely moderate the upside potential for XRP.
The "Euphoria Phase": Why Late 2025 Could Be Explosive
Beyond its relationship with Bitcoin, XRP's own price chart is signaling immense latent potential. After trading within a defined range for years, the token is now exhibiting powerful bullish signals on its weekly chart, suggesting a breakout from a multi-year consolidation pattern is underway.
Several key technical indicators are aligning to confirm the start of a new, sustained uptrend. A clear bullish crossover on the weekly Moving Average Convergence Divergence (MACD) indicator—a trusted measure of market momentum—has already occurred. At the same time, the Relative Strength Index (RSI) is climbing steadily but has yet to enter the overbought territory that has historically marked the peak of major cycles. This indicates that there is still significant room for price appreciation before the rally becomes exhausted.
A critical psychological and technical price level now stands at $5. A firm weekly close above this mark would be a monumental event, likely triggering a wave of intense buying pressure and shifting market sentiment from simple optimism into full-blown euphoria. If this breakout is confirmed, the next macro price targets are projected to be in the $8 to $11 range, levels consistent with the price action seen in XRP's previous parabolic advances. Based on historical cycle patterns and the current technical structure, this explosive phase could unfold between August and October of 2025.
The Value Proposition: Why XRP Stands Out in a High-Priced Market
As Bitcoin and Ethereum command prices that put them out of reach for many new participants, a psychological barrier to entry has formed. It is in this environment that XRP’s unique market position becomes a powerful advantage. The investment case for XRP is straightforward and highly attractive to first-time crypto buyers who may be experiencing "sticker shock" from the market leaders.
With its high market capitalization and global recognition, combined with a low per-unit price, XRP presents an appealing proposition. This dynamic, often referred to as "unit bias," makes investors feel they are getting better value by being able to purchase a larger quantity of tokens. This behavioral pattern has historically driven significant retail inflows into assets perceived as more affordable.
This appeal is not merely psychological. XRP is underpinned by a clear and functional use case: facilitating fast, low-cost cross-border payments. The XRP Ledger’s ability to settle international transactions in seconds for a fraction of a penny provides a fundamental strength that distinguishes it from purely speculative assets. This utility, aimed at disrupting the enormous traditional finance market, offers a layer of long-term credibility. The broad distribution of XRP across millions of digital wallets highlights its widespread accessibility and deep retail base, a demographic that could be instrumental in fueling its next major run.
A Prudent Perspective
Despite the compelling bullish case, it is essential to approach these forecasts with a clear understanding of the risks involved. The cryptocurrency market is defined by its volatility, and price targets are speculative projections, not guarantees. XRP's path is still influenced by external factors, most notably the ongoing regulatory landscape, which could have a significant impact on its future.
Furthermore, the most optimistic scenarios for XRP are heavily reliant on Bitcoin maintaining its powerful upward trajectory. Any weakness in the flagship cryptocurrency would undoubtedly impact the entire altcoin market, including XRP. While the technical and fundamental outlook appears increasingly bright, a disciplined and well-researched approach remains the cornerstone of navigating this exciting but unpredictable market.
Skeptic | XRP Analysis: Can It Hit $6 After Bitcoin’s $111k?Hey everyone, Skeptic here! Bitcoin just smashed through the $107K resistance, shaking up the whole crypto scene! Is XRP ready to rocket to $6 ? Curious about spot and futures triggers? Stick with me to the end of this analysis for the full breakdown. 😊 Let’s dive in with the Daily Timeframe. 📊
Daily Timeframe: The Big Picture
After an epic 500% rally , XRP has entered a consolidation phase, which we can spot from the decreasing volume. It’s too early to call this a distribution or re-accumulation, but I’m leaning toward re-accumulation for a few reasons:
Bitcoin’s Uptrend: The ongoing bullish trend in Bitcoin is fueling crypto market liquidity.
Positive XRP News:
Ripple and the U.S. SEC reached a settlement in early May 2025, ending a long legal battle over XRP’s status as a security. Ripple paid a $50 million fine, with $75 million of a $125 million escrow returned. This cleared major regulatory uncertainty, boosting investor confidence and paving the way for broader U.S. adoption.
XRP Spot ETF Speculation: BlackRock reportedly discussed an XRP ETF application with the SEC, and firms like Franklin Templeton and Bitwise have filed for XRP ETFs. With the SEC’s new crypto-friendly leadership, the odds of ETF approval are 80-85% by the end of 2025, potentially unlocking massive institutional capital.
Spot Trigger:
The main trigger is a break and consolidation above 3.3684 , which aligns with breaking the daily consolidation box.
This could kick off a new momentum wave. Expect a sharp breakout, so don’t miss it!
If you’re aiming for a long-term buy, I’ll share lower timeframe triggers to front-run this breakout.
First Target :
After breaking the box’s ceiling, aim for 6.64 . I cloned the box and placed it above, as this often works for target setting. 🙂
Tip: Pay close attention to Bitcoin and USDT.D for better target spotting.
4-Hour Timeframe: Long & Short Setups
On the 4-hour chart, price action is getting tighter and tighter, which is awesome. Why? The longer we range, the more liquidity builds up, setting us up for a sharp move with smaller stop losses compared to trending markets. Here’s the breakdown:
Market Context:
The 4-hour timeframe shows stronger bearish momentum, but remember: the major trend is uptrend, and the secondary trend is consolidation.
For shorts, keep position risk low since we’re in a bullish major trend.
For longs, hold positions longer and, if possible, lock in profits early without closing the entire position.
Long Setup:
Trigger : Open a long after a break above 2.4742 .
Key Notes:
Ensure the break comes with rising volume to avoid a fake breakout.
Reduce profit-taking on this position. Why? Higher levels have more liquidity, leading to sharp moves, making it harder to open new positions.
Short Setup:
Trigger: Open a short after a break below support at 2.2926 .
Advice: Take profits quickly and close the position when you hit your targets.
The current candle looks like it failed to break out and formed a shadow, which could increase the odds of a return to the ceiling and a resistance break.
Front-Running Spot Trigger:
To front-run the daily box breakout, open a position after breaking 2.9789 on the 4-hour timeframe.
XRP/BTC Analysis
XRP/BTC had a solid rally but is now in a price correction, and it’s a weak correction at that. Here’s what to watch:
Key Level : A break above resistance at 0.00002548 could bring back uptrend momentum to XRP/BTC.
Implication: If this breaks, buying XRP becomes more logical than Bitcoin, as XRP could outperform.
Until Then: Stick with longs on BTC, as liquidity is flowing more into Bitcoin, giving it stronger growth potential.
Pro Tip: Checking the BTC pair is a game-changer—trust me! 😎
💬 Let’s Talk!
If this analysis sparked some ideas, give it a quick boost—it really helps! 😊 Got a pair or setup you want me to dive into next? Drop it in the comments, and I’ll tackle it. Thanks for joining me—see you in the next one. Let's grow together! 🤍
XRP ready for blast off, 2017 style !Already in position for soooo long, I can wait a few more weeks !
But, the target will be reached soon !
Any price action around the red dash line will be sold agressively.
Then it purely depend if we have only one leg of bullish move, or two legs with a strong pullback like in 2017. Let's see !
Anyway, I still believe XRP will fly somewhere between 20 to 50$ this bull run before massive long term correction.
Congrats XRP army ! We all deserve that money !
XRPBTC - Massive BreakoutPlease refer to our previous post:
As mentioned in our last post we believed the XRP/BTC chart to be the most important chart in preparation of an XRP breakout.
Now we have seen the level of 0.00002150 break. Upon breakout and retest the XRP/BTC pair has started to skyrocket helping to fuel the XRP/USD breakout.
Now the pair is getting close to the key level of 0.0000255 which has historically played a role of support and resistance and happens to be right around the $3 level of the USD chart.
If this pair can break above and continue to climb we are looking at the supply zone between the 0.618 and the 0.786. This ranges between around 0.0000285 and 0.000031. Hard to say what price this would put XRP at as we do not know what price BTC would be at the time, but these are the zone to watch.