XRP — BREAKOUT WATCHXRP — BREAKOUT WATCH
XRP is testing the 1.0193 resistance inside a descending channel. A clean breakout and hold above this zone could open the way for further upside.
Entry: Above 1.0193
TP1: 1.0300
TP2: 1.0450
SL: Discretion below the breakout zone
Bias: Bullish on confirmed breakout
In-depth trading ideas
XRP Bears Remain In Control XRP continues to trade within a well-defined bearish market structure, remaining below the key weekly resistance level at $1.40. This level has become the most important barrier for buyers, as every attempt to recover has so far failed to reclaim it.
Until price can close decisively above this resistance, the broader trend remains tilted to the downside.
The current technical structure continues to produce lower highs and lower lows, indicating that sellers remain in control of the market. While short-term relief rallies are always possible, they are likely to be viewed as corrective moves unless XRP can break through the weekly resistance and establish a higher high.
As long as price remains below $1.40, the probability favors a continuation of the broader corrective trend. The next major downside objective sits near the $0.50 region, which represents a significant high-timeframe support level where buyers may begin stepping back into the market. Until then, the path of least resistance continues to point lower.
From a technical perspective, there is currently no confirmed evidence of a bullish trend reversal. Market participants should remain cautious while XRP trades beneath weekly resistance, as the prevailing bearish structure remains intact. A decisive reclaim of $1.40 would invalidate the bearish outlook, but until that occurs, lower prices continue to be the higher-probability scenario.
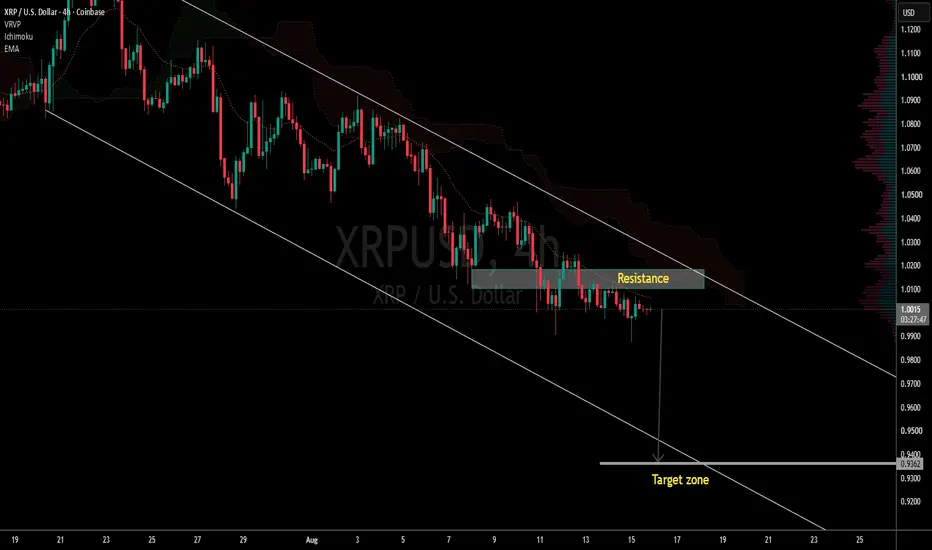
XRP/USD 4H – Descending Channel Breakdown Setup XRP is trading inside a descending channel on the 4-hour chart. Price is currently testing the $1.01–$1.02 resistance zone. A rejection from this area could lead to further downside toward the $0.93–$0.94 target zone. A strong breakout and close above resistance would invalidate the bearish setup and could signal a reversal.
XRPUSD Bearish Breakdown | Resistance Holding Strong (1H).
XRP remains under bearish pressure within a descending channel. Price has broken below the highlighted resistance zone around 1.01–1.02, confirming continued selling pressure.
As long as price stays below this zone, downside continuation toward the marked support around 0.9760 remains possible.
* 🔴 Resistance: 1.01–1.02
* 🟦 Support: 0.9760
* 📉 Bias: Bearish below resistance.
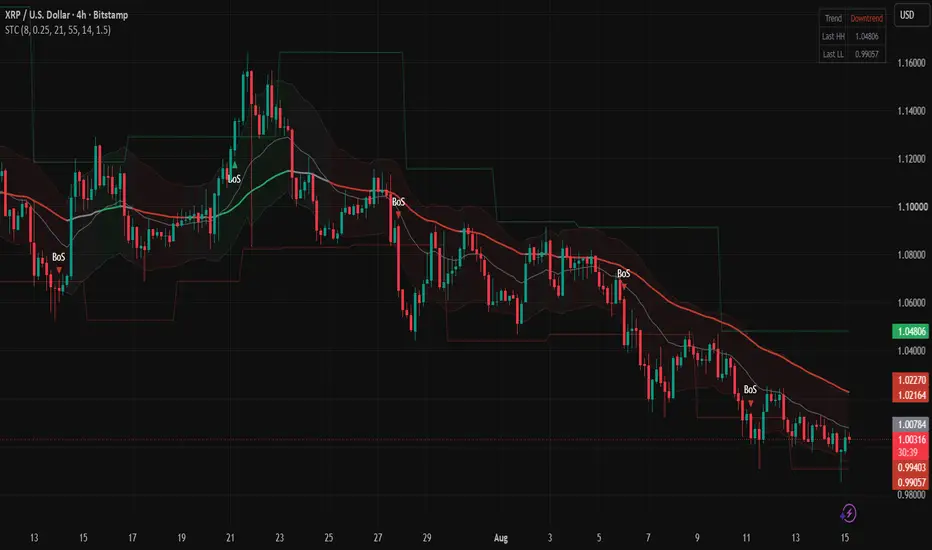
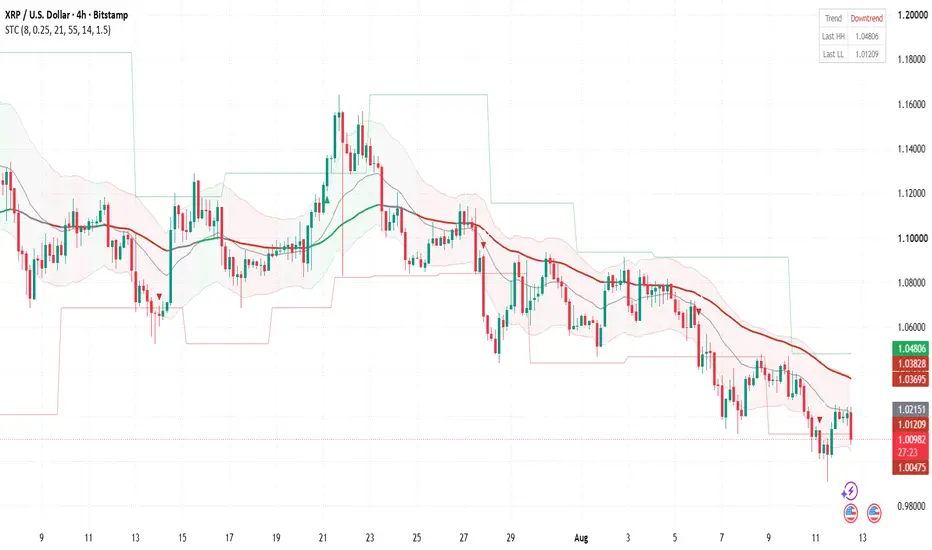
XRP/USD: Bearish BoS Below 1.0128 Keeps Pressure Toward 0.9915XRP's stuck under both EMAs on the 4H — price at 1.0033 with EMA21 at 1.0087 capping bounces and EMA55 up at 1.0236 as the real trend backbone the bulls need to reclaim. Band position is lower_half and the trend bias reads Downtrend, so every push into the middle of the band has been faded. The structural tell is the bearish BoS from 24 bars ago that broke the 1.0128 pivot; since then price has traded under it and hasn't been able to close back above.
Why it matters: the last swing high at 1.0488 is still open 39 bars back, meaning sellers have controlled every attempted rally. ATR14 sits at 0.0094 — a narrow band (upper 1.0228 / lower 0.9947) tells you compression is building right at the lows, and compressions inside a downtrend usually resolve with the trend unless we get a clean EMA55 reclaim.
Setup: watching the reaction at 0.9915 — the swing low that's still open 22 bars ago. A clean 4H close under it with an ATR-buffered break re-activates the bearish leg. Alternatively, if price reclaims EMA55 at 1.0236 on a closing basis, the downside idea invalidates.
Invalidation: a 4H close back above 1.0236 (EMA55) — that flips the trend backbone and neutralises the bearish structure.
Targets: first stop is the lower band area, then extension toward window lows.
Setup: Bearish continuation activates on a 4H close under the 0.9915 swing low with ATR buffer.
Invalidation: 4H close above EMA55 at 1.0236 cancels the bearish thesis.
Targets: 0.9947 — band lower, first magnet · 0.9862 — window low, next test if 0.9915 breaks · 0.9700 — round-number extension if momentum accelerates
XRP SQUEEZE [LONG] MAJOR PIVOTPreviously I posted a bull thesis...
So far this has been holding up nicely.
On XRP low frequencies and high frequencies phases lining up nicely for a short squeeze set up
Enjoy
--
🧠DATA DRIVEN signals
FOLLOW and LIKE for more high quality BACKTESTED signals from proprietary ML grade models, capable of accurately inferring phase, amplitude and likelihood unlike any mechanical indicator out there.
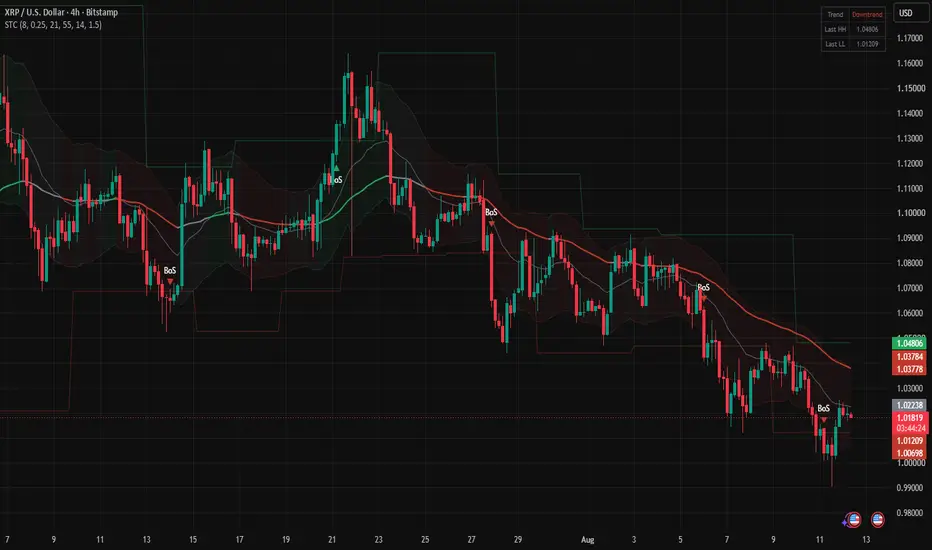
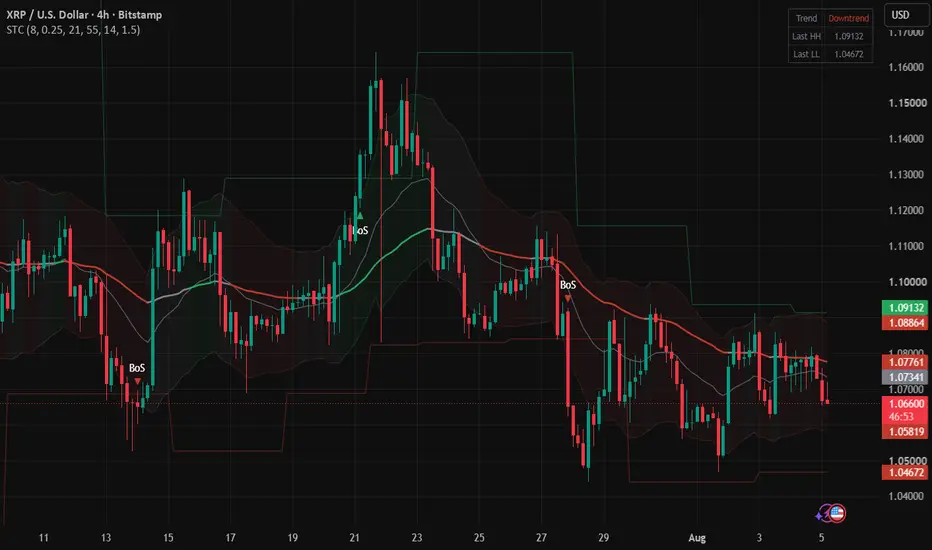
XRP/USD: Fresh Bearish BoS Below 1.0128 Opens Path to 0.9915XRP just printed a bearish BoS on the 4H at 1.0128 six bars back, and price is now hanging in the lower half of the volatility band at 1.0193. Trend bias flipped to Downtrend, with EMA55 sitting overhead at 1.03945 and EMA21 at 1.0236 — both are stacked against price, and the prior swing low that got taken out (1.0128) now flips into resistance-on-retest. The last swing high at 1.0488 is still open but 21 bars stale, so the structural pressure is clearly on the downside on this timeframe.
What makes the setup interesting: the BoS is fresh (6 bars) and the band lower sits at 1.006792, meaning there's still room before price gets stretched. If sellers keep control on a retest of the broken 1.0128 level, that's the trigger zone I'm watching — a rejection there confirms the flip. Any reclaim back above EMA21 at 1.0236 with a clean 4H close would invalidate the bearish read, and a push through EMA55 at 1.0394 kills it entirely.
Targets stack cleanly from here: first the band lower at 1.0068, then the round 1.00 handle, and the window low at 0.9915 as the extended objective if momentum keeps building. Not a chase — the edge is in waiting for the retest reaction.
Setup: Watching for a retest and rejection of the broken 1.0128 swing (now resistance) with EMA21/EMA55 stacked overhead.
Invalidation: A 4H close back above EMA21 at 1.0236 neutralises the setup; above EMA55 at 1.0394 kills it entirely.
Targets: 1.0068 — band lower, first reaction zone · 1.0000 — round-number magnet · 0.9915 — window low, extended objective
Xrp - Preparing a major +250% bullrun!🎉Xrp ( CRYPTO:XRPUSD ) is approaching major support:
🔎Analysis summary:
Over the past couple of months, Xrp has been creating a correction of about -65%. And with this quite strong drop lower, Xrp is also now close to retesting a major confluence of support. If the retest happens soon, Xrp could prepare a strong bullrun of about +250%.
📝Levels to watch:
$0.9
Keep your #LONGTERMVISION🙏
— Phil (@TheTraderPhil)
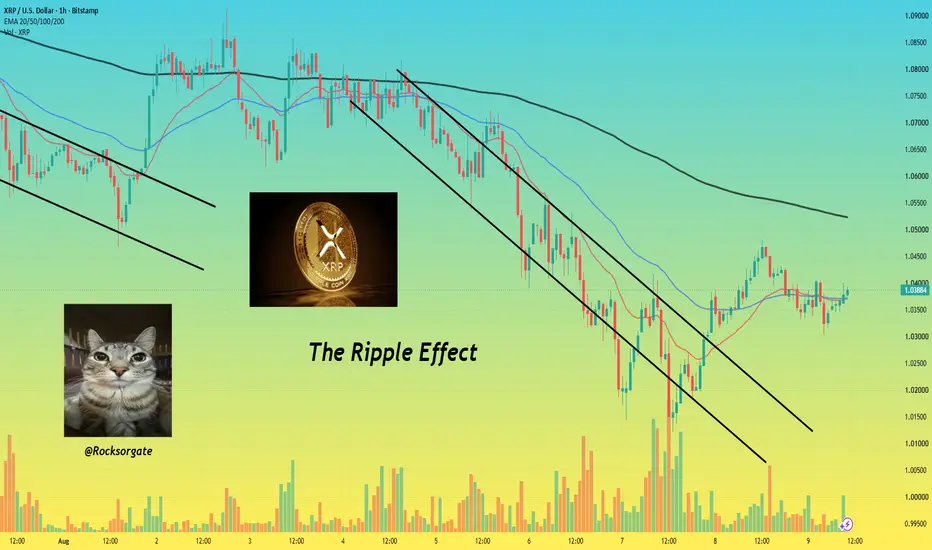
The Ripple Effect 📈 The current XRP price action is a textbook case of a high-stakes tug-of-war. We are seeing a fascinating battle between historical SEC regulatory milestones and shifting macro liquidity. When I look at the technical charts, I see tight, coiled consolidation near key support zones, while the on-chain metrics and utility narratives tell me that institutional players are quietly and structurally accumulating.
Technical Analysis
📈 I’m watching price lock into a massive macro symmetrical triangle pattern that dates back years, which is severely testing the patience of swing traders and forcing long-term holders to dig in.
📉 My analysis of the volume profiles shows a distinct, prolonged drying up of sell-side pressure, a classic footprint that usually tells us a sharp, volatility-fueled breakout is brewing.
📊 Looking at the moving averages, the 50-day and 200-day lines are compressing so tightly right now that they are practically suffocating the price action, signaling that an explosive directional move is imminent.
⚡ The RSI levels are hovering stubbornly right around the neutral 50 line, indicating a market completely stripped of momentum, neither overbought nor oversold, just waiting for a macro volume catalyst to flip the switch.
🛡️ What stands out to me is how beautifully our crucial support holds firm at the multi-year ascending trendline, even though we have a heavy, stubborn resistance ceiling hanging over us at the previous local highs.
Specific Price Targets
🎯 I am keeping a very close eye on the vital $1.00 psychological level, which serves as our absolute baseline support floor that bulls must defend.
🎯 If the bears manage to break that defensive line, my technical charts show a secondary safety net sitting right around the $0.90 to $0.95 range.
🎯 On the upside, the primary breakout hurdle we need to clear rests in the immediate $1.09 to $1.10 zone to reclaim short-term bullish momentum.
🎯 Once we cleanly smash through that initial barrier, the macro charts point to the critical $1.20 to $1.25 territory as the ultimate gateway for an explosive rally.
Beyond Technical Analysis
🌍 Beyond the charts, the relentless integration of RippleNet into global cross-border payment corridors ensures a fundamental utility floor that pure speculative altcoins simply cannot match.🏛️ Now that we have solid regulatory clarity in key global jurisdictions post-lawsuit, traditional financial institutions finally have the green light to pilot XRP without a dark cloud of legal liability hanging over them.
🐋 When I dig into the on-chain data, whale wallet accumulation metrics reveal a steady, quiet outflow of tokens from exchanges straight into cold storage, significantly choking off the available liquid supply.
🌐 The broader macroeconomic landscape, marked by shifting central bank rate cuts and fluctuating global liquidity indexes, is acting as a massive external tailwind pushing capital into risk-on digital assets.
🧠 From a psychological standpoint, market sentiment is completely fractured; retail investors are largely feeling fatigued and apathetic, which historically is the exact asymmetric setup where smart money engineers aggressive rallies. Upcoming Network Upgrades
⚙️ The network is executing a major structural evolution with the rollout of the xrpld version 3.3.0 software package to the main net validators.
🔒 The headline feature is Confidential Transfers, giving institutions the power to encrypt balances and payment amounts for Multi-Purpose Tokens while keeping the account architecture verified and visible.
🤝 We are seeing the return of Batch Transactions, a feature allowing up to eight cross-account transfers to group atomically under a strict all-or-nothing settlement principle to optimize costs.
🏛️ The upgrade introduces Permission Delegation, allowing corporations to assign narrow, highly specific signing authorities to users without ever exposing full control of their primary wallets.
💎 A new Sponsored Fees and Reserves mechanism will finally allow financial institutions to absorb network gas costs and baseline account reserves directly on behalf of their end users. Wall Street Tokenized Assets
🏦 When we look closer at who is prepping for these new privacy upgrades, it is clear that the ledger is positioning to safeguard roughly $530 million in existing institutional tokenized real-world assets.
💵 Out of the $1.38 billion total value locked on the ledger, Ripple’s own RLUSD stable coin holds down $845.7 million, making it the primary liquidity layer for these upcoming private transactions.
📈 Major financial players like Ondo Finance are tracking this closely as their $212.6 million in tokenized offerings require strict transaction confidentiality to scale without exposing corporate strategies.
💼 Infrastructure funds from VERT Capital representing $116.1 million are optimizing for these changes to allow clients to settle transactions without displaying capital pool sizes publicly.
👑 Institutional brokerages like Archax with $55.4 million on-chain are preparing to use zero-knowledge proofs to meet compliance mandates while hiding sensitive order book volumes.
🗼 Heavyweight global banking giants like Société Générale are testing the waters with $11.6 million tokenized on the XRPL, paving the way for confidential corporate bond issuance.🗺️ This collective shift fits perfectly into the broader 2026 Wall Street migration where giants in the DTCC Tokenization Working Group are actively building the enterprise rails to take traditional finance completely on-chain.
🤝 Thank you so much to everyone tuning in to today's update. Your support means everything to me, and I appreciate you taking the time to break down these markets together. Stay sharp out there, and I will see you all in the next one.
Best regards,
~ Rock '
XRP Whales only.Xrp around $1.00 -- $0.65 great area to build a position for a retest of highs, or at the very least get a bounce back to $2.00.
Not really a fan of XRP for many reasons, but the trade is there.
If you want to be more cautious you can wait for a break of the downtrend and a retest, which will happen in a few months if we get the bounce from the whale zone.
If you're impatient like me, you can just buy in the range and forget about it.
XRP/USD: Fresh Bearish BoS Below 1.0128 Opens Path to 0.9915XRP just printed a bearish BoS on the 4H at 1.0128 six bars back, and price is now hanging in the lower half of the volatility band at 1.0193. Trend bias flipped to Downtrend, with EMA55 sitting overhead at 1.03945 and EMA21 at 1.0236 — both are stacked against price, and the prior swing low that got taken out (1.0128) now flips into resistance-on-retest. The last swing high at 1.0488 is still open but 21 bars stale, so the structural pressure is clearly on the downside on this timeframe.
What makes the setup interesting: the BoS is fresh (6 bars) and the band lower sits at 1.006792, meaning there's still room before price gets stretched. If sellers keep control on a retest of the broken 1.0128 level, that's the trigger zone I'm watching — a rejection there confirms the flip. Any reclaim back above EMA21 at 1.0236 with a clean 4H close would invalidate the bearish read, and a push through EMA55 at 1.0394 kills it entirely.
Targets stack cleanly from here: first the band lower at 1.0068, then the round 1.00 handle, and the window low at 0.9915 as the extended objective if momentum keeps building. Not a chase — the edge is in waiting for the retest reaction.
Setup: Watching for a retest and rejection of the broken 1.0128 swing (now resistance) with EMA21/EMA55 stacked overhead.
Invalidation: A 4H close back above EMA21 at 1.0236 neutralises the setup; above EMA55 at 1.0394 kills it entirely.
Targets: 1.0068 — band lower, first reaction zone · 1.0000 — round-number magnet · 0.9915 — window low, extended objective
XRP Market Update | Smart Money Strategy | Accumulation Zones Back in July 2024, we shared our analysis on XRP highlighting a long-term symmetrical triangle pattern forming on higher timeframes. At that time, XRP was trading near $0.40, and we clearly anticipated a major breakout phase leading into 2025.
As expected, XRP delivered strong performance, rallying up to approximately $3.7 by August 2025. This move aligned with our projected timeline and reinforced one key principle:
In trading, exit matters more than entry.
Many traders focus only on entering the market, but real profits are made when you exit strategically.
Current Market Phase, Bearish Pressure & Smart Money Play
Right now, XRP is trading around the $1 zone, and the market is clearly transitioning into a bear phase . Based on current price action, liquidity behavior, and smart money concepts, we anticipate a planned market dump extending into October 2026 .
This phase is typically driven by institutions to:
* Shake out weak hands
* Remove early retail positions
* Create fear before the next expansion
If you are building positions too early, the market will likely force you out before the real move begins.
Accumulation Strategy (Key Zones)
Patience is critical.
We are looking to accumulate XRP in the following high-probability demand zones:
$0.70 – $0.40 (Primary Accumulation Range)
Spot traders can place limit orders in this zone.
Futures traders (with proper risk management) can also build long-term positions .
This is where smart money typically accumulates before the next cycle begins.
Next Bull Run Outlook (2026–2029)
Looking ahead, the next major crypto bull cycle is expected to build momentum after the 2026 bottom, with expansion continuing into March 2029 .
Our long-term outlook for XRP remains strongly bullish based on:
* Market cycle theory
* On-chain data insights
* Liquidity structures
* Institutional behavior
🎯 Projected Target: 3$ - $10+ in the Upcoming Bull Run Till Q1 2029.
Exit Strategy (Most Important)
No matter where price reaches by March 2029:
👉 We exit the market by the end of March 2029.
Do not trade based on emotions.
Do not get greedy during peak euphoria.
Follow data. Execute with discipline.
Final Note
The market rewards patience, not impatience.
Let the market come to your levels, not the other way around.
For more high-quality analysis like this, follow us on TradingView so you never miss our upcoming ideas. Share your thoughts in the comments and let us know which coin or project you want us to analyze next, we’ll be happy to provide detailed insights.
XRP — Wyckoff Accumulation + Macro Trendline Test (2026)XRP is in a textbook Wyckoff accumulation phase. The spring came in at $0.75 (2025), flushing the last sellers and marking the cycle low. Now we're in the test phase, with price coiling in the $1.00–$1.10 range — this is where weak hands get shaken out before the next leg up.
Whale data confirms the setup: large holders are quietly absorbing supply, with neutral CVD suggesting passive accumulation, not aggressive chasing. This is a basing range, not a breakout — yet.
The invalidation level is clear: a weekly close below $0.75 breaks the structure. If that holds, the next trigger is a break above $1.20 with volume — that would be the Sign of Strength (SOS) that kicks off the markup phase.
Targets are straightforward: $1.21–$1.30 for the first scale-out, with a macro target of $3.00–$5.00 by the boom cycle. The risk/reward is compelling at these levels.
Key Levels:
• 2020 Low: $0.17 — Macro trendline origin*
*• 2022 Bottom: $0.28 — Trendline held
• 2025 Spring: $0.75 — Cycle low*
*• 2026 Test: $1.00–$1.10 — Current accumulation zone
Current Setup (Wyckoff):
• Spring: $0.75 (2025) — Last sellers flushed*
*• Test: $1.00–$1.10 (2026) — Retesting the spring zone*
*• Invalidation: Weekly close below $0.75
• SOS Trigger: Break above $1.20 with volume
Whale Activity:
• XRP whales are accumulating in the $1.00–$1.20 range
• Neutral CVD suggests absorption, not aggressive buying
• Realized price: $0.75 — current price is ~$1 (above cost basis)
Targets:
• Initial: $1.21–$1.30 (First scale-out)
• Intermediate: $1.50–$2.00 (Breakout target)
• Macro: $3.00–$5.00 (Boom Cycle)
Risk Note: A weekly close below $0.75 would invalidate the accumulation structure. Until then, this range is a low-risk accumulation zone for patient traders.
NFA / DYOR — just sharing the levels I'm watching. What's your take on XRP?
XRPUSD Breakdown Below 09765 Could Extend LossesXRP remains under bearish pressure after spending nearly three months inside the 1.1718–1.0253 range. Uncertainty around the CLARITY Act and broader US crypto regulation continues to weigh on sentiment.
A confirmed breakdown below 0.9765 could strengthen the decline and open the way toward 0.8789 and 0.7812. The Bollinger Bands and MACD continue to support the bearish scenario, while the weekly structure also resembles a flag pattern.
The bullish scenario would require a breakout and consolidation above 1.1718. In this case, XRP could recover toward 1.3671, 1.4648 and 1.6420.
Support: 0.9765, 0.8789, 0.7812
Resistance: 1.1718, 1.3671, 1.4648, 1.6420
XRP Still Has HUGE Long-Term Potential With THIS Pattern!Hello There,
welcome to my new analysis of XRP from a weekly timeframe perspective. In the current cryptocurrency market, there are still coins that have long-term potential despite smart money influence on bear-market prices. In recent times, I spotted the underlying gems with strong potential to expand bullishly in the upcoming times. One of them is XRP this coin is forming an underlying pattern with huge potential.
When looking at my chart, we can see how XRP trades within this gigantic long-term ascending trend channel. In this channel, XRP already completed several bullish expansions towards the upside. The origin of those expansions was always the descending wedges in which XRP completed the ABC wave counts and bounced within the lower boundary. In the previous bullish expansions XRP made at least 10X completing these patterns.
Right now, XRP is forming a very similar pattern. This pattern is likely to form the origin of the bullish expansion when it completes correctly, once again. At the moment, XRP is still trading in a downtrend. However, it has the potential to complete the wave count and bounce in the lower boundary once again. When this happens, and the descending wedge completes as seen in my chart, the potential for the next bullish expansion wave increases tremendously.
As has been seen in past bullish wave expansions, the target of the descending wedge was always the upper boundary. This will also be the case in the upcoming bullish wave expansion when the pattern completes. Fundamental factors also support the bullish wave in the long-term. XRP can continue business in the EU and expand its digital asset management. It continues strategic acquisitions and on-chain expansion.
In the upcoming times, it will be highly important to watch how XRP approaches the support levels within the wedge formation and how the conditions are when it approaches the lower boundary. If the bounce in this area happens and XRP manages to break out, the next wave will likely be loaded, completing the historical pattern anew.
In this manner, thank you a lot for watching!
The support is highly appreciated.
VP
XRP/USD Technical Analysis📊 XRP/USD Technical Analysis 🚀 | Bearish Channel Reversal Setup
XRP remains inside a well-defined descending (bearish) channel, with price continuing to respect both the upper and lower trendlines. The recent decline has pushed price into a strong Order Block (OB) / demand zone, where buyers are beginning to react. This area could become the foundation for a short-term bullish recovery if it successfully holds.
🔍 Market Structure
📉 Overall trend remains bearish while price trades inside the descending channel.
🛡️ Price is testing a high-probability Order Block (OB) near channel support.
⚡ A temporary liquidity sweep below the OB is possible before a stronger bullish move.
📈 A confirmed bullish rejection from this zone could trigger a recovery toward the channel's midline and eventually the upper resistance.
🎯 Bullish Scenario
✅ Hold above the Order Block.
✅ Break above the recent lower highs.
🎯 Initial target: 1.05 – 1.06
🎯 Main target: 1.08 – 1.09 (upper channel resistance)
⚠️ Bearish Scenario
❌ A decisive close below the Order Block and channel support would invalidate the bullish setup.
📉 In that case, sellers could extend the downtrend toward lower support levels.
💡 Trading Idea
Patience is key. Wait for a strong bullish confirmation candle or market structure break before entering long. Until then, XRP remains in a broader bearish trend, but the current demand zone offers a potential high-reward reversal opportunity.
📌 Trading Bias
🟡 Short-Term: Bullish rebound possible from the Order Block.
🔴 Overall Trend: Bearish until the descending channel is broken.
🎯 Key Focus: Watch for confirmation before targeting 1.08–1.09.
Long Term Structure Is Still Alive $XRP
XRP has spent nearly eight years building beneath the same major resistance region.
2018 cycle peak established the ceiling near $3.60, and the 2025 expansion returned to that level before another rejection. Price has now moved back toward the rising support structure that has guided every major XRP cycle since 2017.
This decline should not be read only as weakness. XRP is testing the lower side of a long term expanding structure while remaining far above the major lows of previous cycles. The market has corrected through price and time, but the broader rising base remains intact. central level is still the historical 3.60 ceiling. A future move beyond this region would end years of compression and open a completely different repricing phase. The chart would no longer be dealing with another recovery toward the old high, but with price discovery above a resistance that has controlled XRP since 2018.
current location is therefore structurally important. XRP is approaching long term support after another failed test of the historical ceiling. This is the type of region where the next major cycle leg can begin before the wider market recognizes that the structure has changed. chart is not showing a dead asset. It is showing an asset still building beneath one of the longest resistance structures in crypto. next expansion begins when years of compression finally give way.
XRP Is Holding Support, but Institutional Demand Remains QuietXRP has returned to the same area that previously stopped selling pressure, but the broader chart still looks weaker than the support reaction alone suggests.
Price is holding just above 1.00 on the four-hour chart. That is important because the area has already attracted buyers before.
But holding support and reversing a trend are two different things.
The first real obstacle remains the descending trendline above current price. Until buyers can break that structure, the latest reaction should be treated as stabilisation rather than confirmation of a new advance.
There is also an interesting contradiction outside the chart.
U.S. spot XRP products still hold close to one billion XRP, but fund activity became much quieter through July. Several sessions recorded almost no net creations, even while price attempted to recover. More recent data points to a modest improvement in inflows, but nothing comparable with the stronger institutional demand seen earlier in the year.
That matters because easier institutional access was supposed to create a more consistent source of demand.
So far, access has improved faster than conviction.
At the same time, the XRP Ledger continues to expand beyond the token itself. Traditional asset managers and financial institutions are increasingly experimenting with tokenised assets and settlement infrastructure connected to Ripple's ecosystem. That strengthens the longer-term network story, but the market is not yet rewarding it with stronger price structure.
What the chart shows
The four-hour structure remains bearish beneath the descending resistance line.
Lower highs are still visible, while the 1.00–1.02 support area is preventing a cleaner continuation lower.
That creates a useful tension: sellers still control the trend, but they are struggling to push through an area where buyers have responded before.
Primary interpretation
The stabilisation scenario remains valid while the higher-time-frame support area holds.
It gains credibility if XRP begins forming higher lows and then breaks the descending trendline with sustained four-hour acceptance above it.
That would not immediately repair the broader structure, but it would show that sellers are losing control of the short-term trend.
Alternative interpretation
The alternative is that support is only delaying another leg lower.
That scenario becomes more credible if rebounds continue to fail beneath trendline resistance and price begins closing consistently below 1.00.
In that case, the lack of stronger ETF participation would become more relevant because technical weakness would no longer have a clear institutional counterweight.
What would change the current view
The cautious interpretation would weaken after a sustained break above the descending trendline.
The stabilisation thesis would fail if the current support area gives way without a quick recovery.
The 1.16–1.18 region remains the larger resistance zone and would require a much stronger change in market behaviour.
What comes next
The next thing to watch is not another headline, but whether improving institutional access finally produces stronger follow-through in price.
XRP has found support, but buyers still have to prove that demand is stronger than the downtrend.
XRP/USD: Bearish BoS Below 1.0473 Extends Downtrend Toward 1.015XRP is trading at 1.0261, sitting below the lower volatility band (1.0336) with the STC panel flashing a clear downtrend bias. EMA21 sits at 1.0527 and EMA55 above at 1.0669 — both stacked bearishly and now acting as overhead resistance. The headline event is the fresh bearish BoS from 7 bars ago that took out the 1.0473 swing low, and that broken level is exactly the ceiling I'm watching on any bounce.
Structurally this matters because the last swing high at 1.0933 is still open 26 bars back, so the sequence of lower highs and lower lows is intact on the 4H. Price closing below the band is a stretched condition, so a mean-reversion pop toward EMA21 is on the table — but that's the sell zone in this regime, not a trend change. Nothing shifts until price reclaims EMA55 with an ATR-buffered close.
The setup activates on a rejection back into the 1.0473-1.0527 band (broken swing plus EMA21). Continuation trigger is a fresh 4H close below 1.0261, opening the path to the window low.
Invalidation: a 4H close back above 1.0669 (EMA55 reclaim) kills the bearish structure and forces a rethink.
Targets: 1.0150 — window low and next liquidity pocket. 1.0000 — round number, obvious magnet if the low gives way. On any relief bounce, 1.0473 is the first level to watch reactions.
Setup: Bearish continuation activates on rejection at the 1.0473-1.0527 broken-swing/EMA21 zone or a fresh 4H close below 1.0261.
Invalidation: 4H close above EMA55 at 1.0669 invalidates the bearish structure.
Targets: 1.0150 — window low, next liquidity pocket · 1.0000 — round-number magnet if window low breaks · 1.0473 — first reaction level on any relief bounce
XRP Ready to Rebound?XRP is trading at one of the most significant technical regions on its chart, with price consolidating around a major monthly support that could determine the next directional move. Rather than breaking lower, price has continued to stabilise within this zone, suggesting buyers are actively defending an area of strong technical confluence.
The current support aligns with the Value Area Low (VAL) of the existing trading range, highlighting a region where market participants have previously shown strong interest. Adding further significance is the 0.618 Fibonacci retracement, creating multiple layers of technical support within the same price region. When several indicators converge at one level, the probability of a meaningful reaction tends to increase.
As long as XRP continues holding above this support over the coming days and weeks, the market maintains the potential for a bullish rotational move. Such a scenario would place emphasis on the next major monthly resistance around the $1.30 level, which represents the primary upside objective if momentum begins to strengthen.
While confirmation is still required, the current consolidation suggests the market is building a base rather than accelerating lower. A sustained defence of monthly support would reinforce the bullish outlook and increase the probability of buyers regaining control.
For now, XRP remains at a critical decision point, with this high-confluence support zone likely to determine whether the next major move is a rotation higher or a continuation of the broader correction.
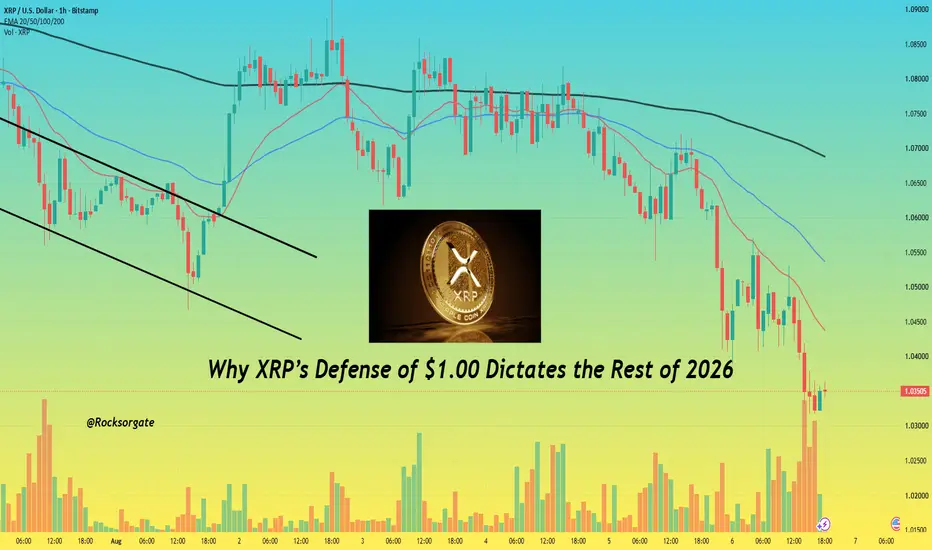
Why XRP’s Defense of $1.00 Dictates the Rest of 2026We are officially at a massive crossroads with XRP. Right now, the price is clinging to the $1.04 to $1.05 range after a brutal four-day slide, and the psychologically vital $1.00 level is firmly back in the crosshairs. If you've been tracking this cycle, you know that how we handle this dollar boundary over the next week is going to dictate the macro trend for the rest of the year.
My Technical & Fundamental Breakdown
⚡The $1.05 Floor Cleared Out: We just lost the critical $1.05 horizontal floor that kept a lid on downside volatility since June. Because we didn't just flash-crash through it, but instead suffered a slow, painful grind downward, this former support has now locked in as a heavy overhead resistance zone that sellers will aggressively defend on any bounce.
⚡ Moving Averages Trapping Price: The daily chart looks ugly, with the spot price trapped well below both the 20-day EMA ($1.08) and the 50-day EMA ($1.12). Until we can print a decisive daily close above the $1.16 swing high, the bears hold the steering wheel and any minor pumps are just relief rallies.
⚡ The Golden Pocket Line in the Sand: On the macro chart, the $1.00 mark isn't just a round number—it perfectly aligns with the 0.618 Fibonacci retracement level from our multi-year lows. If $1.00 snaps on high volume, the bullish market structure breaks completely, opening the door for a painful drop down to the sub-$0.90 retest zones.
⚡ ETF Inflows Have Completely Dried Up: The institutional hype has hit a major wall, with U.S. spot XRP ETFs bleeding out $3.58 million in net weekly outflows. Without Wall Street aggressively bidding up the order books right now, the price is entirely at the mercy of retail volume, which is completely dried up.
⚡ Whale Divergence vs. Retail Panic: Even though retail investors are panic-selling, on-chain data shows wallets holding over 100,000 XRP are quietly vacuuming up supply, keeping exchange balances at multi-year lows. We are seeing a massive transfer of wealth from weak hands to smart money right at this $1.00 accumulation block.
⚡ The Policy Catalyst is Dead for Now: On the regulatory side, our immediate tailwinds just evaporated because the U.S. Senate delayed the formal vote on the CLARITY Act until after their recess. With no legislative savior coming this month, XRP has to rely purely on its own technical grit to defend the dollar floor.
⚡ As always, thanks for tuning in. Appreciate it and have a great day.
Best regards,
~ Rock '
XRP/USD: Downtrend Pins Price Below EMA55, 1.0473 in FocusXRP is trading at 1.0681 on the 4H with trend bias still down. Price sits in the lower half of the volatility band (upper 1.0902 / lower 1.0590), stuck under both EMA21 at 1.0746 and EMA55 at 1.0788 — the trend backbone is capping every push. The last confirmed break of structure was bearish at 1.085 fifty bars back, and while the swing high at 1.0933 (14 bars ago) hasn't been touched, the swing low at 1.0473 remains open too. That's the level the tape's leaning toward.
Why it matters: as long as EMA55 rejects, sellers own the 4H. ATR at 0.0104 says daily range is compressed, which typically resolves with a sharper move once one of these swing lines gives. The path of least resistance is a retest of 1.0473 before bulls get a real chance.
Setup to watch: continuation activates on a clean 4H close below 1.0590 (band lower), opening the door back to 1.0473. Reclaim scenario needs a close back above EMA55 at 1.0788 to neutralise the bearish read.
Invalidation: a 4H close above 1.0933 breaks the last swing high and flips the structure — the bearish idea is done there.
Targets: 1.0590 — band lower edge, first magnet. 1.0473 — open swing low, the real test. 1.045 — window low, cushion beyond structure.
Setup: Rejection at EMA55 with a close below the 1.0590 band lower activates continuation toward the open swing low.
Invalidation: 4H close above the 1.0933 swing high invalidates the bearish structure.
Targets: 1.0590 — lower band edge, first magnet · 1.0473 — open swing low, structural test · 1.0450 — window low, cushion target
XRP: Everything Improved — Why Is It Still Correcting?XRP: The Bigger Question
XRP has received almost everything investors have been waiting for.
The regulatory situation has improved dramatically. Ripple has continued expanding its payment infrastructure. Institutional investment products have appeared. XRPL activity remains significant. RLUSD has grown quickly, and Ripple continues to push deeper into institutional finance.
Yet there is one uncomfortable question:
Why has XRP still failed to establish a clear long-term Bullish structure since its 2018 peak?
This analysis looks at XRP from two different sides:
Fundamentals — what is actually happening behind the asset.
NeoWave — what the long-term price structure is telling us.
Interestingly, the two tell a story that is more similar than it first appears.
1. XRP Is Not Fundamentally Weak
Before looking at the problems, one thing should be made clear:
XRP is not simply an empty speculative token.
The XRP Ledger is a functioning payment network built around fast settlement and extremely low transaction costs. Transactions generally settle within seconds, the network has operated for more than a decade, and the total XRP supply was fixed at 100 billion from inception.
That gives XRP a real technological foundation.
Ripple has also spent years building relationships with financial institutions and payment companies around the world.
So the question is not:
Does XRP have technology or infrastructure?
It clearly does.
The more important question is:
How much of Ripple and XRPL's growth actually creates demand for XRP itself?
And this is where the fundamental picture becomes much more complicated.
2. Ripple Adoption Is Not the Same as XRP Adoption
This may be one of the most important distinctions when analyzing XRP.
Ripple has built a large payment network and has worked with hundreds of banks and payment providers.
But using Ripple's infrastructure does not automatically mean those institutions are using XRP.
Many participants can use Ripple's payment technology without holding or settling through XRP. The research shows that only a portion of these payment corridors actually use XRP directly, while many institutions still prefer other settlement methods.
This means Ripple and its infrastructure can continue expanding while direct demand for XRP develops at a different pace.
That helps explain why years of business expansion have not yet produced an obvious long-term structural transformation in the token itself.
3. The Network Is Active — But Growth Is Mixed
XRPL is not inactive.
The network processes a large number of transactions, has millions of funded accounts, and continues to support payments, tokenized assets, stablecoins and decentralized exchange activity.
But there is another side to the data.
The research shows that while XRPL reached around 8 million funded wallets, new-wallet creation slowed significantly compared with 2025, while daily active-wallet figures also remained relatively modest.
So the most accurate description is not:
“XRP adoption is exploding.”
And it is also not:
“Nobody uses XRP.”
The reality is somewhere between the two.
XRPL has real usage, but user growth and direct XRP adoption are still mixed.
That matters because XRP already carries a large valuation.
For a completely new long-term bullish price regime to develop, eventually the market will need evidence that adoption is growing fast enough to justify that valuation and much more.
4. RLUSD: Good for Ripple — But What About XRP?
RLUSD makes this discussion even more interesting.
Ripple's stablecoin gives institutions a regulated dollar-denominated asset that can operate inside the Ripple/XRPL ecosystem.
That is clearly positive for the ecosystem.
But it creates another question:
If institutions can settle using a stable dollar asset, how much XRP do they actually need?
The research describes RLUSD as a double-edged development.
It can attract more institutions and activity to XRPL, while at the same time potentially reducing the need to use volatile XRP as the bridge asset for certain transactions.
So RLUSD may strengthen the overall ecosystem without necessarily creating the same level of additional demand for XRP.
That relationship will be important to watch over the next several years.
XRP Faces Strong Competition in Global Payments
XRP does not operate alone.
Its role as a bridge asset for cross-border payments competes with several alternative ways of moving and settling value, including:
USDT and USDC.
Other stablecoins.
Traditional banking rails.
SWIFT.
Visa and other payment networks.
Stellar and other blockchain-based payment systems.
Tokenized bank deposits.
And potentially CBDCs.
Ethereum and Solana also compete indirectly by supporting large stablecoin and tokenized-finance ecosystems that institutions can use instead of XRPL.
The important point is that these alternatives do not all compete with XRP in exactly the same way.
Stablecoins are especially important because they can perform some of the same settlement functions while avoiding XRP's price volatility.
So XRP's speed and low cost are real advantages.
But they are no longer enough by themselves.
The real question is:
Can XRP become necessary enough that institutions must create meaningful demand for the token?
That has not yet been proven.
6. Now Look at the Price Structure
This is where the fundamental picture begins to connect with the technical picture.
XRP experienced an extraordinary long-term advance beginning in its early history and culminating around the 2018 peak near $3.3.
Whatever higher-degree label is ultimately assigned to that advance, one thing is much clearer:
The behavior after the 2018 peak is completely different from the behavior before it.
Since then, XRP has spent years moving through a large overlapping structure rather than developing a clean, sustained Bullish trend.
Under my current interpretation, the structure developing since the 2018 peak appears consistent with a large Diametric correction.
Importantly, this is a working interpretation rather than a final declaration. A Diametric must ultimately satisfy the required seven-wave structure together with the appropriate relationships in time and complexity.
The developing sequence is:
A → B → C → D → E → F → G
The current structure appears to have developing through the Wave E region, meaning the larger correction may still require additional stages before it can be considered complete.
7. A Correction Does NOT Mean XRP Goes Straight Down
This is extremely important.
If this is a Diametric, saying that XRP may remain Bearish for several more years does not mean XRP has to fall continuously for several years.
A Diametric contains seven separate segments.
That means the remaining structure could potentially involve:
E — another declining phase (Which is the current phase)
followed by:
F — another significant rally
and eventually:
G — the final stage of the correction
So XRP could still experience very large bullish moves while remaining inside a larger corrective structure.
That is one of the biggest misunderstandings traders have about long-term corrections.
A strong rally does not automatically mean a correction has ended.
This Is Where Fundamentals and chart Agree
This is the most interesting part of the analysis.
Fundamentally, XRP is in a mixed position.
Its regulatory environment has improved, institutional infrastructure has expanded, Ripple continues to grow, and the network remains active.
These developments can support confidence, liquidity and significant rallies.
At the same time, direct XRP usage is still less convincing than the broader growth surrounding Ripple and XRPL. User growth is mixed, stablecoins are becoming stronger competitors, and XRP faces increasingly capable alternatives in global payments.
That combination fits the price structure surprisingly well.
XRP has enough fundamental strength to support major bullish movements, but the evidence does not yet clearly show the kind of adoption shift that would demand a completely new long-term impulsive regime.
The fundamental picture therefore does not conflict with the developing Diametric.
It helps explain why strong rallies can continue to occur while the larger correction remains unfinished.
9. The Most Important Contradiction
This may be the biggest question XRP investors should ask:
XRP's fundamental environment has improved substantially — so why hasn't the market structure changed?
The regulatory battle largely disappeared. Institutional access improved. Ripple continued expanding and new financial infrastructure appeared.
Yet XRP may still be developing within the correction that began after the 2018 peak.
The research reaches a similar conclusion from another direction: XRP's technology and infrastructure have strengthened, but actual token usage has not yet expanded enough to unquestionably justify substantially higher valuations.
That does not mean XRP cannot eventually reach much higher prices.
It means the fundamental transformation required to support them may still be developing.
10. What Would Change This View?
Both sides of the analysis can eventually prove this interpretation wrong.
Fundamentally, I would want to see clear evidence that:
direct XRP settlement is expanding materially
institutional XRP demand is accelerating
active-user growth is increasing
XRP is gaining a durable role that stablecoins cannot easily replace
and that this growth is happening in XRP itself rather than only in Ripple or XRPL.
Technically, the NeoWave structure must continue respecting the rules required for the developing Diametric.
If future price behavior begins violating the expected relationships in price, time, complexity or structure, the count must be reconsidered.
The market decides the structure — not the analyst.
Conclusion
XRP presents an unusual situation.
Its fundamental story is considerably stronger than it was several years ago.
The network works. Ripple continues expanding. Regulatory uncertainty has fallen, and institutional access has improved.
Yet the price structure still suggests that the correction beginning after the 2018 peak may remain unfinished.
Under the current NeoWave interpretation, XRP appears to remain inside a developing Diametric correction.
If that interpretation remains valid, the correction could require several additional years to fully complete.
But that should not be misunderstood as several years of continuous decline.
The larger question is whether XRP's improving fundamentals eventually translate into enough direct demand for the token to produce a genuine structural change.
For now, the fundamentals and the price structure remain compatible: progress is real, but the long-term transition may not be complete yet.