XRP/USDC: Institutional Accumulation Pattern📊 Strategy Overview: Volume-Driven Breakout Setup
This setup is based on on-chain order-flow divergence and volume profile analysis, not retail sentiment. The price action between $1.09–$1.10 shows signs of stealth accumulation, with sell-side imbalance noted at -11.8%. Declining volume suggests the accumulation phase may be nearing completion, potentially leading to a volatility expansion.
🔍 Technical Confluence (15-Min Adjustment)
Indicator Observation
Volume Profile (VPVR) Resistance shelf visible at $1.1020–$1.1050. A clean break above this zone is required for upside continuation.
Donchian Channel (20, 0) Upper band: $1.1032 (breakout trigger). Lower band: $1.0965 (key support). Price is currently compressing near the midpoint.
EMA Cross (9 & 26) Moving averages are converging at ~$1.0996. A bullish cross would add momentum confirmation.
Volume Filters Recent "Marubozu White" (286% avg vol) and "Hammer" (153% avg vol) patterns suggest institutional footprint.
📌 Execution Framework
Stage 1 – Potential Liquidity Sweep:
A wick toward $1.0965–$1.0970 may occur to clear weak hands before any directional move. This is common in low-liquidity environments.
Stage 2 – Breakout Confirmation:
A 15-minute candle close above $1.1032 would confirm a breakout from the current compression zone.
Stage 3 – Targets (Based on Structure):
TP1: $1.1138 (first VPVR ceiling)
TP2: $1.1205 (~2.5% from entry)
Stage 4 – Risk Rule:
A 15-minute close below $1.0940 (below Donchian lower band) invalidates the accumulation thesis. In that case, risk management should be prioritized, and the trade should be exited.
🧠 Final Thought
The structure suggests a potential breakout if key resistance is cleared. However, low timeframes remain susceptible to volatility and false breaks. Patience and strict risk management are essential. Always adjust position size according to your risk tolerance.
In-depth trading ideas
Long trade
Trade Ticket
Item Detail
Pair XRPUSDC.P
Direction Buyside
Session NY AM
Date / Time
Tue 7th July 2026
10:45 AM
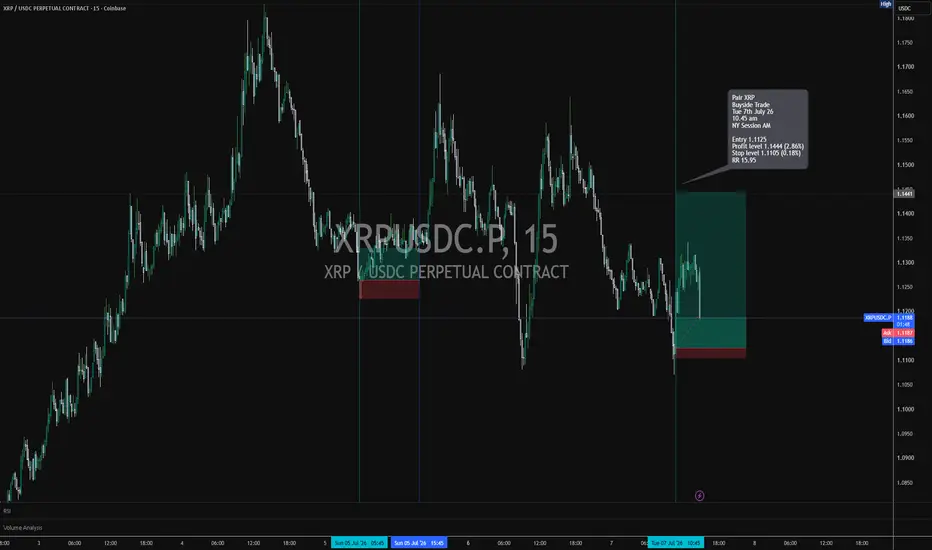
Entry 1.1125
Profit L 1.1444
Stop Level 1.1105
RR 15.95
Chart 5m
Setup Type
Sell side purge → NY AM reclaim → buyside expansion
This XRP buyside idea is built from a clean NY AM manipulation sequence.
Price first traded lower into sellside liquidity, taking the low around the 1.1106 / 1.1071 zone. That move created the purge. After the purge, price quickly reclaimed the trade entry region above 1.1125, indicating that the sellside move had failed to continue.
The trade is not based on chasing strength. It is based on buying after the market swept sellside liquidity, recovered the low, and began expanding back through the session range.
The target at 1.1444 is the upper SRL liquidity objective, sitting near the daily open/daily high region. The trade remains valid as long as the price holds above 1.1106.
The Market Is Showing Its HandMost traders wait for the move.
Professionals watch where the move is likely headed.
This asset continues to defend demand while repeatedly targeting the same liquidity pool above. That's not random—it's how markets seek liquidity.
✅ Demand remains respected.
✅ Liquidity remains untouched.
✅ Supply sits above as the final test.
A simple lesson:
When price keeps returning to a level, it's usually interested in what's beyond it.
The goal isn't to predict.
The goal is to understand where the market is hunting next.
#XRP
XRP - Breakout + RetestThis is an update to my last idea:
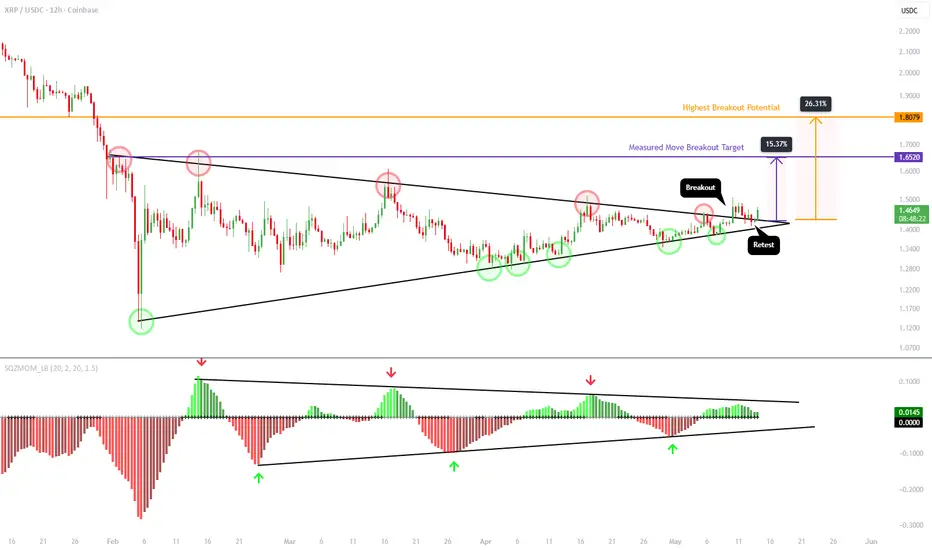
On May 5th I published that idea pointing out XRP was preparing for a massive breakout or breakdown from its symmetrical triangle. On May 9th the breakout occurred, followed by a bullish retest on May 11th-12th. XRP did close one 12H candle below the upper black trendline but immediately reversed and closed back above it on the very next candle, signaling a successful retest with no reclaim of the pattern below.
This gives price two upside targets.
The first and primary target is the measured move for XRP, which puts price back around $1.61-$1.65. This is the first level to watch for any profit taking.
If price is able to push higher, the highest I see XRP reaching with this breakout rally is the $1.77 to $1.81 level. This was first established as significant support all the way back in February 2025 and held as a major support level until it broke below on January 30, 2026. That old liquidity zone of significant demand will now act as a meaningful supply level for offloading and profit taking if price is able to rally back up to that region. It is also worth noting that the $1.77 level is the 0.5 Fibonacci of the current trend.
The good news is price can still see another 10 to 20% move to the upside even from current levels. But once price does reach those upside targets, watch closely how market participants react. If sellers start unloading at those levels that will be your signal that the breakout move for this particular pattern has come to an end.
One other thing to keep in mind, if for whatever reason, price sees a massive reversal back to the downside and closes below the lower black trendline then that would be an invalidation of this idea and breakout. Seems unlikely at the current moment, but something to keep in the back of your mind.
XRP Price TargetIf you haven`t bought XRP before the rally:
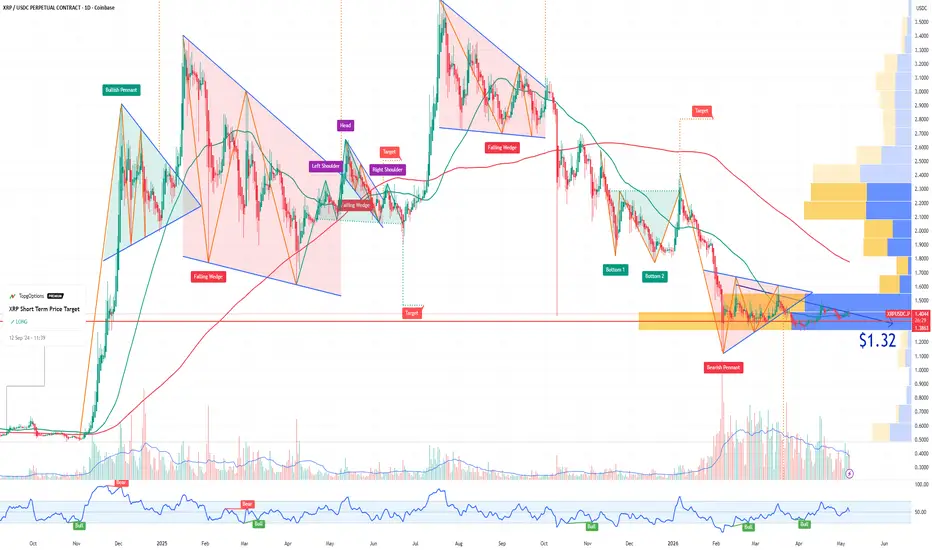
Technical vulnerability at key support: $1.32 has been the major bounce zone since February 2026, but XRP is showing repeated failure to break above $1.45–$1.50 resistance. A descending pattern and loss of $1.40 support could quickly send price back to the $1.30 level, with a clean break opening the door to $1.17–$1.28.
Macro headwinds for risk assets: Sticky inflation, elevated energy prices, and the Fed’s cautious rate-cut outlook continue to pressure high-beta altcoins like XRP. Any broader risk-off move or equity pullback hits XRP hard due to its tight correlation with Bitcoin and overall market sentiment.
On-chain and sentiment fatigue: Trading volume remains weak (often below $2B), open interest is contracting, and retail participation has cooled despite ETF inflows. Whale distribution on minor rallies and lack of fresh catalysts (CLARITY Act delays or muted Ripple news) increase the odds of a corrective move
What serious analysts & outlets are saying:
247wallst: XRP trapped in $1.30–$1.55 range all year if CLARITY Act stalls; bears have stalled every rally.
BeInCrypto / Binance Square: Breakdown below $1.30 invalidates bullish patterns and targets lower supports.
Finbold AI & CoinEdition: Near-term consolidation or drop toward $1.37–$1.30 likely without strong volume or institutional buying.
Motley Fool (short-term notes): Structural headwinds and lack of catalysts could keep XRP under pressure in 2026.
Bottom line: Technical weakness around current resistance, ongoing macro caution, low volume, and repeated tests of the $1.32floor make a retest of $1.32 a high-probability scenario in the coming weeks.
XRP - Preparing for a Big MoveXRP is preparing for a massive breakout or breakdown from a symmetrical triangle that has been forming since early February.
There have been a clear series of lower highs (red circles) and a clear series of higher lows (green circles), with price now nearing the apex of the triangle where a decisive move in either direction will occur. Once that happens I will update this idea with the corresponding targets depending on which direction is chosen.
Since symmetrical triangles are typically continuation patterns, the bias is toward the downside. In addition to that, this pattern could also be interpreted as a bear pennant, looking to continue the move lower after the current period of consolidation.
One other thing worth noting is the squeeze momentum indicator at the bottom of the chart. This indicator is designed to identify low volatility consolidation periods that precede explosive breakouts and that is exactly what it is signaling right now.
Momentum is fading in both directions. Bulls are losing strength with every test to the upside as price creates lower highs, with the indicator also creating lower highs (red arrows). Bears are losing strength with every test to the downside as price creates higher lows, with the indicator also creating higher lows (green circles).
This gives additional confirmation that a directional decision is approaching fast and an explosive momentum move in one direction is imminent.
MA indicating strong buy on the 4hr chartMulti-Timeframe Breakout and Recovery Analysis
Analysis window: 3 Apr 2026, 20:00 - 16 Apr 2026, 08:48
Analysis of the provided chronological data indicates a transition from a macro downtrend into a firm consolidation phase, followed by a recent bullish breakout. The daily timeframe shows strong base-building above the 1.3000 level, while the 1-hour and 6-hour timeframes demonstrate consistent higher lows and higher closes, pushing the asset to the actual current mark price of 1.4091. This analysis suggests a long position targeting historical resistance levels, protected by a stop loss below the recent 6-hour support structures.
Flat Bottom in a Disjointed Channel within a Bear Marketwww.tradingview.com
Flat Bottom in a Disjointed Channel within a Bear Market
Introduction
In the realm of technical analysis, recognizing price patterns is essential for navigating the complexities of financial markets. One particular formation that traders may encounter in a bear market is the flat bottom within a disjointed channel. This pattern can provide valuable insights into market sentiment and potential future price movements.
What This Pattern Suggests
A flat bottom situated within a disjointed channel during a bearish phase typically signifies several important factors:
1. Temporary Accumulation: The emergence of a flat bottom may suggest that buyers are entering the market at a specific price level, creating a horizontal support baseline. This indicates a potential area of interest where demand is stabilizing.
2. Indecision: The presence of a flat bottom implies a lack of decisive control from either bulls or bears. Both sides are seemingly hesitant, resulting in a standoff that can lead to increased volatility.
3. Irregular Structure: While the flat bottom serves as a price floor, the disjointed nature of the channel means that the upper resistance levels are often uneven or inconsistent. This irregularity can complicate trading strategies and risk management.
Likely Outcomes
When examining this pattern in the context of a bear market, traders should consider the following probable scenarios:
- Breakdown Below Flat Bottom: This scenario has a higher probability of occurring in bear markets, as it often aligns with the continuation of the prevailing trend. A breach of the support level could indicate further downward momentum.
- Sideways Consolidation: A moderate probability exists for the market to enter a phase of sideways consolidation. This period may serve as a pause before the next leg down, allowing the market to digest recent price movements.
- Brief Relief Rally: Although a temporary rally is possible, such movements are often short-lived. Traders should remain cautious, as they may not signal a true shift in market sentiment.
Key Things to Watch
To effectively navigate the flat bottom in a disjointed channel, traders should monitor key factors:
- Volume: Pay attention to trading volume; declining volume on the flat bottom weakens the case for support. A lack of participation can foreshadow potential breakdowns.
- Break Confirmation: A decisive close below the flat bottom serves as a strong bearish signal. Confirmation of this breakdown is critical for validating the sentiment shift.
- Channel Boundaries: The irregularity of disjointed channels makes it challenging to predict resistance levels accurately. As such, traders should remain vigilant to shifts within the channel structure.
Bottom Line
In the context of a prolonged bear market, a flat bottom is seldom an indicator of a definitive reversal on its own. More often, it represents a brief pause in the market before a potential continuation downward. To increase the likelihood of accurate predictions, traders should consider additional factors, such as volume and broader market trends, that can influence price movements.
By maintaining a watchful eye on these elements, traders can better position themselves in a landscape characterized by uncertainty and volatility.
Reverse Positionwww.tradingview.com
Reverse Position
The Reverse Position feature instantly closes your current position and opens an opposite one of the same size. For example, if you are long 2 contracts, reversing will place a sell order of 4 — 2 to close the long position and 2 to open a new short position. This makes it a powerful tool for reacting quickly to sudden changes in market conditions.
This feature is especially useful in moments like today's XRP price action. If you made the mistake of going long during today's fakeout, using the Reverse Position feature now could help protect your portfolio from further losses.
Disclaimer
The information and publications posted by us are not meant to be, and do not constitute, financial, investment, trading, or other types of advice or recommendations.
Not financial advice, you know what to do!
XRP Has Yet to Find Its Bottomwww.tradingview.com
BINANCE:XRPUSDC
XRP has yet to find its bottom. While XRP whales are offloading their holdings in favor of Bitcoin - capitalizing on BTC's current price momentum - XRP remains firmly entrenched in a controlled bear market, leaving many long-term investors feeling trapped and uncertain about the road ahead.
Adding to the bearish outlook, several unmitigated fair value gaps still exist on the higher time frames. These gaps need to be unmitigated and filled to draw in new liquidity before any sustainable recovery can take shape.
XRP - Under the glass
XRP continues to face major resistance below the 50% Fibonacci Channel level from the previous Wave 1 bullish cycle. It is currently being rejected within a triangle pattern and is once again entering the parallel channel that formed on February 6th. Ultimately, it's just a matter of time before the bulls turn bearish upon this realization.
XRP - Still no bottom found
XRP continues to face major resistance below the 50% Fibonacci Channel level from the previous Wave 1 bullish cycle. It is currently being rejected within a triangle pattern and is once again entering the parallel channel that formed on February 6th. Ultimately, it's just a matter of time before the bulls turn bearish upon this realization.
XRPUSDTXRPUSDT current price @ 1.4128
Iran's Supreme Leader Ayatollah Ali Khamenei was killed in US-Israeli strikes on February 28, 2026, sparking initial market turmoil but leading to crypto recovery. XRP, like other cryptocurrencies, dipped sharply amid the news before rebounding.
Event Timeline
Khamenei's death was announced by President Trump and confirmed by Iranian state media on February 28, amid escalating US-Israel strikes on Iran. Iran vowed retaliation, declared mourning, and began succession processes. Crypto markets reacted with volatility as geopolitical risks peaked.
XRP Price Movement
XRP fell to a low around $1.27 during the initial US-Iran conflict reports on February 28, erasing some early 2026 gains from highs near $2.40.
Market Impact Factors
Geopolitical uncertainty triggered broad sell-offs across risk assets, including a $128 billion crypto market cap drop initially. Recovery followed as traders bet on faster conflict resolution without Khamenei's leadership, reducing long-term risk premiums. XRP volume spiked 27%-70%, signaling capitulation before the bounce.
price could seek supply at 1.5$ roof.
#xrp #xrpusdt
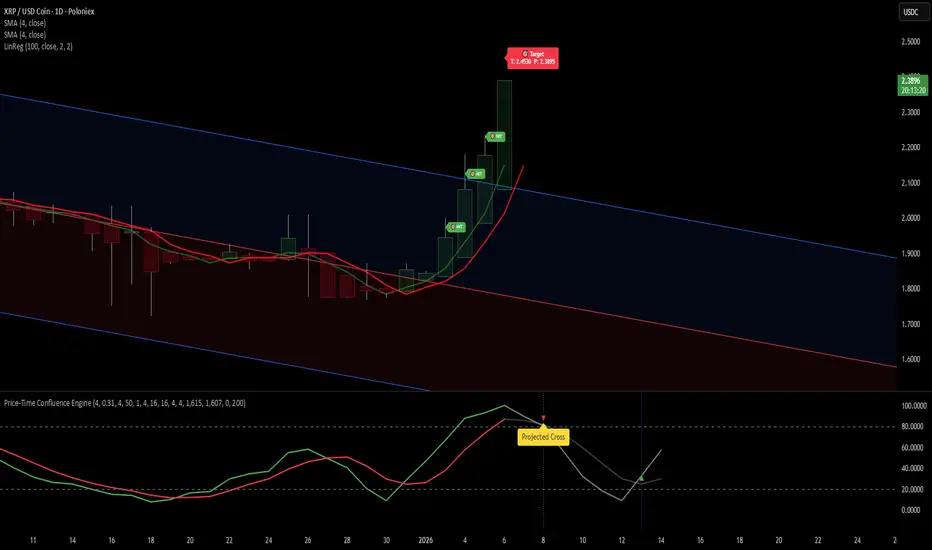
XRP / USDC — MA Alignment & MomentumThis chart presents XRP/USDC on the daily timeframe, combining short-length moving averages, multi-timeframe target levels, and a momentum oscillator with a projected crossover guide.
Price recently completed a strong impulsive advance, followed by a controlled pullback that has now transitioned into short-term consolidation beneath recent highs. Multiple prior upside targets have already been tagged, suggesting the market is now in a reaction and decision phase rather than trend expansion.
Trend & Structure Analysis
The 4-period moving averages (short-term trend proxies) have begun to flatten after a steep advance.
Recent candles show lower highs and overlapping bodies, consistent with loss of upside momentum.
Current price is trading below short-term resistance, with moving averages acting as dynamic compression zones.
From a structural perspective, this behavior is typical after a fast expansion: price pauses, tests balance, and awaits either continuation confirmation or deeper retracement acceptance.
Multi-Timeframe Bias
The TF alignment table shows bearish dominance (100% Bear) and a grade of F, indicating poor alignment between timeframes.
This does not automatically imply a crash, but it does suggest that bullish continuation lacks confirmation at this stage.
Weekly reference levels above price continue to act as overhead resistance, while lower weekly levels remain valid downside magnets if selling pressure persists.
Momentum & Projection
The momentum oscillator has rolled over from elevated levels and is now attempting to stabilize.
A projected bullish cross is visible ahead, but it remains conditional and unconfirmed.
Until that cross materializes with price support, momentum should be treated as neutral-to-bearish.
Key Levels to Watch
Resistance Zone: Prior daily highs and clustered MA levels overhead.
Near-Term Support: The recent pullback low and lower daily target region.
Failure Level: Acceptance below the lower weekly reference level would increase probability of a deeper retracement.
Forecast (Conditional)
Bullish Scenario:
A confirmed momentum crossover combined with reclaiming the short-term moving averages would favor a renewed push toward prior highs and upper daily targets.
Bearish / Consolidation Scenario:
Continued rejection near moving averages increases the likelihood of sideways drift or a controlled pullback toward lower daily or weekly support zones.
At present, the chart favors patience and confirmation, not aggressive positioning.
Conclusion
This setup reflects a market that has already made its primary move and is now evaluating whether continuation is justified. Until multi-timeframe alignment improves, XRP/USDC remains in a probability-compression zone, where risk management and confirmation are more important than prediction.
As always, this chart represents technical probabilities, not financial advice, and should be used alongside personal risk parameters and broader market context.
XRP / USDC — Daily Trend Expansion This chart shows XRP continuing a structured upside expansion following a successful transition out of a corrective phase. After forming a higher low, price accelerated upward and reclaimed key short- and medium-term daily structure.
Recent candles reflect consistent bullish follow-through, with price holding above rising averages rather than immediately retracing. Multiple upside target interactions (“HITs”) indicate active participation and acceptance at higher levels, suggesting trend development rather than a single impulsive spike.
Key structural observations:
The prior downtrend has been clearly interrupted, with momentum favoring continuation.
Price remains supported above reclaimed daily structure, reinforcing trend integrity.
Former resistance levels are acting as short-term reference support.
Multi-timeframe context:
Daily and weekly reference levels are interacting closely, creating a defined decision zone.
Higher-timeframe resistance remains overhead and may influence near-term consolidation.
Lower reference levels beneath price define the structure that would need to hold to maintain the current trend.
Momentum context:
The oscillator remains in a bullish regime, with projected continuation rather than immediate exhaustion.
Momentum structure aligns with price behavior, increasing the probability of continued range exploration before a larger consolidation phase.
Forward-Looking Scenarios (Probabilistic)
Sustained acceptance above current daily structure favors additional upside probing toward higher-timeframe reference zones.
Failure to hold reclaimed levels would more likely result in sideways consolidation or a controlled pullback, rather than an immediate trend reversal.
Broader directional clarity is expected as price resolves its interaction with weekly resistance.
All levels shown represent contextual reference points, not guarantees. This chart is shared for educational and informational purposes only and should be confirmed using additional tools, timeframes, and appropriate risk management.
XRP / USDC — Price–Time Confluence and Target InteractionThis chart presents a price–time confluence view of XRP following a sustained downtrend and subsequent structural transition. The focus is on how price interacts with dynamically generated targets, trend structure, and momentum behavior rather than on fixed predictions.
Structural Context:
Price spent an extended period moving within a descending channel, with repeated failures to sustain upside momentum.
A clear inflection developed as price stabilized near the lower boundary and began forming higher lows.
The recent advance shows a decisive break from prior compression, with price accelerating away from the channel structure.
Target Interaction:
Multiple upside targets have been reached in sequence, each marked by confirmed interactions rather than single-candle spikes.
Target hits occurred alongside expanding candle bodies, suggesting participation rather than thin liquidity moves.
The current target zone sits above recent price action and remains technically active while structure is maintained.
Trend & Baseline Behavior:
Price has reclaimed and remained above its rising median baseline, which now acts as dynamic support.
The curvature of the baseline reflects increasing trend strength rather than a flat or reactive condition.
Momentum Context:
The momentum oscillator shows a completed expansion phase followed by a projected cooling period.
The projected cross highlights a potential reset window, which often accompanies consolidation or range development rather than immediate trend failure.
Momentum structure remains elevated relative to prior cycle lows, indicating structural improvement even during pullbacks.
Forward-Looking Context (Non-Predictive):
As long as price continues to respect the rising median and prior target zones, higher reference levels remain relevant. A loss of structure or failure to hold reclaimed levels would shift focus back toward consolidation or deeper retracement instead.
This chart is designed to visualize price behavior, target interaction, and time-based momentum relationships, not to forecast outcomes. All levels should be treated as dynamic reference zones that evolve with price.
XRP / USDC — Contextual Price Reaction and Momentum AlignmentThis chart presents a context-based price analysis of XRP/USDC using a combination of trend structure, volatility-aware targets, and momentum behavior across the daily timeframe.
Price Structure
XRP has been trading within a well-defined descending channel, with recent price action responding cleanly to the lower boundary of that structure. The most recent advance shows a strong reaction off channel support, followed by a sequence of higher closes that pushed the price back toward the channel midpoint and upper reaction zones.
Several upside reaction levels have already been met, suggesting that short-term downside pressure has been absorbed and that price is currently in a recovery phase within the broader structure.
Target Interaction
The highlighted target levels on the chart are not signals, but volatility-scaled reference zones. Recent candles show price interacting with and reacting at these levels, which provides useful feedback about how price is behaving relative to its recent volatility regime.
As long as price holds above the most recent reaction zone, the structure supports continued testing of higher levels within the channel. Failure to hold these levels would shift focus back toward range behavior rather than continuation.
Momentum & Timing Context
The lower pane illustrates momentum oscillation and projected behavior, offering insight into timing rather than direction. Momentum has recently turned upward from a lower region, and the projected path suggests a potential momentum crossover window ahead.
It’s important to note that projected paths are not predictions, but visual aids that help contextualize when momentum transitions have historically occurred under similar conditions.
Market Context Summary
Price has reacted positively from structural support
Multiple nearby targets have already been engaged
Momentum is improving from a lower range
Structure remains intact unless recent reaction levels fail
This chart is intended as a contextual analysis, not a trade recommendation. It highlights how price, structure, and momentum are currently interacting so traders can form their own risk-managed decisions.
This chart is for educational and analytical purposes only. It does not constitute financial advice.
XRP BULLISH STILLEven though we have seen the market reverse in a bullish pattern the market is still in a bearish channel, based on the weeks ahead many people are fear selling which suggests profit takers loading up on liquidity and waiting for the 2.80 correction and hypothetical 2.20 crash before the correction + 10%.
Still shorting as of this moment this is based on 4hr-15min chart review.
XRP Quarterly Breakout & XRP/BTC Ratio Analysis1) The Current Technical Structure (XRP/USD)
The quarterly chart for XRP confirms a powerful technical setup:
- A classic Bollinger Band breakout on this long timeframe.
- RSI at 82 , indicating extremely strong momentum.
- The quarterly candle closed significantly above the upper band, pulled back to test it, and is now pushing higher again.
- This is the exact type of pattern that has historically preceded major multi-year bull markets in other assets.
Quarterly Data
- Q3 2024: Closed at $2.08 (massive breakout quarter).
- Q4 2024: Closed at $2.09 (consolidation at resistance).
- Q1 2025: Closed at $2.24 (reaffirmation of trend).
- Q2 2025: Closed at $2.82 (continued expansion).
________________________
2) Historical Precedents and Outcomes
- Nasdaq (1999): Led to a 5-year rally before a significant correction.
- Gold (2006): Preceded a multi-year rally into 2011.
- Bitcoin (2017): Sparked a 3-year bull market cycle.
The failed examples:
- Oil (2008): Collapsed due to global recession and demand destruction.
- Bitcoin (2021): Failed due to excessive leverage and lack of regulatory clarity.
Key Insight: Sustained precedents coincided with fundamental shifts (tech adoption, central bank easing, institutional crypto entry). Failures were tied to crises or regulatory headwinds.
________________________
3) XRP’s Fundamental Context
XRP stands apart from failed cases because:
- It now has regulatory clarity that Bitcoin lacked in 2021.
- There is potential ETF approval , which could bring institutional flows.
- The financial industry continues to explore blockchain-based payment solutions.
________________________
4) Long-term Value Perspective
- Volume Confirmation: Breakout quarters showed 6–16bn vs prior lower levels, consistent with accumulation.
- Regulatory Sequenance: Momentum followed clarity, unlike Bitcoin 2021.
- Relative Valuation: Despite momentum, XRP hasn’t shown the euphoric valuations typical of late-cycle blow-offs.
Benjamin Graham’s principle applies: “The market is a voting machine in the short run, but a weighing machine in the long run.” The market here seems to be weighing XRP’s improved fundamentals.
________________________
5) XRP/BTC Ratio Analysis – Structural Strength
Looking at the XRP/BTC pair adds critical confirmation:
- Bottoming (2023–2024): Ratio held around 0.000007–0.000008 BTC.
- Breakout (Q3–Q4 2024): Jumped to 0.000022 (≈129% vs BTC).
- Consolidation (Q1 2025): Formed higher base at 0.000020–0.000025.
- Continuation (Q2 2025): Held 0.000026 despite Bitcoin’s own strength.
This is a textbook basing → breakout → consolidation → continuation pattern on a quarterly ratio chart — much stronger evidence than USD price alone.
________________________
6) Comparative Historical Context
- Bitcoin 2015–2017: Similar long-term basing before secular breakout.
- Ethereum 2016–2017: Ratio strength vs BTC came before ETH’s surge.
The distinction: XRP broke out after regulatory clarity, unlike BTC in 2021, which surged first and then faced challenges.
________________________
7) Volume Analysis
- Elevated volume through the 2023–2024 base.
- Explosive volume during Q3–Q4 2024 breakout.
- Healthy, consistent participation during Q1 2025 consolidation.
- Renewed interest into Q2–Q3 2025.
This mirrors institutional accumulation profiles in traditional markets during secular shifts.
________________________
8) Long-term Investment Perspective
From a value perspective, the XRP/BTC ratio suggests:
- Base Length: Nearly a year before breakout.
- Breakout Magnitude: More than doubled vs BTC.
- Consolidation Quality: Higher lows held above resistance.
- Regulatory Timing: Breakout followed, not preceded, clarity.
This aligns with the principle that the market is now “weighing” XRP’s improved fundamentals.
________________________
9) Risks to Monitor
- Correlation: XRP still linked to crypto market flows.
- RSI 82: Signals potential near-term overextension.
- ETF uncertainty: Approval timelines could sway sentiment.
- Invalidation levels: A quarterly close back inside Bollinger bands (USD) or sustained loss of 0.000020–0.000022 (BTC ratio).
________________________
10) Conclusion
Both the quarterly USD breakout and the XRP/BTC ratio strength point to a structural, early-to-mid cycle revaluation rather than late-cycle froth.
For long-term investors, this resembles the early stages of prior secular breakouts (Bitcoin 2015–2017, Ethereum 2016–2017, Gold 2006). While corrections of 30–40% are likely along the way, the structural thesis remains intact as long as the quarterly patterns hold.
________________________
Not financial advice. Extracted directly from TrendSpider Sidekick analysis (Warren, the Long Term Investor).
XRP-looking very weak,trend shift?Hello,we need to talk. My macro plan from previous post is invalidated.Check other thread if you're interested.
Reasons:
-Failed timeframe (My august timeline is invalidated,Phase 2 was short lived)
-Weakness in trend (expected it to really GO after making another ATH at 3.60)
-Huge hype around XRP at new ATH
-Xrp lawsuit settlement news did nothing to the price and it was used as exit event.
-Fast rise in Futures open interest,followed by -15 % daily crash
- Stopped 2 times on my leverage positions at 3,4 and 3?-two trades that got invalidated.
and probably 10 to 15 more ..
What we've learned from the past cycles? -always lock profits or exit positions when macro trend looks weak or after trend shift is confirmed. 90% of retail investors think we are going up from here,which CAN happen,but this number concerns me.
The monthly confirmation level is breaking below 1.90.
Middle of the whole trend (Phase 1 that played out) is 1.20$.
What people expected,including me was a repeat of 2017 move in BTC,ETH,XRP ,in the 1st year or Trump's mandate...well... things are different now, cycles are different ,market participants got way smarter compared with 2017...The rapid rise in ETH and NO follow up from other alts is BEARISH sign for me..
That's why i sold 80% of my stack at average price of 3 $ and looking to rebuy when price comes down to GREEN box. This is a front run ,usually most people look for the invalidation levels to play out and to be broken first and then sell on retest, but i prefer to ride with the smart money ,hope i'm right! Not financial advice !
Stay safe !
XRP New Higher Low and Break of Structure, LONG PlayThe 45min chart is powerful for Crypto, and is showing a new Higher Low.
Break of structure to the upside. (See "bos" horizontal lines).
An upward channel is present on 45min chart and 1h chart.
Bull Pennant Pattern is showing on my candle times, including 4h and daily. These usually break bullish.
On the 45min chart the 200ma has just crossed above the 314ma. In my methodology that's a bullish MA cross.
ADX/DI and Squeeze and Wadda indicators are favorable on the lower time frames including 4h's.
This is slightly high octane speculation, but mostly TA with a slight bit of front running and TIGHT stop loss.
Overall looks like the ALT market is green today for many pairs against USD and USDC on Coinbase. If nothing else today should offer a stop loss in the green while XRP makes a move.