Key Focus Is Whether the 1.1237–1.1475 Zone Can Hold as Support
Hello, traders.
Follow for more chart updates and trading insights.
***
## XRP Current Outlook
XRP is currently undergoing a correction after facing strong selling pressure in the 1.50 ~ 1.9669 resistance zone.
From a mid-to-long-term perspective, price is attempting to move back into a mid-term accumulation zone, and the next directional move will largely depend on whether 0.93 support can hold.
If XRP breaks below 0.93, it could enter a prolonged consolidation or extended correction phase, potentially requiring significant time before a meaningful trend reversal occurs.
In addition, the OBV indicator has fallen below its Low Line, making it important to monitor whether a volume-backed recovery can develop.
***
## Key Short-Term Level to Watch
The most important price zone right now is the HA-Low region between 1.1237 and 1.1475.
This area could attract buying interest in the short term and represents a critical level that XRP must reclaim in order to establish a new bullish wave.
***
### Scenario 1: Bullish Case
* Reclaim the 1.1237 ~ $1.1475 zone
* Turn the zone into support
* Buying pressure returns and a short-term rebound develops
* A breakout above $1.3524 strengthens the bullish trend reversal signal
If XRP successfully reclaims and holds the 1.1237 ~ 1.1475 support zone, a bullish trading bias becomes valid.
***
### Scenario 2: Bearish Case
* Failure to reclaim the 1.1237 ~ 1.1475 zone
* Sideways price action or renewed downside pressure
* Higher probability of a staircase-style downward structure
For now, it is better to wait for confirmation of a recovery above this zone rather than chasing price action aggressively.
***
## Trend Reversal Criteria
A simple bounce is not the same as a trend reversal.
For XRP to transition into a genuine bullish trend, price must first establish acceptance above 1.3524.
Afterward, XRP must break through the major Volume Profile resistance zone between 1.50 and 1.9669 to confirm a mid-to-long-term bullish trend.
Until then, a short-term trading approach focused on increasing coin holdings may be the more favorable strategy.
***
# XRP Trading Strategy
XRP has long been viewed as a strong long-term investment asset.
However, simple buy-and-hold strategies can create significant opportunity costs by tying up capital for extended periods.
Consider the following approach instead:
### Scale-In Strategy
* Avoid entering with full capital at once
* Build positions gradually at major support areas
* Maintain cash reserves for potential further downside
### Scale-Out Strategy
* Take partial profits after reaching predefined profit targets
* Use recovered capital to create future re-entry opportunities
For example:
* Sell part of the position after a meaningful price advance (around 50% gains)
* Recover all or a significant portion of the original investment
* Continue holding the remaining position for long-term upside
This approach allows traders to navigate market volatility while steadily increasing their XRP holdings over time.
***
## Trading Strategy Matters More Than Chart Analysis
Many market participants possess solid chart-reading skills yet struggle to generate consistent profits.
The main reason is often a lack of trading strategy and capital management discipline.
Ultimately, success comes from:
* Not chasing massive gains from a single trade
* Building a strategy that fits your account size and risk tolerance
* Consistently executing the same set of rules over time
The market always provides opportunities.
Rather than going all-in, managing risk through scaled buying and scaled selling can help increase holdings while preserving capital, leading to more stable long-term results.
***
Thank you for reading.
Wishing you successful trading and profitable setups ahead. 🚀📈
In-depth trading ideas
Repeating pattern Behind Every Massive Crypto LiquidationHi,
Why do thousands of traders get liquidated almost at the same point?
Is it just bad luck, or was the chart already showing the warning signs ?
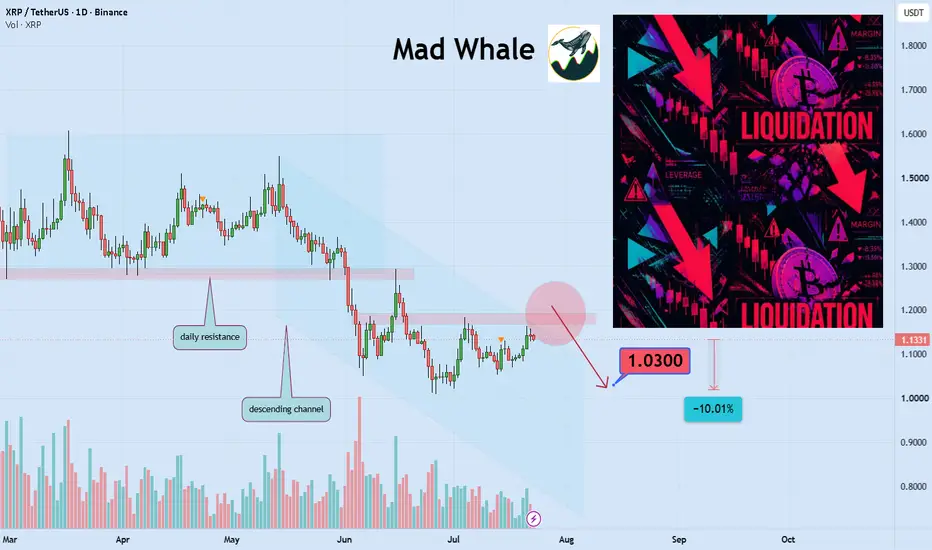
Short-Term XRP Analysis;
The market has started moving higher, which is interesting. But why are we not seeing the same strength across altcoins and 90% of the major market leaders after the top three assets?
XRP is now approaching the upper boundary of its descending channel and a key daily resistance area. From my perspective, this zone could create selling pressure, with a possible downside move of at least 10% and a target around the $1 level.
Before every major liquidation event, the market usually leaves behind a r epeated story on the chart , a story that many traders only understand after the move is already over. The main problem is not that the market suddenly changes direction, but that many traders ignore the important signals already visible in price structure, trading volume, and market behavior. When a large number of traders enter positions around similar areas and make similar decisions, a huge amount of liquidity starts building in those zones. This concentration of orders can create the conditions for a powerful move that catches many traders off guard. Behind many major liquidations, there is usually a combination of human emotions, overconfidence, and ignoring the clear signs that the market provides.
To identify these footprints, traders should look beyond simple bullish and bearish candles; TradingView tools can provide a much deeper view of market behavior. Studying equal highs and equal lows , using V olume Profile to find areas with the highest trading activity , monitoring ATR changes to understand volatility conditions, and analyzing Volume to measure the real strength behind a move can all provide valuable insights. Looking at Swing High and Swing Low structures can also help traders understand whether the market is building a healthy trend or simply collecting liquidity inside a specific range. Combining these tools does not mean predicting the future with certainty; instead, it is a way to better understand the story that the market creates on the chart before every important move.
One of the biggest mistakes traders make is reacting too quickly to the first price breakouts and making decisions based on short term emotions, because not every breakout means the real move has started. Sometimes the market first attracts attention, creates confidence among traders, and then reveals its actual direction. Traders who rely on only one indicator or a single signal often miss an important part of the bigger picture. On the other hand, those who combine price structure, volume, liquidity, and market psychology can develop a clearer understanding of current conditions. Recognizing these repeated patterns does not remove all risks, but it can help traders make decisions with less fear and greed and more awareness of how the market truly behaves.
XRP: Trend Still Favours the BearsPrimary trend remains bearish
XRP continues to produce a series of lower highs and lower lows, keeping the primary trend firmly to the downside. Until that structure changes, rallies should still be treated with caution.
Moving averages reinforce the trend
The 100/50-day EMAs remain bearishly crossed, with price continuing to find resistance around those moving averages. This continues to reinforce the broader bearish outlook.
Momentum remains neutral
RSI continues to chop around the 50 level, reflecting the current lack of conviction from either side. Meanwhile, StochRSI is falling but has yet to reach oversold territory, leaving room for further downside.
Support remains critical
The $1.05 support area continues to hold the key. A break below this level would increase the likelihood of a retest of the $1.0092 swing low.
Resistance still stacked overhead
Even if bulls recover, the first hurdle sits around $1.18, while the much more significant resistance zone remains around $1.30. Bulls will need to reclaim both levels before the broader technical picture begins to improve.
In Summary
XRP continues to trade within a well-established primary downtrend, with lower highs and lower lows keeping the bears in control. The 100/50-day EMAs remain bearishly crossed, while momentum remains broadly neutral. Unless bulls can reclaim $1.18 and ultimately $1.30, rallies are likely to remain corrective. A break below $1.05 would increase the risk of another move towards the $1.0092 swing low.
XRPUSDT Daily 25th JulyTrend: Bearish → Consolidation Above Key Support
After an extended downtrend, XRP has entered a prolonged consolidation phase around the $1.08–$1.10 support area. Price is currently trading just above a previously established Break of Structure (BoS) level, suggesting that buyers are attempting to defend this demand zone. However, bullish momentum remains limited, and a confirmed trend reversal has not yet been established.
Key Support Levels
$1.08–$1.10: Primary support and current demand zone. Holding above this level is essential to maintain the current market structure.
$0.60: Major long-term support. A breakdown below $1.08 could expose XRP to a deeper correction toward this area.
Key Resistance Levels
$1.40: First intermediate resistance from previous swing highs.
$1.6768: Major resistance zone. A breakout above this level would significantly improve the medium-term bullish outlook.
$2.4249: Long-term resistance and the next major upside target if bullish momentum accelerates.
Bullish Scenario
As long as XRP holds above the $1.08 support, buyers remain in control of the short-term structure. A breakout above the recent consolidation range could trigger a move toward $1.40, followed by $1.6768. A confirmed daily close above $1.6768 would indicate a strong bullish continuation toward $2.42.
Bearish Scenario
A daily close below the $1.08 support would invalidate the current consolidation structure and increase the probability of a decline toward the $0.60 support zone. Such a breakdown would confirm renewed bearish momentum.
Market Structure
The chart shows a BoS (Break of Structure) near the current support, indicating that this level is technically significant. Price has repeatedly respected this area, suggesting that institutional buyers may be defending it. Nevertheless, the market remains range-bound until a decisive breakout occurs.
Conclusion
XRP is currently trading within a consolidation range after a prolonged bearish trend. The $1.08 support is the key level to watch. Holding above this area keeps the bullish recovery scenario alive, while a break below it would likely lead to another bearish leg. For now, the market remains Neutral, awaiting confirmation from either a breakout above resistance or a breakdown below support.
Overall Bias: Neutral (Bullish above $1.08, Bearish below $1.08).
XRP/USD: Break Above 1.1718 Could Confirm a Bullish ReversalXRP is testing the key resistance at 1.1718 for the second time, while the chart is forming an ascending triangle pattern.
A confirmed breakout above 1.1718 could strengthen bullish momentum and open the way toward 1.2695, 1.3671 and 1.4648. The upward turn in the Bollinger Bands and improving MACD support this scenario, although the overbought Stochastic oscillator suggests that a short-term pullback remains possible.
The bearish scenario would become relevant if XRP consolidates below 1.0742. This would invalidate the triangle pattern and could trigger a decline toward 0.9765 and 0.8789.
Support: 1.0742, 0.9765, 0.8789
Resistance: 1.1718, 1.2695, 1.3671, 1.4648
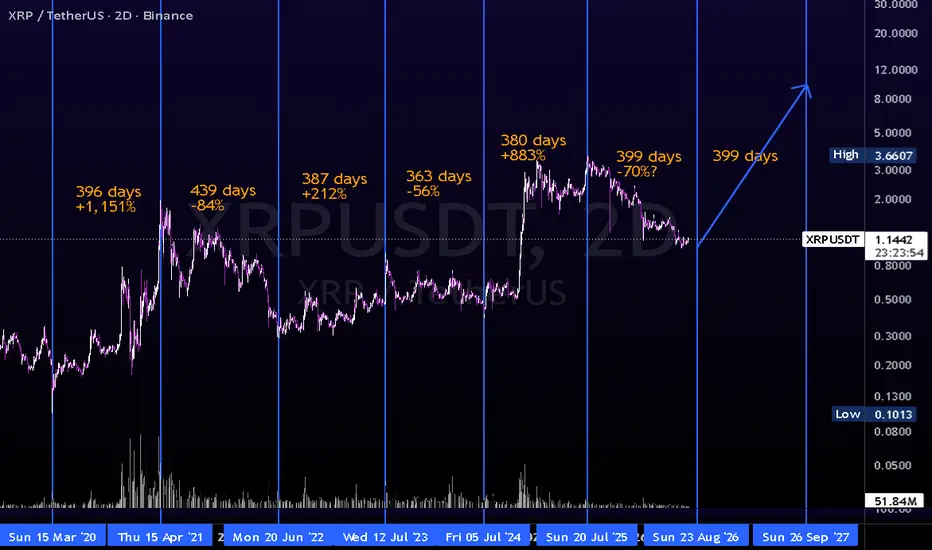
$XRP bullish reversal soon??Historical data suggests that XRP has formed a major long-term reversal approximately every 393 days on average. Across these cycles, the average bearish decline has been about 70%, while the average bullish advance has been roughly 730%. The data also indicates an alternating pattern in which 500%+ rallies are separated by a smaller rally of around 200%. If this historical cycle continues and my calculations are accurate, XRP may be nearing another major bullish reversal within the next 70 days.
XRP: Will there be a breakout in Q3/2026?XRP is trading at $1.10, up 1.46% over the past 24 hours. Daily trading volume stands at $881.89 million, and market capitalization has reached $68.85 billion, according to data from CoinMarketCap.
- What the chart indicates:
+ The 50-day EMA at $1.14 has capped further upside, repeatedly thwarting buyers' attempts to push the price higher. Even if XRP clears this key level, another challenge awaits near $1.25, followed by the 50-week EMA at $1.60—a more significant hurdle for confirming a long-term bottom.
+ The Relative Strength Index (RSI) stands at 47.85, just below the neutral 50 mark, indicating balanced market pressure.
+ Meanwhile, the MACD indicator shows a slight bearish trend, with the MACD line at -0.00333 and the signal line at -0.00618. However, the histogram has turned positive, suggesting that selling momentum is waning, although a bullish MACD crossover has not yet materialized.
Overall, these signals support the view that XRP may continue to fluctuate within its current trading range until significant bullish momentum emerges.
- Trading Outlook:
+ Key Support: The $1.08 – $1.10 zone; this is a critical demand area. A break below this level could trigger a sell-off, particularly given the ongoing capital outflows from ETFs.
+ Key Resistance: The $1.14 – $1.25 zone; breaking above this range on high volume would improve the bullish outlook.
- Real-world asset prospects and broader market impact.
+ XRP's technical outlook highlights the growing importance of monitoring evolving market structures, especially as practical platforms like 1stepSwap enable the direct trading of real-world assets via blockchain wallets.
+ Investors are also closely watching developments within the XRP Ledger ecosystem, potential institutional adoption, and legal proceedings—factors that could influence buying demand over the medium to long term.
+ Looking ahead, market conditions across the broader digital asset sector are expected to play a pivotal role in XRP's price trajectory. Historically, rallies in Bitcoin and the cryptocurrency market at large have driven capital inflows into large-cap coins like XRP, often leading to breakouts beyond key technical levels.
Let’s wait and see if XRP can reclaim and sustain the $1.14 level, signaling a trend reversal.
Traders can accumulate XRP by purchasing it on Bitget—all from a single account.
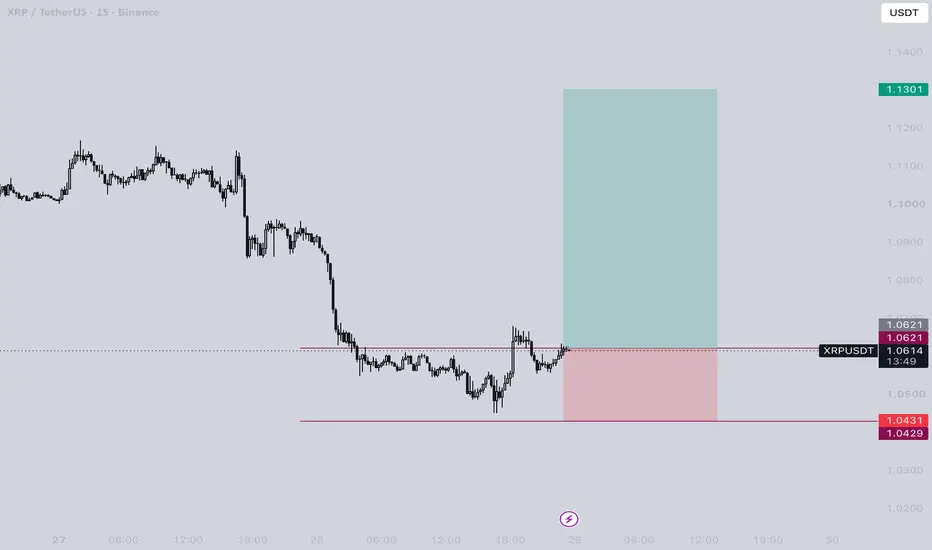
xrpusdt longInstructions:
Entry point: yellow
Stop loss: red
Take profit: green
👉Leverage x 5-10-20 for crypto
👉Leverage x 20-50-100 for commodities, stocks, indices, and forex
👉Margin 1-5% max.
Always practice risk and money management.
Invest a maximum of 5% on any trade or across all your trades.
Invest only what you can afford to lose, as no one is in control of the market.
👉Our analyses are primarily based on:
breakouts: two trend lines (ascending and descending) and a line indicating a horizontal breakout.
chart patterns: shoulders and head, triangle parttern, elliott impulse, etc etc.
We don't always have the time to track them at all times or to represent them visibly, given the numerous signals, the number of channels to manage, and especially because of the often rapid pace of market movements.
indicators: We associate at least two indicators with this technique.
👉Depending on the circumstances, we use specific indicators, often setting 3 or more take profit levels.
👉Indeed, there are good days in trading and also bad days. No one can promise to win every trade, and like all traders worldwide, we also experience stop-loss orders. However, we win more than we lose and remain positive.
👉You can close the position before or after the take profit orders indicated by the green lines if you are personally satisfied; the same applies to stop loss orders.
👉We must stay positive, clear-headed, and humble.
we cannot provide all instructions or all trades here on this channel.
Good luck to us all, and may God guide us. Amen.
XRP: The endless cycle. The market first goes down, then upOne year ago, mid-July 2025, XRPUSDT hit a new all-time high. After this all-time high the highest selling volume appeared on a single session and this signaled the start of a long-term decline.
The bear market
The decline is very steep and sustained at first. Then it slows down and finally the market turns sideways.
Just as the highest bearish volume appeared at the start of the bearish cycle; reaching the end, the market produces new lows but trading volume is minimum. 18-July 2025 trading volume was 412K. 24-June 2026, right before the lowest price in years, trading volume hit 105K at the peak, four times less compared to last year. The bearish wave already ran its course—it is over.
Here again we are focusing on the chart structure. XRPUSDT produced a major downtrend for the better part of a year, then no more. We can say that now we are looking at a transition, XRP is trading at the bottom, the accumulation zone. Very soon the market turns and grows.
Looking at XRP together with Bitcoin and Ethereum tells you everything you need to know. Additional information is available through the altcoins and the Crypto-related stocks. All these are pointing in the same direction and that is not a bearish continuation. We are looking at positive change.
The bearish wave ended in February, the market has been dead (or neutral) for almost six months. The market cannot kill itself, the market wants life, it wants to live like all of us. In order to infuse some life into this market, the whales will make it grow.
The market goes down, then the market goes up. The endless duality cycle. The bears and the bulls. Expansion - contraction. Breathe in, breathe out. Inhale - exhale. Night and day. Good and bad. The Moon and the Sun.
Namaste.
$XRP Update XRP has finally broken above the descending trendliCRYPTOCAP:XRP Update
XRP has finally broken above the descending trendline, which is an encouraging shift after months of weakness.
The next key test is the 50 and 99 EMAs. If buyers can push through those levels and secure a daily close above $1.24, the chart will turn much more bullish and the recovery could accelerate.
For now, the breakout looks solid. As long as XRP stays above the trendline, I'm expecting more upside in the coming days.
XRP: Dominant Medium-Term Downtrend
XRP: Dominant Medium-Term Downtrend – Optimizing Short Positions Within the Technical Compression Zone
XRP has unfolded precisely in line with our previous daily analysis, successfully hitting its take-profit objective around the $1
.00 psychological round number. Following that steep plunge, the price action initiated a brief technical relief wave to absorb dip-buying demand and collect market liquidity. However, this recovery attempt remains exceptionally weak, as the macro framework continues to be completely dictated by the bears.
Based on the visual data from the 4-hour chart , the price is currently consolidating inside a triangle pattern with ascending higher lows. Although this local structure creates an illusion of a short-term rebound, the fact that price candles are continuously hugging the upper triangle boundary amid a broader market lacking institutional volume indicates that buying interest is thoroughly exhausted. Since the primary downward trend remains firmly intact, the probability of a bearish breakdown to resume the macro slide is vastly superior.
This tightly compressed range carves out a highly advantageous setup for trend-following short sellers. Proactively initiating a Short order within this resistance cluster allows for an exceptionally tight stop-loss placement positioned just above the triangle pattern to protect capital effectively, while extending the long-term take-profit target toward the deeper support floor around $0.80.
Disclaimer: This is not financial advice, DYOR.
#XRPUSDT — Holding the Last Fortres, Recovery or Final Break#XRP
The price is moving within a descending channel on the 1-hour timeframe and has reached the lower boundary. It is now poised for a bounce and is expected to retest this boundary.
The Relative Strength Index (RSI) indicates a downward trend, which is likely to continue given the overbought conditions.
A key support zone has been identified in green at 1.035. The price has bounced off this zone several times, making it a strong support level.
The price is trending towards the 100-period moving average, which we are approaching. This trend supports an upward move.
Entry Price: 1.08
First Target: 1.10
Second Target: 1.12
Third Target: 1.13
You can close at the second target or wait for the third target to be reached. The choice is yours.
Stop Loss: At the resistance zone in green.
Remember this simple rule: Money Management.
Any questions? Please leave a comment.
Thank you.
XRP - InvestmentplanMost people buy cryptocurrencies only after the major move has already started.
When the market is quiet, that is when you should develop a clear plan. The market structure shows us the key levels. Our job is to stay patient and wait for confirmation. 📊
🟢 Scenario 1 – Bullish Breakout
A breakout above the 1.18–1.20 USD area would be the first bullish confirmation.
After that, we wait for a pullback and look for a possible entry. 📈
The next important resistance is located between 1.25–1.31 USD.
If this zone is also broken and held, the key resistance area lies between 1.54–1.67 USD.
A breakout above this area would be very bullish. The next long-term target would then be the 2.10–2.40 USD area, where the long-term POC is also located. 🎯
🔄 Scenario 2 – Pullback into the Buy Zones
If XRP moves lower first, we will monitor the following areas:
✅ 1.04–1.10 USD
We do not buy blindly. In the marked zones, we wait for a higher high and clear bullish confirmation on the lower timeframes.
🚨 Critical Zone
A daily close below 1.00 USD would be bearish and significantly weaken the long-term plan.
On this channel, I will share potential entries and risk management step by step. 🔔
Wishing you success and stay blessed. 🙏
XRP/USDT: Trendline Breakout -> Two Key Scenarios to Watch!Hi!
XRP has successfully broken above a major downward-sloping trendline and is currently holding above the SMA. While the overall bias is bullish, the RSI shows a slight bearish divergence, suggesting we might see a temporary pullback before the next leg up.
We are watching two potential long setups depending on how the price reacts in the coming sessions.
Scenario 1: Aggressive Long (Immediate Continuation)
Entry Zone: Around $1.1027 - $1.1056
Stop Loss (SL): $1.0858 (below local consolidation)
Take Profit (TP): $1.1363
Scenario 2: Conservative Long (Pullback & Retest)
Entry Zone: $1.0670 - $1.0730 (S&D Zone / Trendline Retest)
Stop Loss (SL): $1.0569 (below the S&D zone)
Take Profit (TP): $1.1179
XRP: How Can We Optimize This 1.118 Ascending Channel Long?Take a look at how a community trader's long from the bottom of an ascending channel with an entry of 1.118, target of 1.173, and stop of 1.098 can be optimized using trend analysis, demand zones, Fair Value Gaps, and volatility data.
🛫 ENTRY
The core hypothesis of longing XRP based on the 4h macro uptrend and the recent 15m bullish CHoCH is structurally valid. The original entry at 1.1175 was located right below heavy 4h and 1h resistance zones, which forced a buy into established supply.
The entry was moved to 1.1030 to target a pullback into the 15m Bullish FVG from 1.0946 to 1.1028.
This adjustment aligns with the 1h support zone between 1.0955 and 1.1001, allowing for accumulation at a discount while sitting safely within the London session with no macroeconomic event risks.
If the price reaches the 1.1280 target before triggering the 1.1030 entry, the pending setup is canceled.
💰 TAKE-PROFIT
The original take-profit of 1.1725 was overly ambitious because it required a breakout through multiple 4h and 1h resistance zones.
The take-profit was adjusted to 1.1280 to secure profits just before the 1h resistance zone between 1.1282 and 1.1297. This target also respects the 15m bearish FVG spanning from 1.1242 to 1.1293 to ensure strict capital preservation.
🛡️ STOP-LOSS
The original stop-loss at 1.0975 was inside the 1h support zone, leaving the position vulnerable to sweeps.
The stop-loss was shifted to 1.0945, resting safely below the 1h support zone at 1.0955 and the 15m Bullish FVG at 1.0946. This level sits beneath the 15m trend extreme low of 1.1001 to provide a structural invalidation point with an ATR volatility buffer.
XRP: Bullish Day, But the Trend Is Still DownInitial resistance approaches
XRP has joined today's recovery across the crypto market and is now pulling back into the $1.1866 resistance level. This marks the first meaningful hurdle bulls need to overcome if the recovery is to continue.
Primary trend remains bearish
Despite the recent bounce, the 100/50-day EMAs remain bearishly crossed, while the higher timeframes continue to show a well-established downtrend. The broader outlook won't begin to improve until key resistance levels are reclaimed.
Momentum improving
RSI has climbed back above the 50 level, suggesting bullish momentum is beginning to build. Meanwhile, StochRSI has turned higher but remains below overbought territory, leaving room for further upside if buyers stay in control.
Volume lacks conviction
Trading volume has remained relatively subdued throughout the recent consolidation. A convincing move above resistance would ideally be accompanied by a noticeable increase in buying volume.
Bulls still have work to do
A break and close above $1.1866 would strengthen the short-term bullish case, but the more significant resistance zone around $1.30 remains the bigger obstacle. Until those levels are reclaimed, rallies should still be viewed within the context of a broader downtrend.
In Summary
XRP has produced an encouraging recovery, with momentum improving as RSI moves back above 50 and price challenges the first resistance around $1.1866. However, the 100/50-day EMAs remain bearishly crossed, while the higher timeframes continue to point lower. A move above $1.1866 would be a positive first step, but reclaiming the $1.30 resistance zone is likely needed before the broader trend begins to shift back in the bulls' favour.
THE ONE WING TRADER - Multi Timeframe Analyses
“Ladies and gentlemen, we’re almost ready for take-off. The weather looks great,
and we expect a smooth flight. I’ll only be focusing on the right wing because that
one looks perfect today. Cabin crew, take your seats.”
Thankfully, no pilot would ever be allowed to fly a plane with that knowledge.
Unfortunately, trading works differently.
A pilot who only looks at one wing instead of the whole plane should never become
a pilot. A trader who understands only one timeframe can start trading this
afternoon.
No training.
No license.
No track record.
Full risk.
The barrier to entry in aviation is exactly as it should be. It protects passengers. It
protects standards. It respects the complexity of the job.
The barrier to entry in trading is almost non-existent.
⸻
One of the biggest misconceptions in trading is that zooming in gives you a better
understanding of the market. Usually, it does the opposite. The closer you zoom in,
the easier it becomes to lose sight of the bigger picture. A beautiful long setup on the
15-minute chart can fail within minutes because it’s running straight into major
weekly resistance. What looks like panic selling on the 5-minute chart may be
nothing more than an ordinary pullback inside a healthy weekly uptrend.
Context changes everything.
Professional traders rarely ask,
“What is the 15-minute chart telling me?”
Instead, they ask,
“How does the 15-minute chart fit within the bigger picture?”
Those are two completely different questions.
One tries to predict.
The other tries to understand.
Markets don’t exist on one timeframe.
They exist on all of them simultaneously.
Every timeframe tells a different part of the story.
The weekly chart reveals where the market sits within the bigger cycle.
The daily chart defines the dominant trend.
The 4-hour chart reveals the market structure.
The 1-hour chart refines the setup.
The 15-minute chart helps execute the trade.
None of those charts is more important than the others.
Ignoring one is like ignoring one wing of an aircraft.
⸻
Trading isn’t about finding the “best” timeframe. It’s about understanding how
every timeframe contributes to the same market. The lower you go, the more noise
you encounter. The higher you go, the more context you gain.
Professional traders move between them constantly. They zoom out before they
zoom in. Not because it predicts the future. Because it prevents them from making
decisions based on incomplete information.
Just as no pilot would inspect only one wing before take-off, no trader should build
an entire market thesis from a single chart. The market doesn’t care what timeframe
you’re watching. It moves through all of them at the same time. The question isn’t
whether your 15-minute chart looks bullish. The question is whether it still looks
bullish when the rest of the aircraft is inspected.
⸻
Although the right wing may be perfect,
it’s just not enough to fly.
XRP USDT LONG SIGNAL#95 XRP/USDT – Trade Setup (LONG)
📈 Position Type: LONG
🕒 Timeframe: 1H
📊 Market: Futures
💰 Entry Zone:
Market
1.0623
🛑 Stop-Loss:
1.050
🎯 Take-Profit Targets:
• TP1: 1.110
• TP2: 1.1318
• TP3: 1.1543
• TP4: 1.1779
⚙️ Leverage:
5 *10
▫️ After TP1, move SL to Entry + 0.2%.
▪️ Exit Plan:
• 40% at TP1
• 20% at TP2
• 20% at TP3
20% at. TP4
📌 Risk Management:
Risk only 1–2% of your capital per trade.
⚠️ Always check and confirm the setup on your chart before entering the trade.
XRP/USDT Technical Analysis (2H)📊 XRP/USDT Technical Analysis (2H) 🚀
🧠 Market Structure Overview
XRP remains inside a well-defined sideways range after breaking its previous bullish structure. The earlier Change of Character (ChoCH) shifted momentum, and price is now consolidating between key support and resistance while liquidity builds.
🔍 Key Observations
🟢 Previous uptrend has paused, transitioning into a range-bound market.
📦 Price is respecting the current consolidation range, with buyers defending the mid-range support.
🔴 A significant Order Block (OB) above remains untested and could act as a magnet if bullish momentum returns.
⚡ The long-term support area around 1.022 remains the major invalidation zone for bulls.
📈 Bullish Scenario
If buyers defend the current support and reclaim momentum, XRP could:
✅ Bounce from the lower-mid range.
🎯 Retest the range high near 1.13.
🚀 A breakout above the range may open the path toward the Order Block (1.17–1.18).
📉 Bearish Scenario
If support fails:
⚠️ Price could sweep liquidity below the range.
📍 A move toward the 1.02 support zone becomes increasingly likely before any strong recovery.
🎯 Trading Outlook
🟢 Bias: Neutral to Bullish while price remains inside the range.
📌 Resistance: 1.13 ➜ 1.17–1.18 (Order Block)
📌 Support: 1.06 ➜ 1.02
💡 Strategy: Wait for confirmation at range boundaries. Trade the breakout or rejection rather than entering in the middle of consolidation.
⚠️ Conclusion: XRP is consolidating after a structural shift. A sustained break above the range favors continuation toward the higher Order Block, while losing support could trigger a deeper retracement before the next bullish leg.
#XRPUSDT — Holding the Last Fortres, Recovery or Final Break#XRP
The price is moving within a descending channel on the 1-hour timeframe and has reached the lower boundary. It is now poised for a bounce and is expected to retest this boundary.
The Relative Strength Index (RSI) indicates a downward trend, which is likely to continue given the overbought conditions.
A key support zone (in green) has been identified at 1.034. The price has bounced off this zone several times, making it a strong support level.
The price is trending towards the 100-period moving average, which we are approaching. This trend supports an upward move.
Entry Price: 1.086
First Target: 1.094
Second Target: 1.105
Third Target: 1.18
You can close at the second target or wait for the third target to be reached. The choice is yours.
Stop Loss: At the resistance zone (in green).
Remember this simple rule: Money Management.
Any questions? Please leave a comment.
Thank you.
XRPUSDT position | 4h Chart (Entry on H1)XRPUSDT Analysis | 4h Trendline Breakout & Retest Strategy
❇️ Market Outlook: The 4h chart shows a clear breakout of the descending trendline. I am monitoring the price action for a potential retest of the 1.075 structural level before seeking long opportunities.
🔼 Trade Plan:
Core Strategy: Breakout and Retest.
Timeframe Focus: 4h for structural levels, 1h for entry execution.
Key Levels:
- 1.075: Primary target for a valid pullback.
- 1.148, 1.213, 1.278: Resistance zones to monitor for potential reversal or further breakout.
🕯 Execution Strategy (1h Timeframe):
Wait for a clear test of the 1.075 support area.
Look for a bullish candlestick pattern (reversal) on the 1h chart.
Entry: Long position upon structural confirmation.
Stop Loss: Placed below the swing low of the retest zone.
⚠️ Note: While the red levels indicate potential reversal zones, my bias is to watch for them to be broken in the direction of the new trend to confirm continued momentum.
💬 What’s your take on this XRP move? Let's discuss!