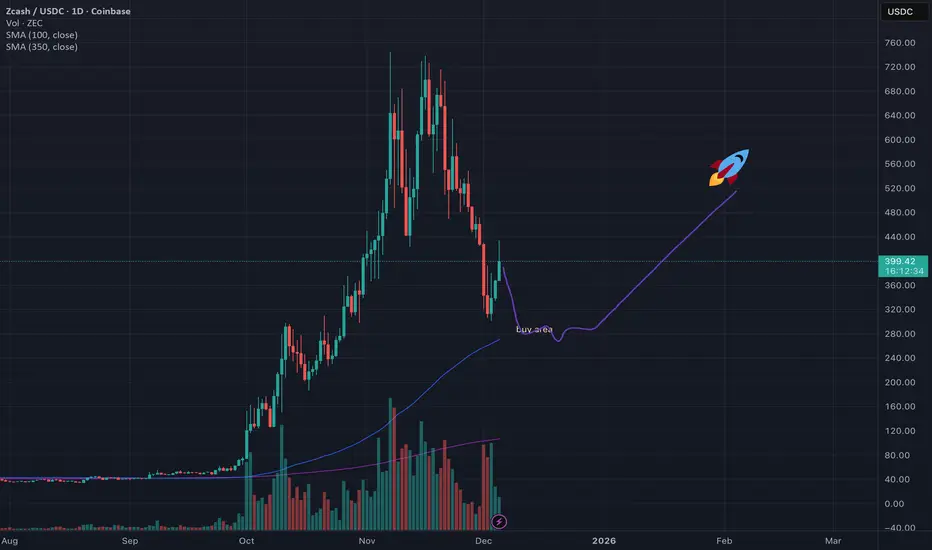
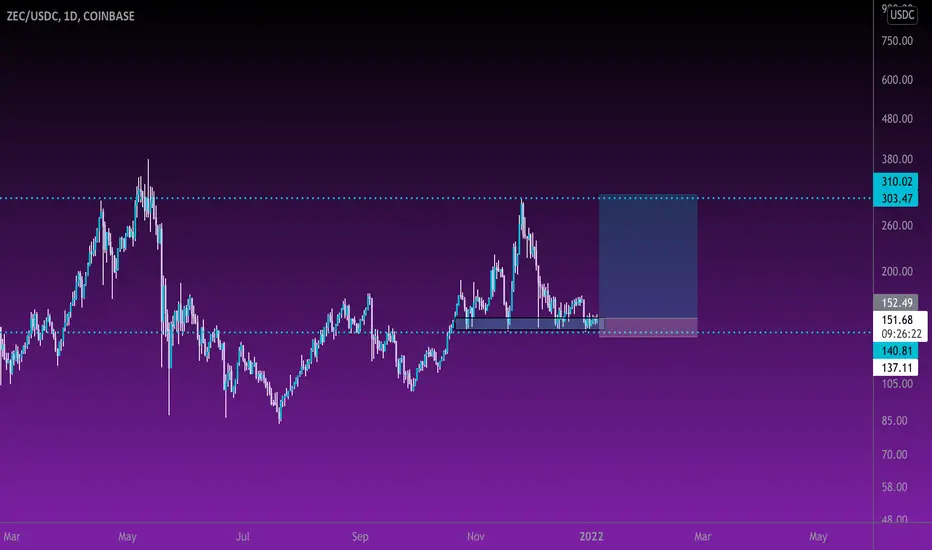
ZEC 9/12 AccumlationIt appears that buyer(s) are accumulating and containing price.
Watching the Accumulation/Distribution indicator, price is below fair value.
On the hourly chart, price is below the mean reversion line. The mean reversion theory suggests that price is bound to retrace to it's mean level.
If buyer(
ZECUSDC Perpetual Futures Contract
No trades
No trades
ZECUSD will touch 700$ ?CRYPTOCAP:ZEC Update (3D Timeframe)
Right now, ZEC is showing a weak bearish trend on the 3D chart. The good news is that price is still above the 200 MA, so the long-term structure is not broken yet. But at the same time, price is trading below the 50 MA, which tells us that sellers still have co
ZEC/USDC – Potential Breakout & ContinuationPrice is approaching a key level, where a possible breakout and continuation to the upside may occur. The idea is based on market structure and reaction around prior resistance, with potential targets near higher liquidity zones and invalidation below the recent range.
ZEC/USDT breakout likely?Hello,
Price continues to move within a well-defined upward channel, showing a series of higher lows and controlled pullbacks.
At the moment, price is consolidating into a small symmetrical triangle just below the 470–480 resistance zone.
So far, there has been no strong rejection, and bullish mome
See all ideas
Summarizing what the indicators are suggesting.
Oscillators
Neutral
Oscillators
Neutral
Summary
Neutral
Summary
Neutral
Summary
Neutral
Moving Averages
Neutral
Moving Averages
Neutral