ZECUSDT SHORT OPPORTUNITYThe crypto currency universe has experienced a brutal 2026 as prices collapse and altcoins are delisted and other projects shut down. The crypto currencies with active use/projects are expected to continue declining in value as the US Dollar strengthen. The protracted US-Iran conflict is expected to increase inflation and possibly increase domestic interest rates which will ultimately push the US Dollar higher. ZECUSDT market structure shows bears in control as they seek to push prices lower targeting the long term liquidity and imbalance sitting between 123.65 and 183.77. Our entry point is the short term FVG at 493.4 targeting the aforementioned liquidity levels of the FVG.
In-depth trading ideas
ZECUSDT 4H – Watching for a Rejection at Trendline Resistance
ZEC is approaching a key decision point on the 4H timeframe.
After a prolonged downtrend, price has bounced into a previous support trendline that may now act as **dynamic resistance**. This area also aligns with the 20 EMA, making it a confluence zone worth watching.
Trade Idea
I'm not entering immediately . Instead, I'm waiting for bearish confirmation around the current resistance.
Scenario:
* Rejection from the trendline.
* Bearish candle confirmation on the 4H.
* Short entry after confirmation.
Targets
First target: Previous swing low around **$445
If bearish momentum continues, the next major support lies around the $410–420 region.
Invalidation
A strong 4H candle closing above the trendline and holding above the recent highs would invalidate this bearish setup and could open the door for further upside.
📊 Technical Confluence
* Dynamic trendline resistance
* 20 EMA acting as resistance
* Lower highs and lower lows remain intact
* RSI is recovering from oversold territory but is still below the bullish momentum zone
Patience is key here. I'm waiting for price to confirm the direction rather than anticipating the move.
This is my personal technical analysis, not financial advice. Always manage your risk.**
#ZEC #ZECUSDT #Crypto #TechnicalAnalysis #PriceAction #TradingView #Binance #SwingTrading #RiskManagement
$ZEC bounced sharply off ~$509BINANCE:ZECUSDT bounced hard off the $509–$510 low and rallied straight into a selling breaker block at $525.78–$528.72 — the same zone that produced a sharp selloff earlier this week.
📰 Regulatory pressure is real right now: Russia has barred licensed professionals from using privacy coins ahead of Zcash's Ironwood network upgrade. That's landed on top of a volatile stretch — ZEC is down about 6.9% over the past 7 days despite a much larger rally the prior month. Volatility here is elevated in both directions.
📊 Bias: Bearish on rejection from this zone — the block previously acted as a strong supply area, and the regulatory headwind supports a fade rather than a breakout chase.
🎯 Trade Levels:
📍 Entry Zone: $525.60 – $528.72
🛑 Stop Loss: $530.60 (+0.95% | cap risk at 1–2% of account)
🎯 TP1: $517.15 (-1.6% | ~1.7:1 RR)
🎯 TP2: $500.60 (-4.9% | ~5.1:1 RR)
📐 Overall R:R: ~3.4:1 blended
🧠 Chart read: The prior move down through this zone was sharp and impulsive — a "breaker block" forms when price returns to retest the origin of that move before (potentially) continuing lower. A clean break and hold above $530.60 would invalidate this read and shift bias back toward continuation of the bounce.
🛡️ Risk note: ZEC's daily ranges here are large — a 1% stop can still mean a meaningful dollar move per coin. Don't use leverage to compensate for a "small-looking" percentage stop; size the position to the dollar risk, not the percentage.
📚 One thing worth knowing: privacy coins react to regulatory headlines differently than most crypto — restrictions on institutional or professional use can suppress volume and liquidity even without touching retail directly, which shows up as unusually erratic price action rather than a clean trend.
Rejected here, or is this breaker block about to fail? 👇
#ZEC #Zcash #CryptoTrading #TechnicalAnalysis #PriceAction #Altcoins #Crypto
$ZEC Is Preparing For The Next Move ?? CRYPTOCAP:ZEC Is Preparing For The Next Move ??
ZEC is showing a strong recovery structure after the previous drop. Price has been creating higher lows and buyers are defending the key demand zone around $440-$480. As long as this area holds, the bullish structure remains valid and I’m watching for a possible continuation move.
The next important step is a clean break above the current resistance area. If bulls manage to push higher with strong volume and a daily close above resistance, we could see momentum continue toward the next levels around $621 and potentially $688. A healthy pullback into the support zone before the breakout would be an even stronger confirmation.
The bullish idea will be invalidated if price loses the demand zone and starts closing below it. Until then, I prefer to stay patient and wait for confirmation rather than entering emotionally. Let the market show the direction first. 📊
ZEC USDT LONG SIGNAL#108 ZEC/USDT – Trade Setup (LONG)
📈 Position Type: LONG
🕒 Timeframe: 1H
📊 Market: Futures
💰 Entry Zone:
502.10
🛑 Stop-Loss:
488
🎯 Take-Profit Targets:
• TP1: 514.24
• TP2: 528.96
• TP3: 529.
• TP4: 557.70
⚙️ Leverage:
5 *10
▫️ After TP1, move SL to Entry + 0.2%.
▪️ Exit Plan:
• 40% at TP1
• 20% at TP2
• 20% at TP3
20% at. TP4
📌 Risk Management:
Risk only 1–2% of your capital per trade.
⚠️ Always check and confirm the setup on your chart before entering the trade.
$ZEC While retail gets liquidated —large players accumulateBYBIT:ZECUSDT.P
CRYPTOCAP:ZEC is one of the few coins on my watchlist where the Integrated Market Analysis (IMA) system shows consistent accumulation by 🐋large players throughout the entire week of decline.
So what's happening? While price was dropping and retail was getting liquidated, 🐋large players were building their position. This is clearly planned accumulation.
Now price is approaching the 📊M-IVZ support level. Most likely, 🐋large players controlling the dominant volume will add more position right here — and this could become the reversal point.
My plan:
• First 30% — on a bounce upon entering the 📊M-IVZ zone
• Remaining 70% — on additional IMA confirmation or in the liquidity zone below
• Only if I see 🐋large players continuing to accumulate
Trade setup (if confirmed):
• Entry: bounce at 📊M-IVZ zone
• Add: on IMA confirmation / liquidity sweep below
• Invalid: if 🐋large players stop accumulating
⚠️ Platform restrictions limit the publication of closed indicators. I display only the output of the 📊IVZ algorithm — institutional interest zones.
Analysis from me — execution from you 🚀
zecusdt shortInstructions:
Entry point: yellow
Stop loss: red
Take profit: green
👉Leverage x 5-10-20 for crypto
👉Leverage x 20-50-100 for commodities, stocks, indices, and forex
👉Margin 1-5% max.
Always practice risk and money management.
Invest a maximum of 5% on any trade or across all your trades.
Invest only what you can afford to lose, as no one is in control of the market.
👉Our analyses are primarily based on:
breakouts: two trend lines (ascending and descending) and a line indicating a horizontal breakout.
chart patterns: shoulders and head, triangle parttern, elliott impulse, etc etc.
We don't always have the time to track them at all times or to represent them visibly, given the numerous signals, the number of channels to manage, and especially because of the often rapid pace of market movements.
indicators: We associate at least two indicators with this technique.
👉Depending on the circumstances, we use specific indicators, often setting 3 or more take profit levels.
👉Indeed, there are good days in trading and also bad days. No one can promise to win every trade, and like all traders worldwide, we also experience stop-loss orders. However, we win more than we lose and remain positive.
👉You can close the position before or after the take profit orders indicated by the green lines if you are personally satisfied; the same applies to stop loss orders.
👉We must stay positive, clear-headed, and humble.
we cannot provide all instructions or all trades here on this channel.
Good luck to us all, and may God guide us. Amen.
ZEC - Trading The Range!ZEC has been trading within a large range, with price repeatedly reacting between the major support and resistance zones. 📊
Price is now approaching the $300-$330 support zone marked in blue, an area that has historically attracted buyers.
📌 As long as this support zone holds, we will be looking for long setups, targeting the major resistance zone marked in red around the $500 round number.
As always, rather than buying blindly into support, we will wait for bullish confirmation before considering any long positions.
Will buyers defend this key support and trigger another move toward range resistance? 🤔
⚠️ Disclaimer: This is not financial advice. Always do your own research and manage risk properly.
📚 Stick to your trading plan regarding entries, risk, and management.
Good luck! 🍀
All Strategies Are Good; If Managed Properly!
~Richard Nasr
ZEC/USDT (4h) Holding Inside an Ascending ChannelZEC/USDT continues to trade inside a well-defined ascending channel on the 4H chart. Price recently bounced from the lower boundary and is recovering toward the channel midpoint.
Holding above channel support could support another move toward the upper resistance. A confirmed breakdown below the lower trendline would weaken the bullish structure and favor a deeper correction.
ZECUSDT: All The Way Up To All Time High! 04/05/2026Dear Traders,
We hope you enjoyed a great weekend. The crypto market is currently bullish with pairs in an uptrend. For ZECUSDT, strong bullish volume is emerging and is likely to persist for the coming days or weeks. If the momentum continues, we could see the price hitting our target by the end of the week. Please manage your risk carefully when trading this volatile crypto pair.
Good luck and trade safely!
The Setupsfx_ Team
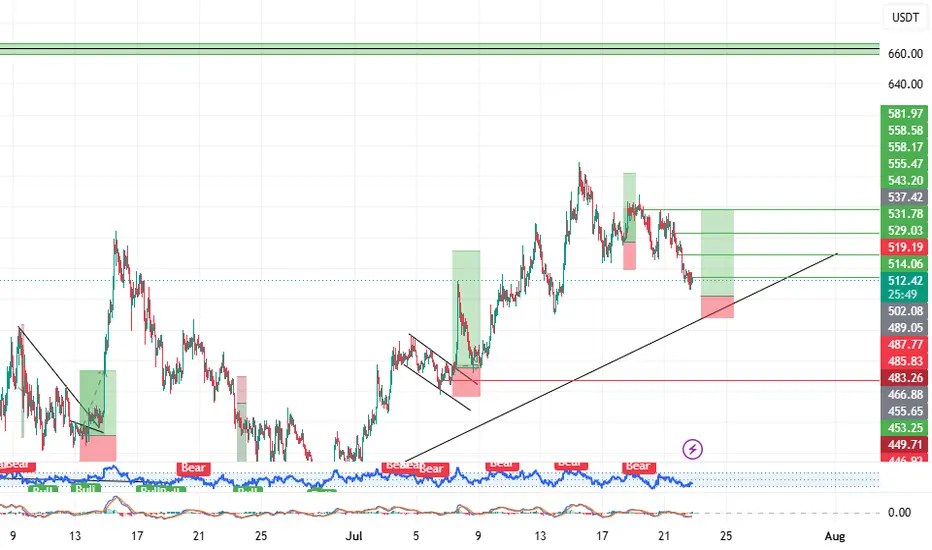
ZEC USDT LONG SIGNAL#82. ZEC/USDT – Trade Setup (LONG)
📈 Position Type: LONG
🕒 Timeframe: 1H
📊 Market: Futures
💰 Entry Zone:
537.49
🛑 Stop-Loss:
519.18
🎯 Take-Profit Targets:
• TP1: 547.29
• TP2: 558.38
• TP3: 569.90
• TP4: 582.11
⚙️ Leverage:
5 *10
▫️ After TP1, move SL to Entry + 0.2%.
▪️ Exit Plan:
• 40% at TP1
• 20% at TP2
• 20% at TP3
20% at. TP4
📌 Risk Management:
Risk only 1–2% of your capital per trade.
⚠️ Always check and confirm the setup on your chart before entering the trade.
#ZECUSDT D / QM#ZECUSDT D
Zcash could decline toward the $300 area.
We're seeing a very clean QM pattern with an ideal market structure.
If price reaches either of the red supply zones and gives us a valid confirmation on a lower timeframe, we can look for short opportunities.
The setup and key levels are clearly defined.
We'll be watching it closely and keep you updated.
CRYPTOCAP:ZEC
Whether 551.55 Can Be Flipped Into Support After Breakout
Hello traders,
Follow me to stay updated with the latest market insights.
Wishing everyone a profitable trading day.
────────────────────
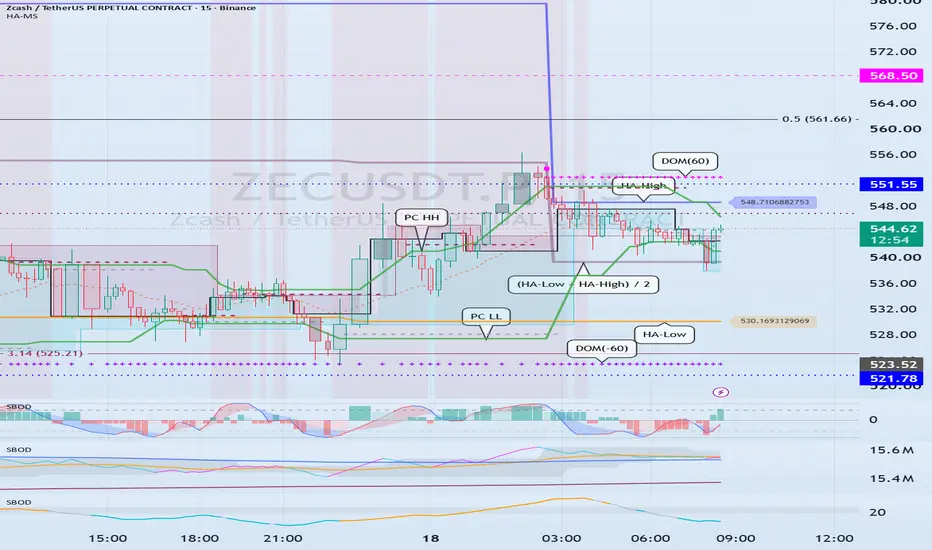
The current price is trading near the HA-High indicator, making this a short-term resistance zone where a rejection is possible.
However, if price breaks above this area and successfully flips 551.55 into support, the next upside target is 663.91.
A sustained move and acceptance above 663.91 would significantly increase the probability of a stair-step bullish trend developing.
────────────────────
📈 Conditions Required for Trend Continuation
1. StochRSI must maintain bullish momentum.
2. OBV must remain in an uptrend.
3. BSSC must stay above the zero line.
Most importantly, volume is the key factor.
For that reason, traders should closely monitor the position of OBV.
If OBV remains between the Low Line and High Line, it suggests a balance between buying and selling pressure, indicating a consolidation phase with the potential for increased volatility.
If OBV breaks above the High Line and holds there, it signals strong buying pressure entering the market, increasing the likelihood of a bullish trend continuation.
Conversely, if OBV falls below the Low Line, selling pressure gains control and the probability of a bearish trend increases.
Combining OBV analysis with StochRSI can provide a much clearer picture of potential price direction.
Currently, StochRSI is rolling over from the overbought region and moving lower.
This suggests that the current rally may face some limitations in the near term.
To overcome this resistance and continue higher, OBV must break above the High Line and maintain that position.
Ultimately, the most important factor right now is whether price can break above 551.55 and successfully establish it as support.
If the breakout fails, traders should watch whether price can find support near 521.78, where a new HA-High zone may form.
────────────────────
📊 Short-Term Outlook (15-Minute Chart)
Based on the daily timeframe analysis, short-term trading opportunities can be identified on the 15-minute chart.
The key takeaway from the daily chart is that if 551.55 cannot be flipped into support, the market is likely to revisit the 521.78 area.
Currently, price is declining between the HA-High and DOM(60) zones.
This places the immediate resistance range at:
🔹 548.71 – 552.65
A breakout above this range could trigger the formation of a stair-step bullish trend.
On the other hand, if price is rejected around 539.44, the midpoint between HA-Low and HA-High, it is likely to retest the DOM(-60) to HA-Low support zone.
📍 Key Support Zone
🔹 523.52 – 530.17
A breakdown below this zone would increase the probability of a stair-step bearish trend continuation.
────────────────────
📉 Indicator Summary
① StochRSI
StochRSI is currently attempting to enter the oversold region.
As a result, while downside pressure remains, additional downside may become increasingly limited.
② OBV
OBV is showing signs of moving below the Low Line.
This indicates growing selling pressure and increases the likelihood of bearish price action.
③ BSSC
BSSC is currently below the zero line.
Therefore, the broader trend still favors the bears.
When combining these three indicators, the current market environment leans slightly more bearish than bullish.
As such, traders should pay close attention to whether support emerges around 539.44.
────────────────────
🔍 PC LL Perspective
The PC LL line has currently disappeared.
If a new PC LL forms during a support test around 539.44, the probability of a bullish trend reversal will increase substantially.
However, if no new PC LL is formed, the current bounce should be viewed as a relief rally within the existing downtrend rather than a genuine trend reversal.
────────────────────
🎯 Trading Plan
🟢 Long Setup
• Scale into longs between DOM(-60) and HA-Low.
• Scale out between HA-High and DOM(60).
🔴 Short Setup
• Scale into shorts between HA-High and DOM(60).
• Scale out between DOM(-60) and HA-Low.
At the moment, the two most critical levels to monitor are:
✅ Whether 539.44 holds as support
✅ Whether 551.55 can be broken and reclaimed as support
In particular, traders should closely monitor whether OBV can move above the High Line alongside increasing volume.
────────────────────
Thank you for reading.
Trade safe and good luck. 🚀
ZECUSDT: Bearish Drop to 300?BINANCE:ZECUSDT is eyeing a bearish reversal on the 4-hour chart , with price testing a strong resistance zone after recent recovery, converging with a potential entry area that could trigger significant downside momentum if sellers defend amid volatility. This setup suggests a powerful pullback opportunity, targeting much lower support levels with an attractive 1:6.5 risk-reward .🔥
Entry between 520–540 (entry from current price with proper risk management is recommended). Target at 300 . Set a stop loss at a daily close above 557 , yielding a risk-reward ratio of 1:6.5 . Monitor for confirmation via a bearish candle close below entry with rising volume, leveraging the pair's weakness near resistance.🌟
📝 Trade Setup
🎯 Entry (Short):
520 – 540
(Entry from current price is valid with proper risk & position sizing.)
🎯 Target:
• 300
❌ Stop Loss:
• Daily close above 557
⚖️ Risk-to-Reward:
• 1:6.5
💡 Does ZECUSDT reject the 520–540 resistance zone and decline toward 300, or will buyers break above resistance and extend the recovery? 👇
ZECUSDT | Potential Breakout Toward 800$Zcash (ZEC) is trading at a key technical level, with an inverse head and shoulders pattern taking shape and price approaching a breakout above the neckline at 544.28.
✅ Entry confirmation: 4H candle close above 544.28
🎯 First resistance: 630
🎯 Second resistance: 690
🚀 Main target: 800 — around +46% upside
🛑 Stop loss: 4H candle close below 490 — around -10% risk
Holding above the neckline would turn the 544 area into potential support and could open the way toward 630, then 690, and possibly the full measured move to 800.
On the other hand, a 4H close below 490 would invalidate the bullish setup and cancel the breakout scenario.
Zcash remains one of the well-known privacy-focused cryptocurrencies, which can sometimes attract attention during periods of renewed altcoin momentum. Still, volatility remains high, so confirmation is essential before entering.
The idea depends on confirmation — not just touching the neckline.
#ZEC #Zcash #ZECUSDT #Crypto #TechnicalAnalysis
ZEC/USDT: Bearish OB Rejection, Channel Breakdown in PlayI’ve taken a short on ZEC after price pushed into a daily bearish order block. It also looks like the rising channel has been lost, so I’m watching to see if sellers can build on that.
If this rejection holds, my first area of interest is 410.71, followed by 363.00.
On the other hand, a strong daily close back above the order block would weaken the setup and force me to reassess.
$ZECUSD Is Showing Strong Bullish MomentumCRYPTOCAP:ZEC Is Showing Strong Bullish Momentum
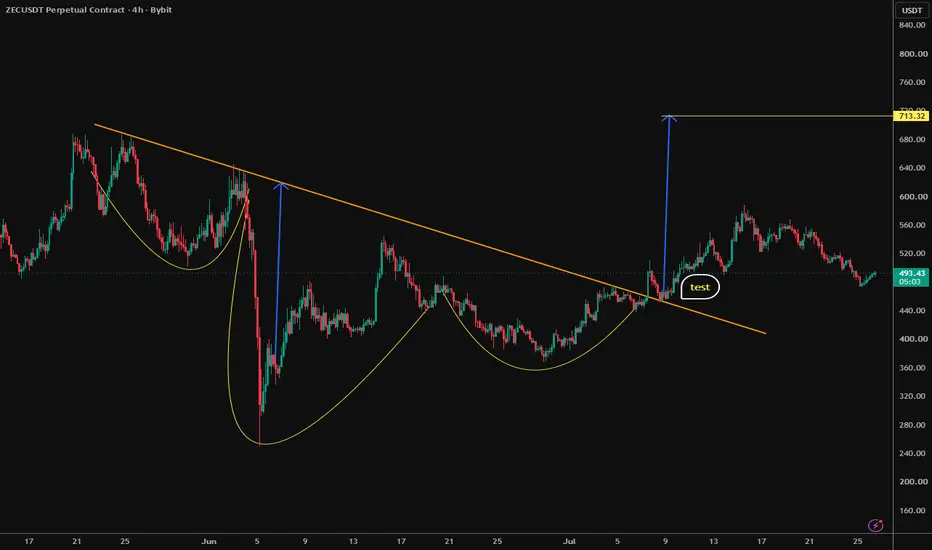
ZEC has finally broken above the descending trendline that acted as resistance for weeks. After multiple rejections, buyers managed to take control and price is now holding above the breakout area. This is an important shift in market structure and suggests the overall trend is becoming more bullish.
The key support zone remains around 495-445. As long as price continues to respect this area, the bullish outlook stays valid. RSI is holding above 50 and continues to strengthen, showing healthy momentum. Volume has also improved during the breakout, but I would still like to see stronger buying volume on the next push higher to confirm continuation.
For me, patience is still the best approach. I won't chase green candles after a strong move. The highest probability setup comes from either a healthy pullback into support with a strong bullish reaction, or a clean breakout above the recent swing high followed by a successful retest.
Conditions for LONG: Trendline breakout remains valid. Support around 495-445 holds. RSI stays above 50 and continues to strengthen. Volume increases on the next breakout. A strong close above the recent swing high confirms continuation toward the next resistance levels around 620 and 685.
$ZEC is sitting at $553.33, while the high-probability entry rem🔥 CRYPTOCAP:ZEC is sitting at $553.33, while the high-probability entry remains around $540.49.
Most traders see a pullback and hesitate.
Experienced traders see a retest of demand.
That difference often decides the trade.
📰 24H NEWS SNAPSHOT
No major protocol announcement has emerged in the past 24 hours. Market attention remains focused on Zcash's continued recovery after the June security incident and the approaching Ironwood upgrade. Recent reports note ZEC is up roughly 15% over the past week, with traders closely watching the $534-$540 area for confirmation. @binance remains one of the primary venues for ZEC liquidity.
📊 MARKET BIAS
🟢 Bullish — Price continues respecting the higher-low structure while holding above the identified buying order block.
🎯 TRADE LEVELS
📍 Entry Zone: $535.40 – $540.49
🛑 Stop Loss: $530.49
(-1.85% | Risk: 1% of portfolio)
🎯 TP1: $560.00
(+3.61% | 1.95:1 RR)
🎯 TP2: $590.49
(+9.25% | 5.00:1 RR)
🎯 TP3: Open / Trail Above $590.49 if bullish momentum accelerates.
📐 Overall R:R: ~5:1
🧠 CHART ANALYSIS
The 1H chart shows a strong impulsive rally followed by healthy sideways consolidation instead of aggressive selling.
Price is now retesting the $535.40-$540.49 bullish order block, suggesting buyers are defending previous demand.
As long as $530.49 remains intact, bulls maintain control.
A decisive move above $560 would strengthen the probability of continuation toward $590.49.
🛡️ RISK MANAGEMENT TIP
Avoid chasing green candles.
If price loses $530.49, accept the invalidation and wait for a fresh setup instead of widening your stop.
📚 EDUCATIONAL NUGGET
Many traders focus only on breakouts.
Professional traders often wait for the retest after the breakout, where the risk is smaller and the reward-to-risk ratio is significantly better.
Most traders freeze when price revisits support.
Don't freeze.
The order block around $540 already told you what to do.
💬 Would you take this retest or wait for a breakout above $560? Let me know below.
#ZEC #Zcash #CryptoTrading #TechnicalAnalysis #CryptoSignals #PriceAction #Altcoins #Binance
𝗭𝗘𝗖 𝗗𝗮𝗶𝗹𝘆 𝗧𝗿𝗶𝗮𝗻𝗴𝗹𝗲𝗭𝗘𝗖 𝗗𝗮𝗶𝗹𝘆 𝗧𝗿𝗶𝗮𝗻𝗴𝗹𝗲 𝗪𝗶𝘁𝗵 𝗦𝘁𝗼𝗰𝗵𝗥𝗦𝗜 𝗕𝘂𝘆 𝗦𝗶𝗴𝗻𝗮𝗹
CRYPTOCAP:ZEC is currently trading inside a large symmetrical triangle on the daily chart, with price being compressed between descending resistance and rising support.
Historical studies show that roughly 𝟲𝟬% 𝗼𝗳 𝘀𝘆𝗺𝗺𝗲𝘁𝗿𝗶𝗰𝗮𝗹 𝘁𝗿𝗶𝗮𝗻𝗴𝗹𝗲𝘀 continue in the direction of the previous trend. Upward breakouts can produce an average move of around 𝟯𝟰%, although not every breakout reaches its full technical target.
The daily StochRSI has now generated another buy signal from oversold territory. On this chart, the previous completed signals have shown a strong success rate, with most leading to rebounds of approximately 𝟯𝟬% 𝘁𝗼 𝟱𝟬%.
In the short term, a pullback is still possible because the 𝟰-𝗵𝗼𝘂𝗿 𝗰𝗵𝗮𝗿𝘁 is showing a StochRSI sell signal. These sell signals have also worked well recently and could push CRYPTOCAP:ZEC back toward the lower trendline before a larger move begins.
For that reason, the most attractive entry would be near the 𝗹𝗼𝘄𝗲𝗿 𝗯𝗼𝘂𝗻𝗱𝗮𝗿𝘆 𝗼𝗳 𝘁𝗵𝗲 𝘁𝗿𝗶𝗮𝗻𝗴𝗹𝗲, as this offers a stronger risk-to-reward setup.
The first target is around $𝟲𝟬𝟬, followed by $𝟴𝟬𝟬 after a confirmed breakout above the descending resistance line. Ideally, the breakout should be supported by increasing volume.
The bullish setup remains valid as long as the rising trendline holds. A clear daily close below this support would weaken or invalidate the setup.
ZEC: local squeeze with $640 destinationThe Macro Picture 🗺️
ZEC went through a violent structural reset — the late-May $685 highs collapsed in a single wick to $250 before buyers stepped in hard. That kind of capitulation flush is exactly what carves durable floors, and what followed proves it: price built a base above $400 and has since ripped higher in an aggressive momentum move back to $565, dragging RSI up toward 65. The character of the tape has flipped from distribution to accumulation-driven markup. Price is now pressing the upper end of the recovery, and the path of least resistance points toward the ground it lost on the way down.
The Setup ⚙️
The Support Flip: The $480 shelf now acts as support beneath price. As marked on the chart, the recovery is holding well above the $400 macro floor, and this structure is the pivot the bullish case rests on.
The Reaction: The push into $560 is the first real test of overhead supply left behind by the June breakdown. A shallow pullback that holds shows buyers defending the move rather than abandoning it.
The Ceiling: The $600 decision line is the trigger. A clean reclaim confirms the higher-high structure and opens the path directly toward the $640 macro resistance above.
The Roadmap: Primary target sits at $640 — the green roadmap points there as momentum carries price out of the base. Invalidation: a clean daily close below $400 would invalidate this bullish thesis and signal the recovery has failed.
More setups in profile.
#ZEC #CRYPTO #Zcash #Privacy #TechnicalAnalysis