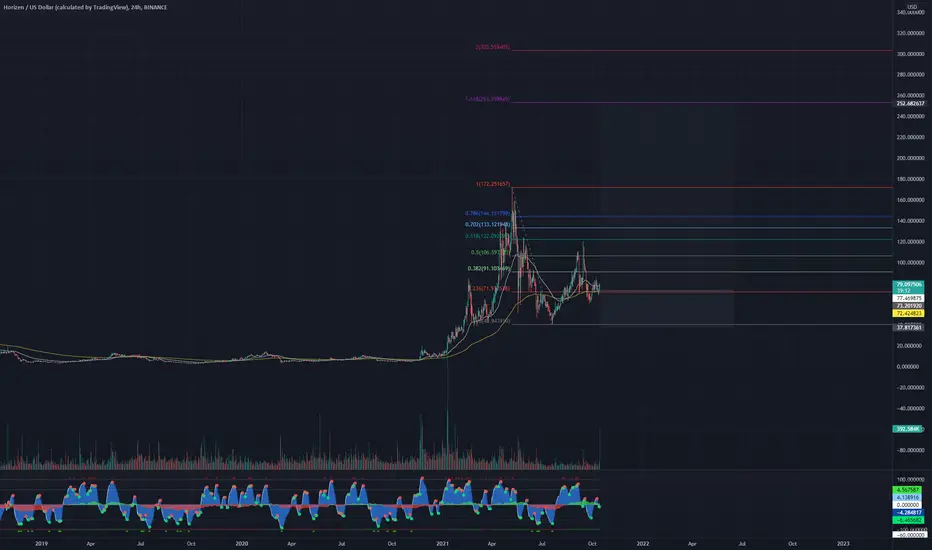
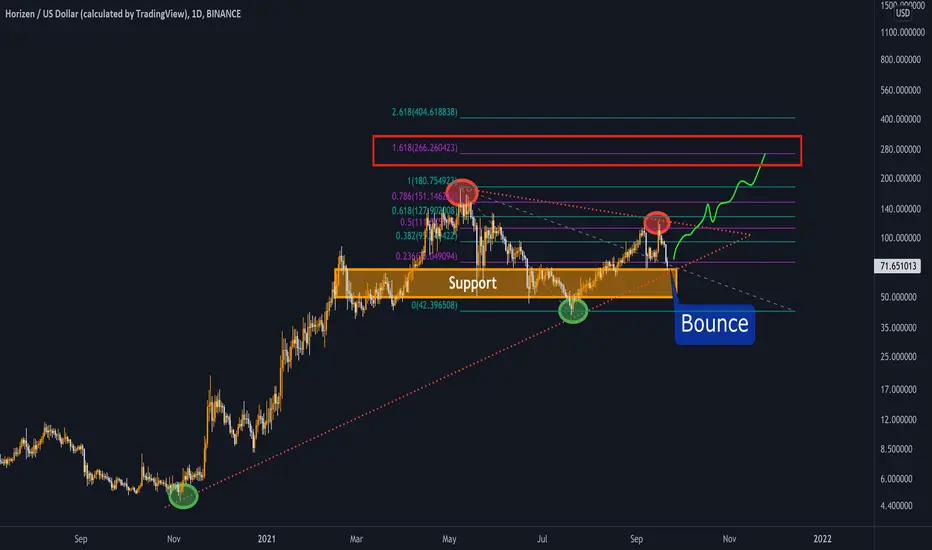
Horizen BullishDemand Zone touch. Confirmed price retracement rom november rally + trend shift. Ready to move up. Target are the highs. 25,45 and more. Longby tradesbyxmode112
ZEN-USD pressing range highs as buyers defend key support:Current Price: 8.73 (Analysis was generated on Monday Morning) Direction: LONG Confidence level: 63%(Based on limited but bullish-leaning social data, supportive technical structure, and price holding near support despite mixed market conditions) Targets Target 1: 9.20 Target 2: 9.55 Stop Levels Stop 1: 8.45 Stop 2: 8.15 Key Insights: Here’s what’s driving this setup. ZEN-USD is trading just above a clearly defined support zone around $8.50–$8.85, a level that traders across multiple platforms are watching closely. Price has repeatedly held this area while volume stayed elevated, which tells me buyers are active and defending dips instead of stepping aside. What also stands out is momentum structure. Short-term moving averages are slightly above the medium-term trend, and MACD remains marginally positive. This isn’t explosive strength, but it does suggest that downside pressure is limited unless broader crypto markets roll over hard. With price sitting closer to support than resistance, the risk-reward favors upside follow-through toward the upper end of the recent range. Recent Performance: Over the last 24 hours, ZEN-USD traded between roughly $8.85 and $9.50 before pulling back to the current $8.73 area. Despite that pullback, it’s still holding above last week’s lows and showing resilience compared with several other mid-cap Layer-1 assets. Volume remains healthy relative to market cap, which tells me these moves aren’t happening on thin liquidity. Expert Analysis: Several traders are framing ZEN as a “range-with-a-bias” asset right now. The repeated mentions of $9.50 as a key ceiling and $8.85 as critical support shape this week’s trade plan. I’m not seeing aggressive downside calls from the trading crowd; instead, the consensus tone leans toward waiting for a push higher rather than positioning for a breakdown. From a chart perspective, RSI sitting near the mid-range means there’s room to move higher without immediately running into exhaustion. That’s one of the reasons I’m comfortable taking a long with defined stops instead of trying to fade strength prematurely. News Impact: Recent exchange visibility and Layer-1 performance chatter have helped keep ZEN on traders’ radars. There’s no major negative headline pressuring the asset right now, and even modest positive developments, like ecosystem upgrades or broader altcoin rotation, could be enough to push price back toward the $9.50 area this week. Trading Recommendation: Putting it all together, I’m favoring a LONG position on ZEN-USD for this week. The setup works because price is holding above support, downside risk can be clearly defined, and upside targets align with levels many traders are already watching. I’d keep position size moderate, aim for $9.20 first, then $9.55 if momentum builds, and respect stops below $8.45 if the market proves this view wrong. Longby CrowdWisdomTrading0
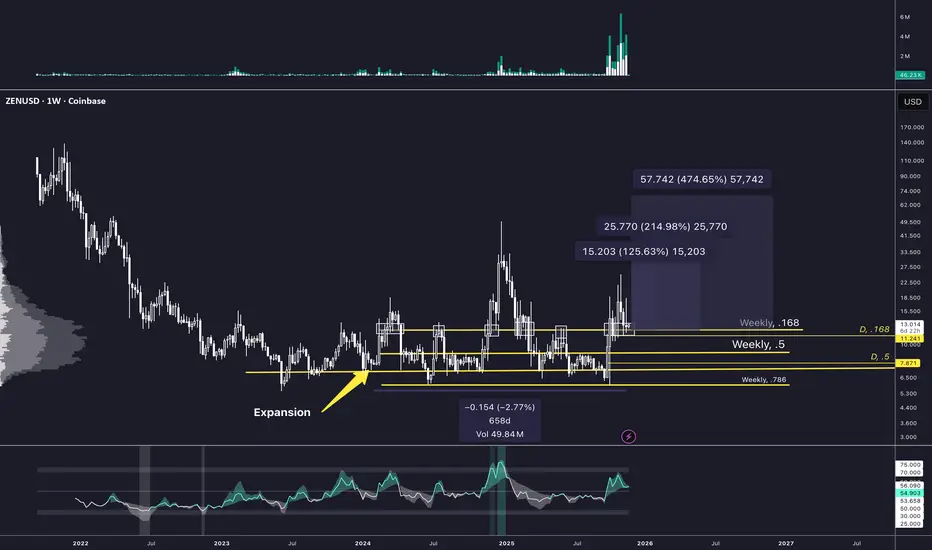
Zen - BullishThis weekly chart shows a multi-year compression range that has repeatedly expanded into large upside volatility when price reclaims the same set of mid-range levels. Every major impulse in the past two years began from failed breakdowns and quick recoveries inside this zone. Price has once again expanded off the lower boundary and reclaimed the mid-range area around 11–12. Historically, this has triggered strong follow-through moves as volatility shifts from contraction to expansion. The prior expansion legs from this level pushed into the 15, 25 and 57 zones, which are marked as upside projection targets. The structure is simple: long-term support continues to hold, breakdowns fail, and each reclaim of the mid-range leads to aggressive expansion. As long as price holds above the weekly levels shown, the next expansion phase remains intact with the same historical upside ranges active.Longby TenderTown2
ZEN $15 another ZEC maybe???how are the privacy coins as the season is just warming up with ZEC and MONERO taking the lead this one seems to be at so under valued levels thanks to Trader @day0 for the tip you got to follow this guy as his instincts is wired in the market NFA guys not financial advice just trying my luck with this Fed cut and Trump $2k stimulus packageby Osang1112
Follow The Algos...Think this is going to repeat what Zec/Dash has done so worth taking a punt on.Longby Swoop610
MOON IT...Chart looks poised for a breakout and large trend reversal here - expect crazy numbers going forward if this ends up correct.Longby Swoop611
Horizen ZEN Takes Off After Dec 17 Listing on gTradeCOINBASE:ZENUSD Is really taking off after listing on gTrade December 17th, just a few days ago. The market is seeing some fantastic growth right now, and has popped to the top of Coinbase Top Gainers chart today, showing crazy gains in the last 24 hours. When you research this project, you will be happy to learn Horizen is technically innovative, and in fact, there is even a Greyscale Horizen Trust derivative fund available for institutional investors. All of this looks very positive for the ZEN token. Other factors in the current price action include the recent (2nd and final) halving event celebrated on December 18th, 2024. Given this happened only days ago, and combined with the listing on gTrade, and Top Gainer status on Coinbase, this project has a bright outlook. With such a solid foundation, Horizen is moving forward the Web3 landscape, as well as generating new excitement with its recent excellent performance! ZEN is #1 in last 24hrs as of this writing on coinranking.com Currently the price is around $28, and showing an impressive 24hr gain of 65.52%, with market cap at $142.82M USD. Remeber Habibi, the desert tests your will, not your strength. www.horizen.io gains.trade www.grayscale.com Longby CoinrabiaDeFi6
take a long in 15 minutes candlesbreak of resistance though if you have time on the screens wait for retest and get in.ZLongby mashemo5
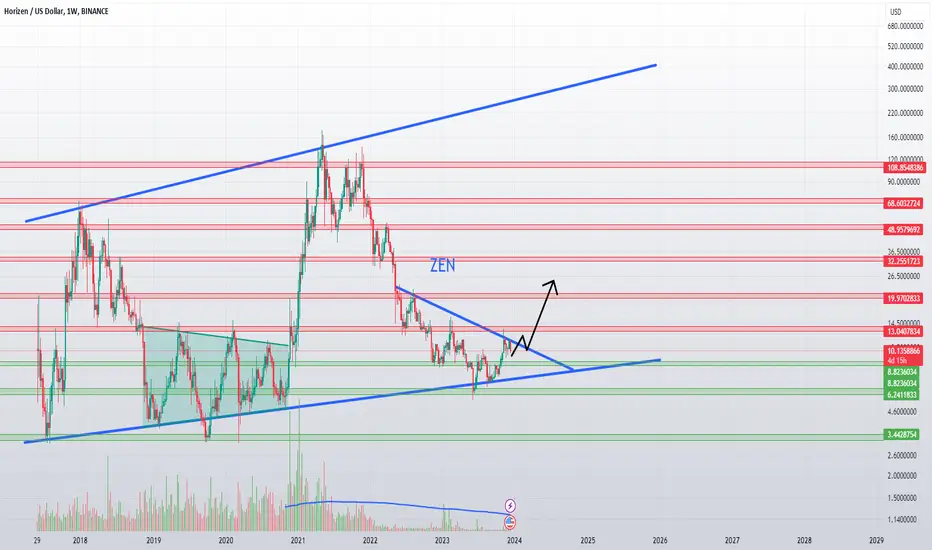
ZENUSD 1W LONG📈Hi all. Timeframe 1 week. ZENUSD is globally in an ascending channel, consolidating at support. I consider going long during a breakout/retest of a trend line. Marked key levels and goals on the chart.ZLongby KvazarBTCUpdated 15
✴️ Horizen LongTerm BullMarket Projection | $450? Sounds Like...I am not going to make a price prediction for this one but I would like to do a projection of the next bull market. The bullish and bearish phases are stuck together. As soon as prices go up, they start to come crashing down and the proceeding consolidation phase is the major part. Most of the time Horizen is going sideways, consolidating and this is very easy to spot on the chart. After the consolidation phase a bull-market develops, followed by a bear-market and then a new consolidation phase. The current consolidation phase started mid-2022 and has been going for more than a year... It can go for as long as it needs... Focus on the long-term. Once this phase is over, we will get green. It can go to 100, 200, 300 or beyond? Huge potential with very low risk. Namaste.Longby MasterAnanda1124
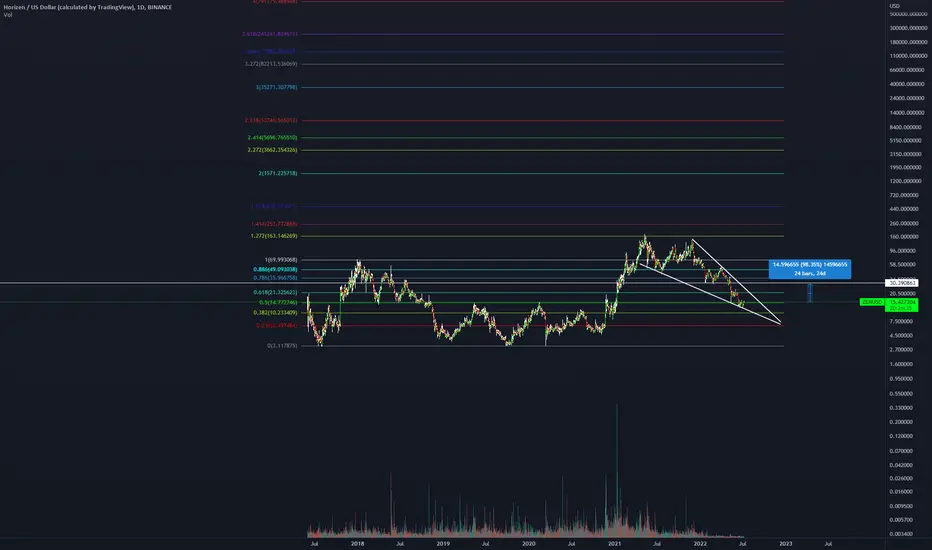
Horizen (ZEN)Horizen's big picture is promising; an inverted wedge pattern, a big one. This means as prices move forward, bigger waves are possible. Currently, price is at the bottom of this pattern. Also, a big harmonic pattern has ended too. So, a tempting situation is forming. Let's see what happens.ZLongby SaeedSalehinia114
zenusdtThe historical decline took place in the form of three Elliott waves and ended with a C wave, a five-year decline, an extension, so we are supposed to see a corrective rise in the form of three waves that take us to the shaded area, and it represents 50 Fibonacci of the entire historical decline, so we will see what happens Note: The ascent fails if it breaks the 8.3 usdt area and closes below itZLongby KhaldHegazy114
ZEN USDZEN USD LOG CHART 4 HOURS NETURAL -ZEN is in a descending channel from most recent top. -white circles on upper and lower channel. One of these will get hit. -If we get above the Golden Line in the center, I think the upper circle will get hit, which will put zen at an position of possible rocketing towards $17+++ -If we go lower, I will try to catch some Zen at support zones, which will significant delay the time of it going to 17+. -OSCILLATOR is at the 4 Hour ZERO LINE. This is a SIGNIFICANT Point and will determine the short term move of ZEN. ZK narrative can play a big role of and I think a Bear Trap can take place, with the rest of the market retesting lower support zones.by solventura1
ZEN USDZEN USD 1D Daily Chart LOG CHART Neutral. -ZEN Is at the top range of a major multi month descending channel. -Zen is also in the mid range on the upward ascending channel. A break up the long term descending channel (WHITE) will send ZEN to the top range of the Ascending Channel (Yellow)by solventura1
ZEN Looks Good.... 1st time publishing a chart to ChatThe Chart speaks for itself... If this survives it might pop big soon. Longby WindSurfer67111
ZEN Volume PredominanceZEN demonstrating volume predominance exhibited as a series of demand tests in the vertical bars. This may -- or may not -- denote a potential markup brewing on the horizon. As usual, take up to the 6.18 if the PA surpasses the first fib zone barrier with continued demand, but be cautious in holding past the 2.0% as we are still on shaky ground with Bitcoin. The house of cards can fall at any time. *If you like making money on swings, be sure to subscribe for more dynamic & easy-to-follow Wyckoff/VSA charts with win ratios averaging between 80-85% in hitting the profit zones. I've been swing trading crypto fulltime since 2017 and handpick all my runners after conducting a series of careful volume spread reads and Wyckoff technical analysis. Not all of them win, but trading is a numbers game and the winners more than compensate for the losers. Check out my past charts and observe the win rates for yourself, then follow me and see that I'm all about making money; it's the only reason I'm here, and I want you to make money too! (Because it makes me look good ;) **Not financial advice. Please DYOR and trade at your own risk.Longby jalapabloUpdated 1
Zen Falling Wedge - Zen Falling Wedge Setup Weekly RSI = Oversold A move to the 78.6% regionZLongby STP_MrNodeItAll115
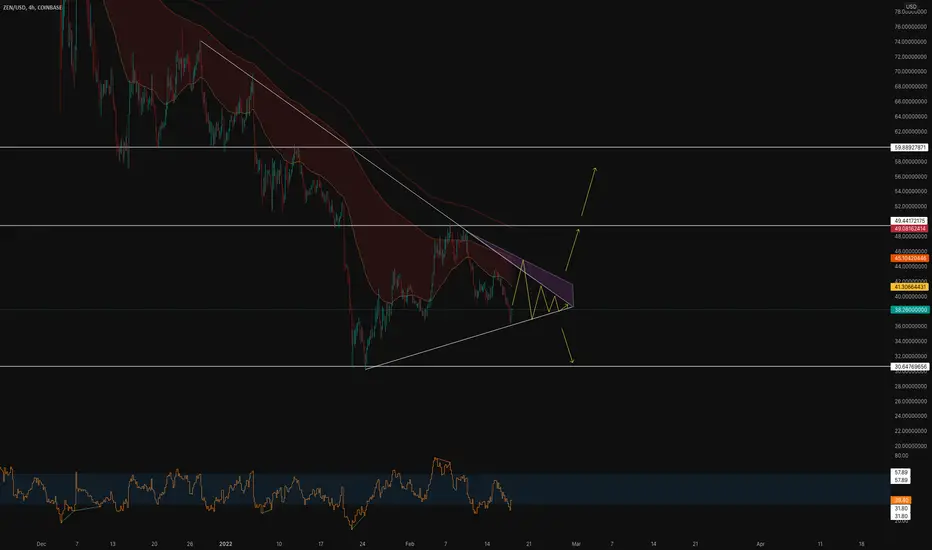
ZEN triangleZEN triangle is formed and ready soon to break out to the upside or to the downsideby Dandady2
Long ZEN/USDI like the fibs on ZEN. Will boom with crypto market cap moon mission.ZLongby Smelly_DogUpdated 333
ZEN - some considerationsIf we zoom out - there is a clear flat in the middle of a larger structure. Such consolidations are typical in the middle of the waves B within larger flat patterns. So, on daily, we have wave A, now in the mid of wave B, and it will be completed by a strong dump to test the end of wave A. Two basic options: - a running flat (higher high by the wave B and failed break of A); - regular flat (wave A will be broken and price will move up in a strong trending move) Good luck and hope this helps. Zby UnknownUnicorn3382580228
ZEN might see retraction soon (short term)ZEN on top of trading channel and about to hit a major resistance. RSI past 70, but volume not showing enough bullish impetus to break resistance. If it does break resistance, it will pump hard to fill the gap. by mannymkayUpdated 2
Horizen BRIGHT FUTURE!looks great here. you can see it has bounced back up from the diagonal line and is preparing next weeks to break up. BTW Grayscale owns a ton of this coin. Wonder whyZLongby Toni_G21117
Horizen (ZEN) - July 27Hello? Welcome, traders. By "following", you can always get new information quickly. Please also click "Like". Have a nice day. ------------------------------------- (ZECUSD 1W Chart) If the price holds above the 37.8826710 point, it is expected that the uptrend will continue. (1D chart) If the price is maintained in the range of 51.9057483-75.5574533, it is expected to turn into an uptrend. If it goes down, you should check to see if it finds support at the 37.8826710-51.9057483 zone. If it declines from the 37.8826710 point, there is a possibility of entering the mid- to long-term investment zone, so you need to trade cautiously. In the CCI-RC indicator, it remains to be seen if the CCI line moves above the EMA line and can continue the uptrend. ------------------------------------- (ZENBTC 1W chart) If the price is maintained above the 128050 Satoshi-144420 Satoshi range, it is expected that the upward trend will continue. (1D chart) If the price is maintained in the 142590 Satoshi-194880 Satoshi section, it is expected to turn into an uptrend. If it goes down, you should see support in the 116440 satoshi-142590 satoshi range. If it falls from the 116440 Satoshi point, there is a possibility of entering the mid- to long-term investment area, so careful trading is required. ------------------------------------------ We recommend that you trade with your average unit price. This is because, if the price is below your average unit price, whether it is in an uptrend or in a downtrend, there is a high possibility that you will not be able to get a big profit due to psychological burden. The center of all trading starts with the average unit price at which you start trading. If you ignore this, you may be trading in the wrong direction. Therefore, it is important to find a way to lower the average unit price and adjust the proportion of the investment, ultimately allowing the funds corresponding to the profits to regenerate themselves. ------------------------------------------------------------ ------------------------------------------- ** All indicators are lagging indicators. Therefore, it is important to be aware that the indicator moves accordingly with the movement of price and volume. However, for the sake of convenience, we are talking in reverse for the interpretation of the indicator. ** The wRSI_SR indicator is an indicator created by adding settings and options to the existing Stochastic RSI indicator. Therefore, the interpretation is the same as the traditional Stochastic RSI indicator. (K, D line -> R, S line) ** The OBV indicator was re-created by applying a formula to the DepthHouse Trading indicator, an indicator disclosed by oh92. (Thanks for this.) ** See support, resistance, and abbreviation points. ** Support or resistance is based on the closing price of the 1D chart. ** All descriptions are for reference only and do not guarantee a profit or loss in investment. Explanation of abbreviations displayed in the chart R: A point or section of resistance that requires a response to preserve profits. S-L: Stop Loss point or section S: A point or section where you can buy to make a profit as a support point or section. (Short-term Stop Loss can be said to be a point where profit and loss can be preserved or additional entry can be made through split trading. It is a short-term investment perspective.) GAP refers to the difference in prices that occurred when the stock market, CME, and BAKKT exchanges were closed because they are not traded 24 hours a day. G1 : Closing price when closed G2: Opening price (Example) Gap (G1-G2) Zby readCrypto6

 Long
Long