ZRX / ZRXUSDT Bullish Setup | Futures Trade IdeaMARKET ANALYSIS
ZRX is currently reacting from a key technical area highlighted on the chart.
As long as the protected support zone remains intact, the bullish market structure remains valid and higher liquidity targets may continue to attract price action.
A breakdown below the invalidation level would weaken the current bullish scenario and require a reassessment of market conditions.
📍 Entry, Stop Loss and Take Profit levels are marked directly on the chart.
━━━━━━━━━━━━━━
⚠️ DISCLA
In-depth trading ideas
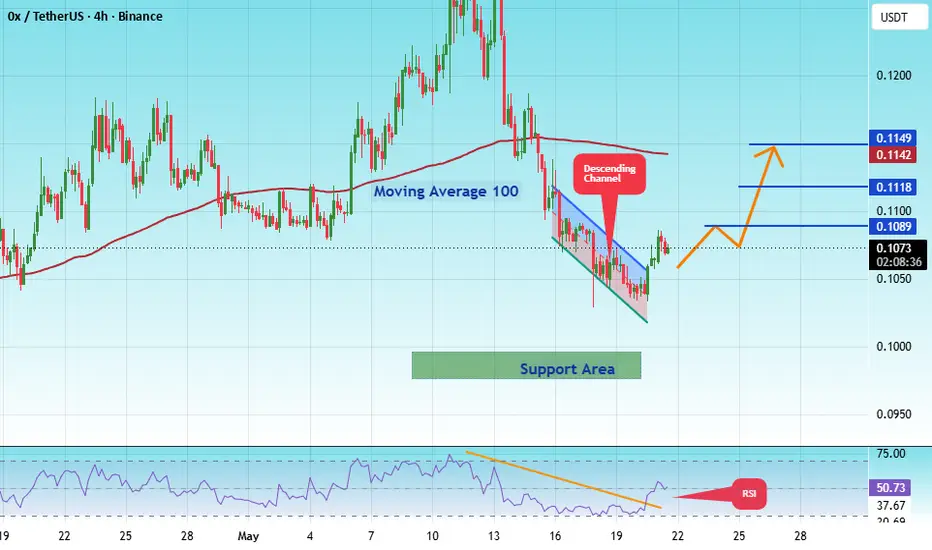
#ZRXUSDT Bullish Impulse, New All-Time High Late 2025#ZRX
The price is moving within a descending channel on the 1-hour timeframe and has reached the lower boundary. It is now poised for a bounce and is expected to retest this boundary.
The Relative Strength Index (RSI) indicates a downward trend, which is likely to continue given the overbought conditions.
There is a key support zone (in green) at 0.0979. The price has bounced off this zone several times, making it a strong support level.
The price is trending towards the 100-period moving a
ZRX — Major Trendline Breakout: Is a Bullish Reversal Coming?💵 Coin: NEWCONNECT:ZRX / USDT
⏳ Time Frame: 3D
📉 Market Structure: Long-term Downtrend → Potential Trend Reversal
📐 Pattern: Descending Trendline Breakout + Base/Accumulation Zone
🎯 Key Support Zone: 0.0952 – 0.0830
🚀 Potential Target: 10%+
---
🔻 Previous Structure
ZRX/USDT has been moving within a long-term downtrend, characterized by a series of Lower Highs (LH) and consistent selling pressure.
📉 Price repeatedly faced rejection whenever it approached the descending trendline, making the
#ZRXUSDT Bullish Impulse, New All-Time High Late 2026
#ZRX
The price is moving within a descending channel on the 1-hour timeframe and has reached the lower boundary. It is now poised for a bounce and is expected to retest this boundary.
The Relative Strength Index (RSI) indicates a downward trend, which is likely to continue given the overbought conditions.
A key support zone has been identified in green at 0.0745. The price has bounced off this zone several times, making it a strong support level.
The price is trending towards the 100-perio
ZRX USDT SHORT SIGNAL78. ZRX/USDT – Trade Setup (SHORT)
📈 Position Type: SHORT
🕒 Timeframe: 1H
📊 Market: Futures
💰 Entry Zone:
0.0977
0.1015
🛑 Stop-Loss:
0.1048
🎯 Take-Profit Targets:
• TP1: 0.0946
• TP2: 0.0919
• TP3: 0.0883
• TP4. 0.0850
Tp5.
⚙️ Leverage:
5*10
▫️ After TP1, move SL to Entry + 0.2%.
▪️ Exit Plan:
• 40% at TP1
• 20% at TP2
• 20% at TP3
20% at TP4
📌 Risk Management:
Risk only 1–2% of your capital per trade.
⚠️ Always check and confirm the setup on your chart before entering
#ZRXUSDT Bullish Impulse, New All-Time High Late 2026#ZRX
The price is moving within a descending channel on the 1-hour timeframe and has reached the lower boundary. It is now poised for a bounce and is expected to retest this boundary.
The Relative Strength Index (RSI) indicates a downward trend, which is likely to continue given the overbought conditions.
There is a key support zone in green at 0.0758, and the price has bounced off this zone several times, making it a strong support level.
The price is trending towards the 100-period moving
ZRX: local squeeze with $0.1016 destinationThe Macro Picture 🗺️
ZRX unwound from the $0.12884 macro ceiling into a range and is now balancing at $0.08636, in the middle of the band above the $0.07315 floor. The tape has flattened into rotation as it works off the downtrend.
The Setup ⚙️
The Range Floor 🟢
$0.07315 (Macro Support) is the demand base, with $0.07751 (Local Low) as the nearer shelf. Both have held, and that's the floor this range pivots on.
The Decision Point 🔴
$0.09461 (Local High) is the gate. A daily close above it fli
ZRXUSDT Forming Bullish MomentumZRXUSDT is forming a clear bullish momentum pattern, a classic bullish wave signal that often indicates an upcoming breakout. The price has been consolidating within a narrowing range, suggesting that selling pressure is weakening while buyers are beginning to regain control. With consistent volume confirming accumulation at lower levels, the setup hints at a potential bullish breakout soon. The projected move could lead to an impressive gain of around 20% to 30% once the price breaks above the
ZRX FROM 2017I think ZRX has hit the bottom of the price again since 2017. I expect the price to grow to $0.28 and if it can break the ceiling of the descending channel, it will definitely grow to $1.86. Currently, the monthly RSI and MACD are negative. The price has not touched the monthly Bollinger Bands, but with all these bad points, I believe that the growth season of this currency is starting. Good luck
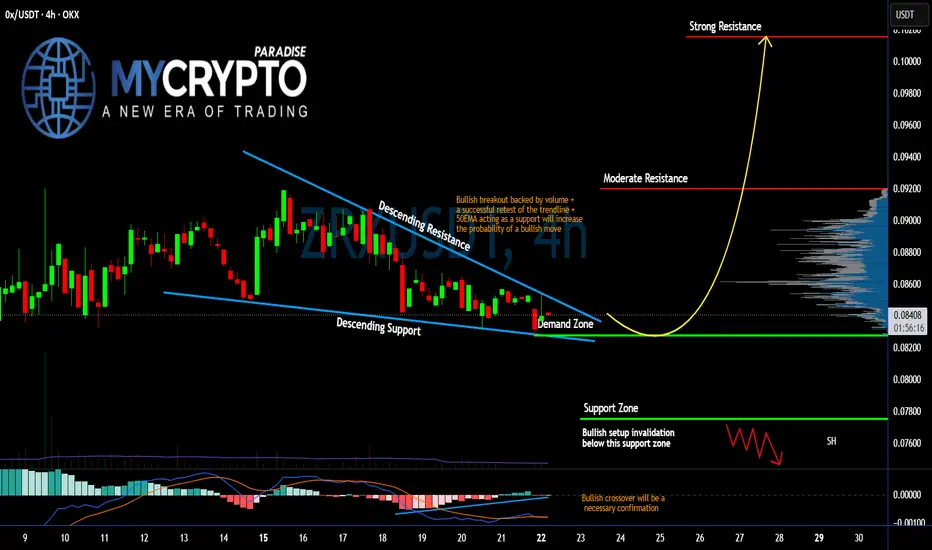
Is #ZRX Ready For a Short Term Recovery or Not? Key Levels Yello, Paradisers! Is #ZRX preparing a major bullish breakout from this compression pattern, or will impatient traders get shaken out? Let's view #OxProtocol trading setup:
💎#ZRXUSDT is currently trading inside a falling wedge structure on the 4H timeframe, where both resistance and support are gradually converging. After several days of controlled selling pressure, the price has now reached a key demand zone around $0.082, where buyers have already started showing interest. This area represent
#ZRXUSDT Bullish Impulse, New All-Time High Late 2025#ZRX
The price is moving within a descending channel on the 1-hour timeframe and has reached the lower boundary. It is now poised for a bounce and is expected to retest this boundary.
The Relative Strength Index (RSI) indicates a downward trend, which is likely to continue given the overbought conditions.
There is a key support zone in green at 1042. The price has bounced off this zone several times, making it a strong support level.
The price is trending towards the 100-period moving averag
ZRX/USDT — Downtrend Pressure Weakening, Potential Breakout?On the 3D timeframe, ZRX/USDT is still in a prolonged downtrend, clearly marked by a strong descending trendline (yellow line). Price continues forming lower highs & lower lows, indicating seller dominance.
However, current price action shows:
Consolidation at the bottom
Price beginning to respect support levels
Potential retest of the trendline as a key resistance
---
📉 Structure & Pattern Formation
🔻 Descending Trendline (Dynamic Resistance)
Main resistance since the start of the dow
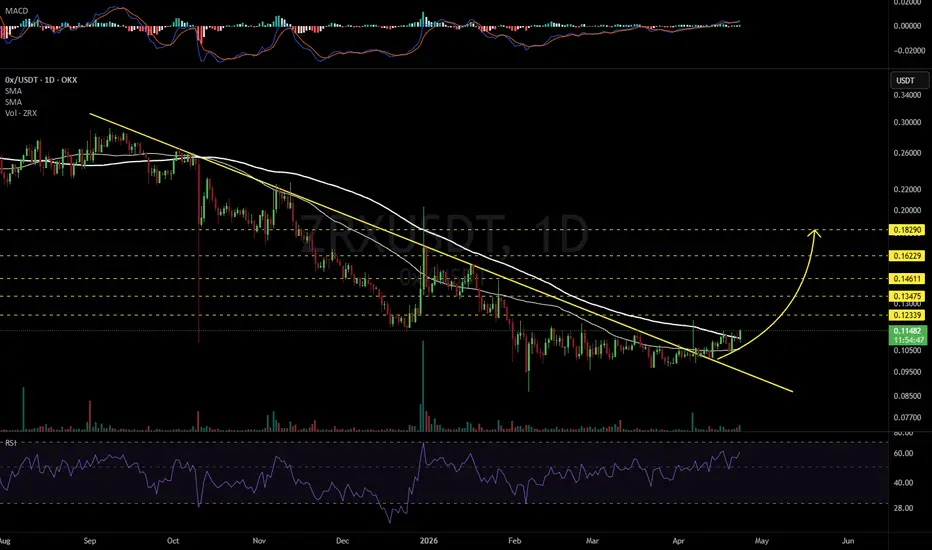
ZRXUSDT 1D#ZRX appears to have strong upside potential in the current market conditions. It is trading above the daily SMA50 and is also breaking out above the daily SMA100. Further upside movement is expected:
🎯 $0.12339
🎯 $0.13475
🎯 $0.14611
🎯 $0.16229
🎯 $0.18290
⚠️ Always remember to use a tight stop-loss and maintain proper risk management.
#ZRXUSDT Bullish Impulse, New All-Time High Late 2025#ZRX
The price is moving within a descending channel on the 4-hour timeframe. It has reached the lower boundary and is trending towards a bounce. A retest of this boundary is expected.
The Relative Strength Index (RSI) indicates a downward trend, and this trend is likely to continue due to the overbought condition.
There is a key support zone in green at 0.0970. The price has bounced off this zone several times, making it a strong support level.
The price is trending towards the 100-period m
#ZRXUSDT Bullish Impulse, New All-Time High Late 2025#ZRX
The price is moving within a descending channel on the hourly timeframe. It has reached the lower boundary and is trending towards a bounce. A retest of this boundary is expected.
The Relative Strength Index (RSI) indicates a downward trend, and this trend is likely to continue due to the overbought condition.
There is a key support zone in green at 0.0993, and the price has bounced off this zone several times, making it a strong support level.
The price is trending towards the 100-peri
#ZRX/USDT Bullish Impulse, New All-Time High Late 2025
#ZRX
The price is moving within a descending channel on the hourly timeframe. It has reached the lower boundary and is trending towards a bounce. A retest of this boundary is expected.
The Relative Strength Index (RSI) indicates a downward trend, and this trend is likely to continue due to the overbought condition.
There is a key support zone in green at 0.0993, and the price has bounced off this zone several times, making it a strong support level.
The price is trending towards the 100-pe
#ZRX/USDT Bullish Impulse, New All-Time High Late 2025#ZRX
The price is moving within a descending channel on the hourly timeframe. It has reached the lower boundary and is heading towards a breakout, with a retest of the upper boundary expected.
The Relative Strength Index (RSI) is showing a downward trend, approaching the lower boundary, and an upward bounce is anticipated.
There is a key support zone in green at 0.1020, and the price has bounced from this level several times and is expected to bounce again.
The indicator is showing a trend t