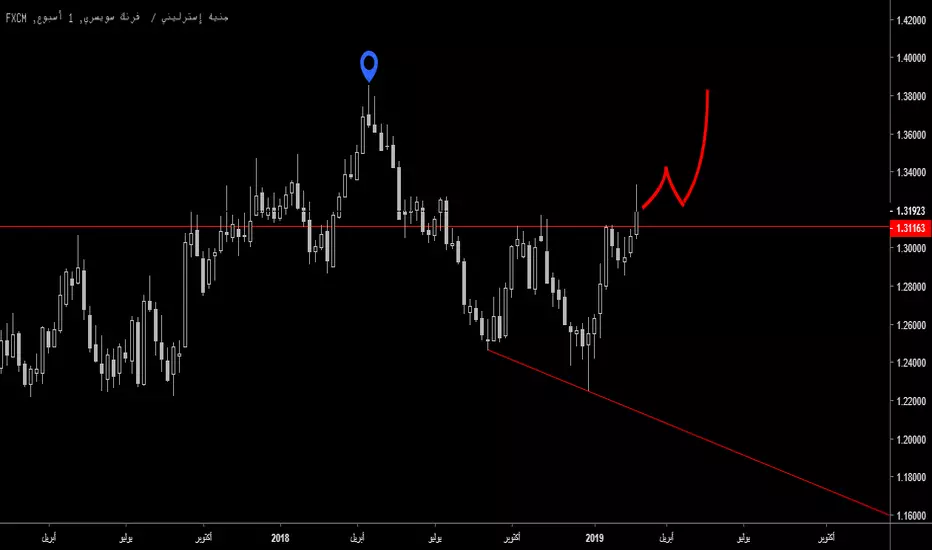
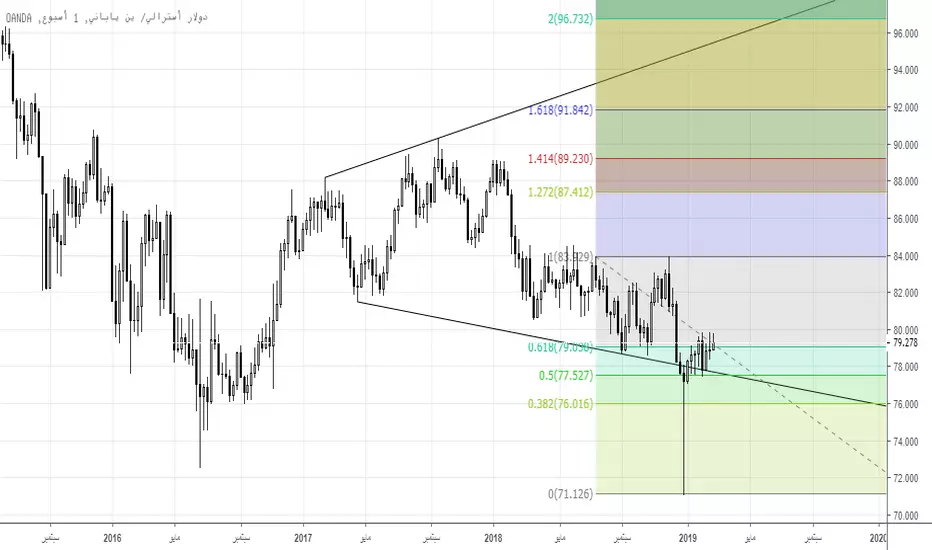
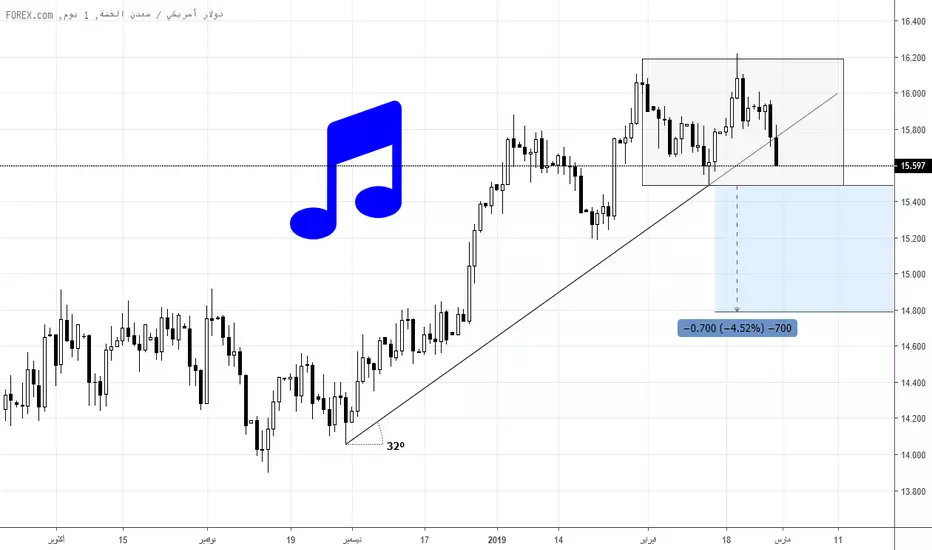
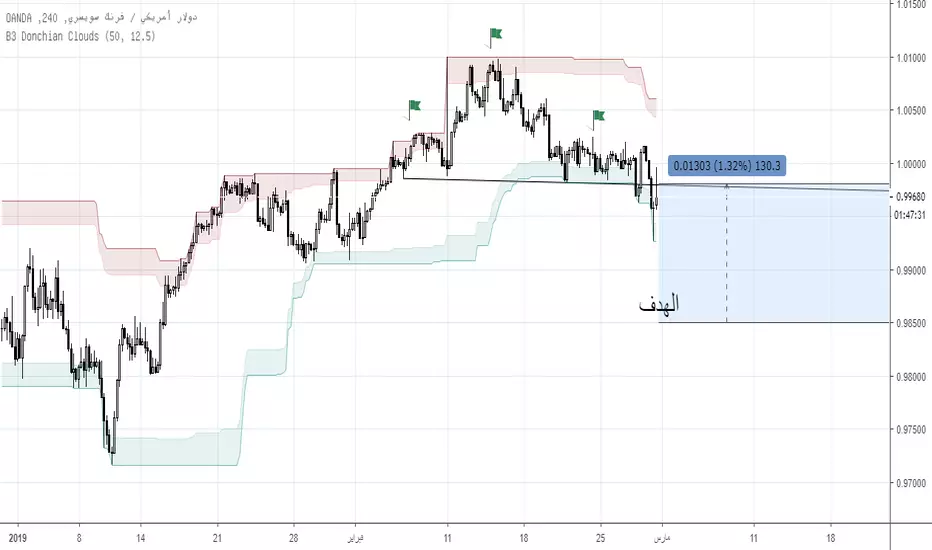
بيع
بيع
 شراء
شراء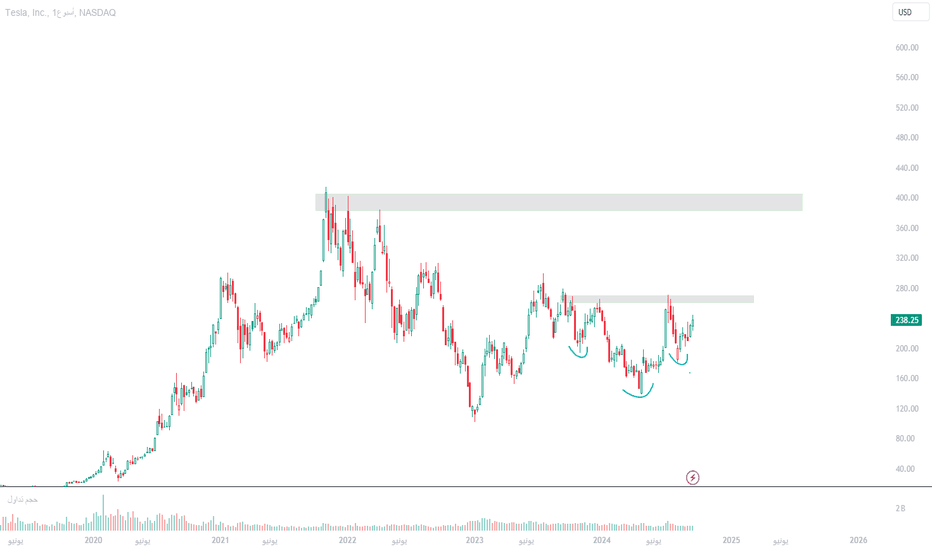
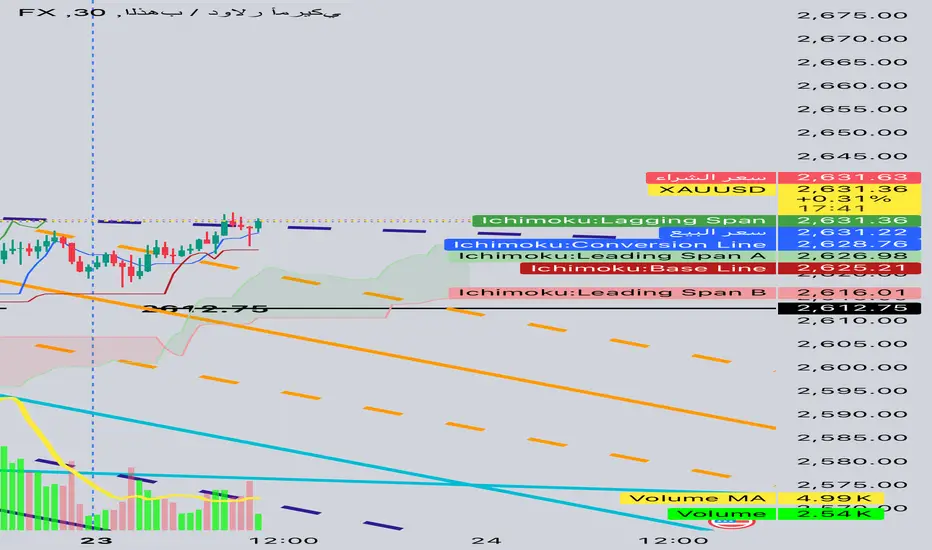
Advanced Multi-Timeframe Ichimoku Kinko Hyo Analysis SummaryAdvanced Multi-Timeframe Ichimoku Kinko Hyo Analysis Summary
1. Kumo (Cloud) Analysis:
• 30-Min Chart: Thin Kumo suggests high volatility.
• 1-Hour Chart: Cloud thickening above $2,628 provides strong support.
• Daily Chart: Bullish breakout evident with price above Kumo, though nearing resistance at Senkou Span B.
2. Tenkan/Kijun Crosses (TK/KS):
• Strong bullish cross on all timeframes, particularly significant on 1-hour. Cross above the Kumo further validates momentum.
3. Chikou Span:
• All timeframes show Chikou Span above price action, reinforcing bullish bias.
4. Ichimoku Timing Cycles (9, 17, 26):
• Daily suggests potential retracement in 17 periods (aligning with $2,637).
• Shorter timeframes align with continuation cycles around $2,633.
Actionable Signals:
1. Entry Opportunities (Multi-Timeframe):
• Buy Limit: $2,628.50 (near VWAP and Tenkan).
• Buy Stop: $2,633 (breakout confirmation above resistance).
2. Take Profit Levels:
• TP1: $2,633
• TP2: $2,637
• TP3: $2,645
3. Stop Loss & Trailing Stop:
• SL: $2,625 (below Kumo & VWAP).
• TSL: Trail 5 points under each new high  شراء
شراء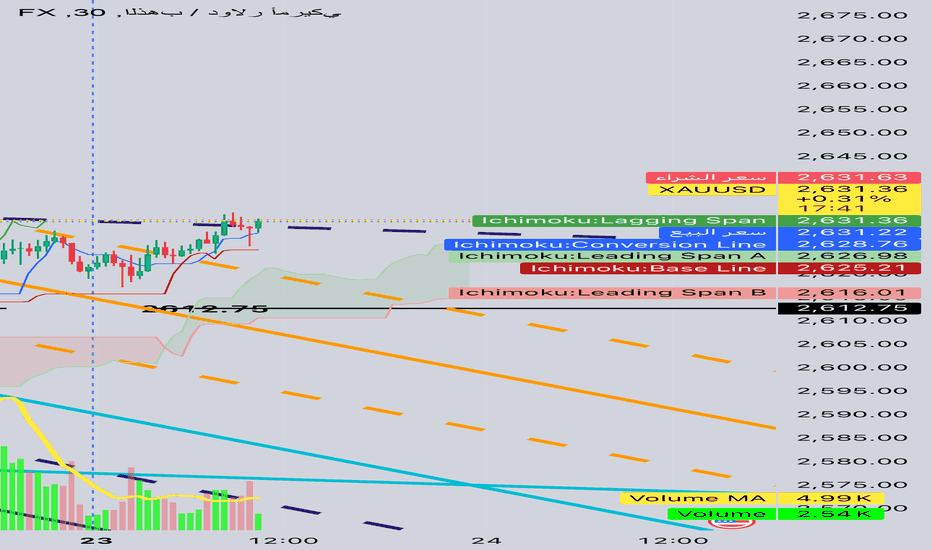
 شراء
شراء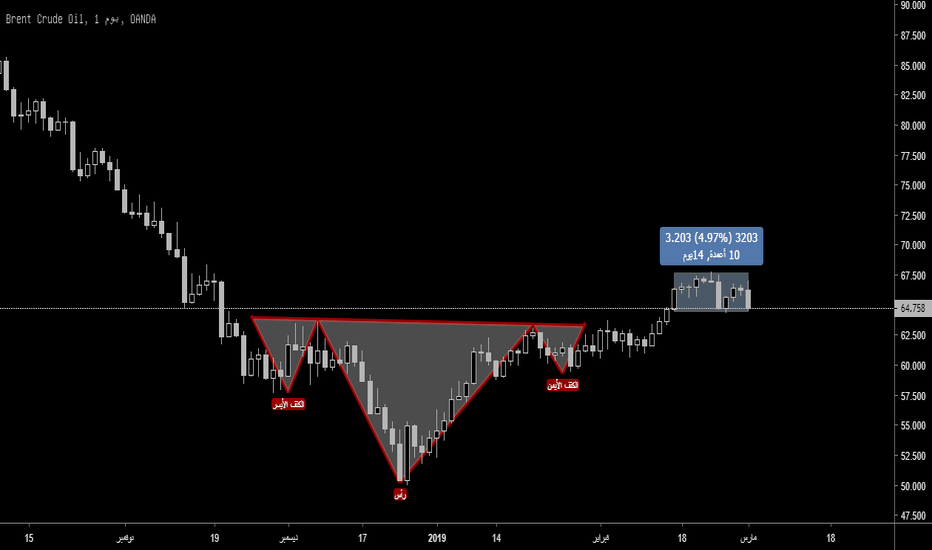
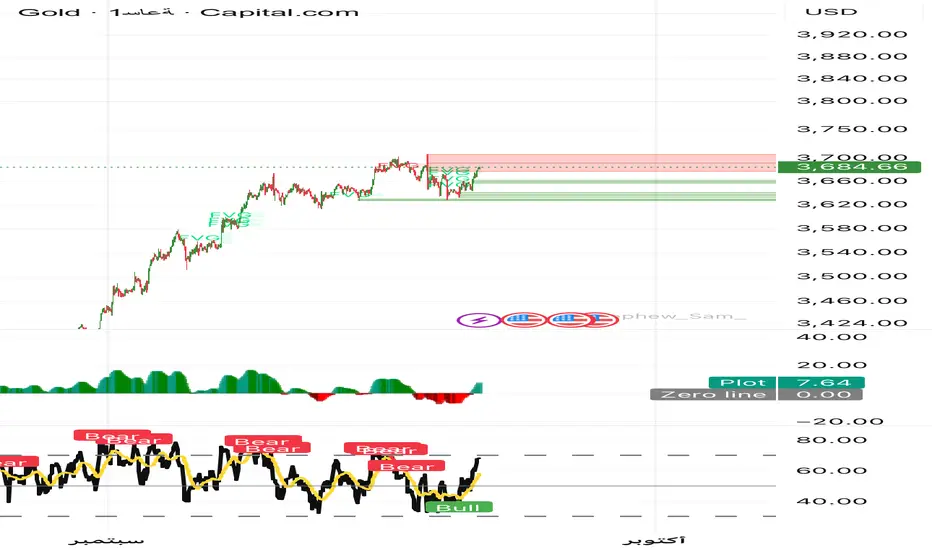
تحليل ذهب فريم ساعة🔹 التحليل الفني (Technical)
• السعر الحالي 3,684 بعد ارتداد قوي من الدعم 3,630.
• الذهب يواجه منطقة عرض (مقاومة) واضحة باللون الأحمر عند 3,700 – 3,710.
• مناطق FVG (فجوات سعرية) أسفل السعر عند 3,660 – 3,630، وقد يعود السعر لإغلاقها.
• مؤشر الزخم يظهر صعود قوي لكن قرب التشبع الشرائي.
⸻
🔹 التحليل الموجي (Elliott Waves)
• الذهب في موجة خامسة صاعدة قصيرة.
• هذه الموجة قد تكتمل عند 3,700 – 3,720 ثم يبدأ تصحيح (A-B-C) نحو 3,660 – 3,630.
⸻
🔹 التحليل الزمني (Time Cycles)
• الدورة الحالية الصاعدة بدأت من 20 سبتمبر.
• من المتوقع بلوغ قمة زمنية خلال 22 – 23 سبتمبر، ومن ثم يبدأ تصحيح.
⸻
🔹 التحليل الأساسي (Fundamentals)
• الذهب مدعوم بتوقعات تخفيف السياسة النقدية للفيدرالي مع تباطؤ التضخم.
• لكن أي بيانات أمريكية قوية (CPI أو NFP أو الفائدة) قد تضغط عليه للهبوط.
• ضعف الدولار يعزز الطلب على الذهب في المدى القصير.
⸻
🔹 التحليل الرقمي (Quantitative)
• Pivot Zone: 3,660 – 3,670
• الدعوم: 3,660 – 3,630 – 3,580 – 3,500
• المقاومات: 3,700 – 3,720 – 3,760 – 3,800
⸻
🔹 البرايس أكشن (Price Action)
• الشموع الأخيرة تظهر زخم صعودي قوي لكن باقتراب من منطقة عرض حمراء (3,700).
• أي رفض سعري من هذه المنطقة قد يشير لبداية تصحيح.
⸻
🔹 النماذج الفنية (Chart Patterns)
• احتمالية تكوين Double Top عند 3,700 – 3,710.
• الذهب ما زال ضمن قناة صاعدة قصيرة المدى.
⸻
🔹 النماذج الرقمية
• المستويات الرقمية الأهم: 3,630 (دعم)، 3,700 (مقاومة)، 3,760 (قمة محتملة).
⸻
🔹 نماذج الهارمونيك (Harmonic)
• ملامح لنموذج Bearish Gartley أو Bat في حال وصل السعر 3,700 – 3,720.
• الهدف الهبوطي للنموذج قد يكون 3,630 – 3,580.
⸻
🔹 المنطقة المحورية (Pivot Zone)
• 3,660 – 3,670 هي المنطقة الفاصلة:
• فوقها = صعود نحو 3,700 – 3,720.
• تحتها = تصحيح نحو 3,630.
⸻
🔹 نقاط التثبيت (Fixation Levels)
• أعلى تثبيت: 3,720
• أدنى تثبيت: 3,630
⸻
✅ التوصية
• قصير المدى (Intraday):البحث عن انعكاس لل بيع من قرب 3,700 – 3,720 مع وقف خسارة فوق ,، أهداف 3,660 – 3,630.
• متوسط المدى (Swing): إذا كسر 3,630 → استهداف 3,580 – 3,500.
• السيناريو البديل: إذا اخترق السعر 3,760 بإغلاق قوي → استهداف 3,800
ملاحظة هامة
نحن لانقدم لك نصائح مالية واستثمارية
بل نقدم لك محتوى علمي وثقيفي
انت شخص الوحيد المسؤل عن ضغط زر الييع والشراء
المحلل
المهندس ايهاب
قناة سيد الذهب تحليل بتكوين🔹 التحليل الفني (Technical)
• السعر الحالي 115,333 داخل منطقة دعم خضراء 115,500 – 114,900.
• المؤشرات السفلية (Histogram & RSI) تعكس ضعفاً في الزخم مع سيطرة البائعين.
• هناك مناطق FVG غير مغلقة حول 115,800 – 116,200 مما قد يجذب السعر في ارتداد قصير.
⸻
🔹 التحليل الموجي (Elliott Waves)
• البيتكوين في موجة رابعة تصحيحية داخل دورة صاعدة أكبر.
• احتمالية الهبوط لمستوى 114,600 – 114,900 قبل انطلاق موجة خامسة صاعدة تستهدف 117,000 – 118,000.
⸻
🔹 التحليل الزمني (Time Cycles)
• الدورة الحالية الهابطة بدأت منذ 18 سبتمبر.
• من المتوقع تكوين قاع زمني خلال 21 – 22 سبتمبر، ومنه قد يبدأ ارتداد صاعد.
⸻
🔹 التحليل الأساسي (Fundamentals)
• البيتكوين يتأثر حالياً بعوامل:
1. تصريحات الفيدرالي وقرارات الفائدة (ضغط قصير المدى).
2. تدفقات المؤسسات وصناديق ETF تدعم الاتجاه الصاعد على المدى المتوسط.
3. التذبذب بسبب ضعف السيولة آخر الأسبوع.
⸻
🔹 التحليل الرقمي (Quantitative)
• Pivot Zone: 115,800 – 116,000
• الدعوم: 115,000 – 114,600 – 113,800
• المقاومات: 116,200 – 117,000 – 118,000
⸻
🔹 البرايس أكشن (Price Action)
• الشموع الأخيرة تظهر رفض صعود عند 115,800.
• ولكن وجود ذيول طويلة سفلية عند 115,000 يشير إلى تجميع شرائي محتمل.
⸻
🔹 النماذج الفنية (Chart Patterns)
• تكوّن نموذج Range عرضي بين 115,000 – 116,200.
• أي كسر واضح لأحد الطرفين سيحدد الاتجاه التالي.
⸻
🔹 النماذج الرقمية
• التكرارات السعرية تدعم 114,600 – 115,000 كمنطقة ارتداد.
⸻
🔹 نماذج الهارمونيك (Harmonic)
• احتمال تكوين نموذج Bullish Bat إذا لمس السعر 114,600 ثم ارتد بقوة.
• أهداف النموذج تصل إلى 117,000 – 118,000.
⸻
🔹 المنطقة المحورية (Pivot Zone)
• 115,800 – 116,000 هي المنطقة الفاصلة:
• تحتها = ضغط هابط.
• فوقها = استئناف صعود.
⸻
🔹 نقاط التثبيت (Fixation Levels)
• أعلى تثبيت: 118,000
• أدنى تثبيت: 114,600
⸻
✅ التوصية
• السيناريو الشرائي (الأقوى): شراء من 115,000 – 114,600 مع وقف خسارة أسفل 113,800، أهداف 116,200 – 117,000 – 118,000.
• السيناريو البيعي (البديل): إذا كسر 114,600 → بيع نحو 113,800.
• إدارة المخاطر: لا تتجاوز 2-3% من رأس المال بسبب تقلبات عالية
ملاحظة هامة
نحن لانقدم لك نصائح مالية واستثمارية
بل نقدم لك محتوى علمي وثقيفي
انت شخص الوحيد المسؤل عن ضغط زر الييع والشراء
المحلل
المهندس ايهاب
قناة سيد الذهب  بيع
بيع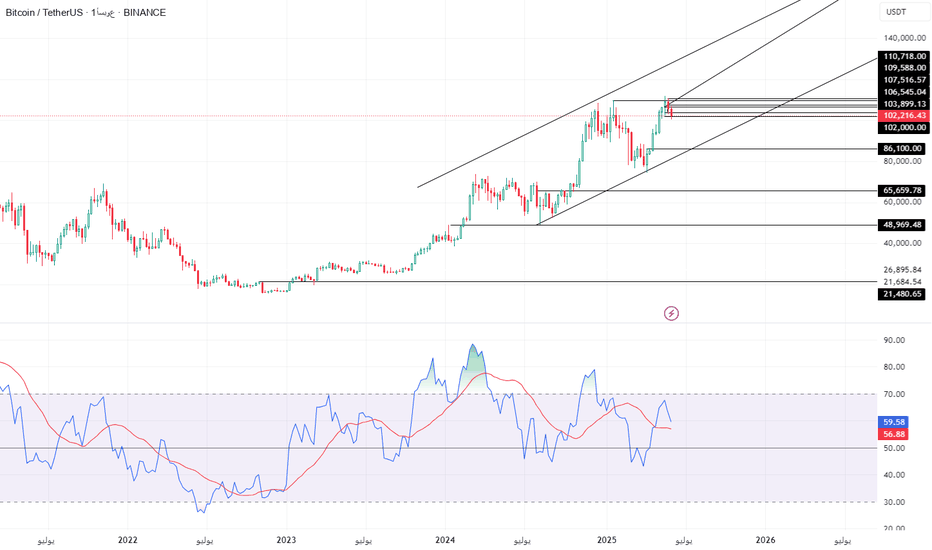
كوفي النخيل //@version=5
indicator("NOVA ALGO", overlay = true)
// Get user input
nbuysell = input.bool(true, 'Buy/Sell Signal', inline = "BSNM",group='BUY/SELL SIGNAL')
nsensitivity = input.float(defval=2, title="-", inline = "BSNM", minval=1, maxval=20, group='BUY/SELL SIGNAL')
//candlecolor = input.bool(true, 'Buy/Sell Signal', inline = "BSNM",group='BUY/SELL SIGNAL')
// Trend Features
LongTrendAverage = input(true, 'Trend Cloud', group='TREND FEATURES')
TrendFollower = input(true, 'Trend Follower', group='TREND FEATURES')
ShowComulus = input(true, 'Comulus Cloud', group='TREND FEATURES')
CirrusCloud = input(true, 'Cirrus Cloud', group='TREND FEATURES')
enableReversal = input.bool(false, 'Dynamic TP 👁️ ', inline = 'overlayLine1', group = 'Settings')
// Risk Management
levels = input.bool(true, "Show TP/SL Levels" , group = "Risk Management" , inline = "MMDB2")
lvlLines = input.bool(true, "Show Lines ", inline="levels", group = "Risk Management")
linesStyle = input.string("SOLID", "", , inline="levels", group = "Risk Management")
lvlDistance = input.int(1, "Distance", 1, inline="levels2", group = "Risk Management")
lvlDecimals = input.int(2, " Decimals", 1, 8, inline="levels2", group = "Risk Management")
atrRisk = input.int(1, "Risk % ", 1, group = "Risk Management" , inline="levels3")
atrLen = input.int(14, " ATR Length", 1, group = "Risk Management" , inline="levels3")
decimals = lvlDecimals == 1 ? "#.#" : lvlDecimals == 2 ? "#.##" : lvlDecimals == 3 ? "#.###" : lvlDecimals == 4 ? "#.####" : lvlDecimals == 5 ? "#.#####" : lvlDecimals == 6 ? "#.######" : lvlDecimals == 7 ? "#.#######" : "#.########"
// Input settings
history_of_demand_to_keep = 20
show_zigzag = false
show_price_action_labels = false
showsr = input(true, title="Show Support & Resistance", group = 'Support & Resistance')
swing_length = input.int(defval=8, title="Sensitivity", group = 'Support & Resistance')
box_width = input.float(defval=4, title="Zone Width", group = 'Support & Resistance')
box_extend_option = input.string("Right", title="Extend Box", options= , group = 'Support & Resistance')
res = input.timeframe(title='Time Frame', defval='', group="Support & Resistance")
s1 = request.security(syminfo.tickerid, res, showsr, gaps=barmerge.gaps_on)
demand_color = input.color(color.rgb(0,188,212,70), title = 'Support & Resistance Color', group = 'Support & Resistance')
supply_color = input.color(color.rgb(178,40,51,70), title = '', group = 'Support & Resistance')
// Signal Generation
supertrend(_close, factor, atrLen) =>
atr = ta.atr(atrLen)
upperBand = _close + factor * atr
lowerBand = _close - factor * atr
prevLowerBand = nz(lowerBand )
prevUpperBand = nz(upperBand )
lowerBand := lowerBand > prevLowerBand or close < prevLowerBand ? lowerBand : prevLowerBand
upperBand := upperBand < prevUpperBand or close > prevUpperBand ? upperBand : prevUpperBand
int direction = na
float superTrend = na
prevSuperTrend = superTrend
if na(atr )
direction := 1
else if prevSuperTrend == prevUpperBand
direction := close > upperBand ? -1 : 1
else
direction := close < lowerBand ? 1 : -1
superTrend := direction == -1 ? lowerBand : upperBand
// SMA
ocAvg = math.avg(open, close)
sma4 = ta.sma(close, 8)
sma5 = ta.sma(close, 9)
sma9 = ta.sma(close, 13)
psar = ta.sar(0.02, 0.02, 0.2)
//*in Easy Words Super Trend + SMA = Signals
= supertrend(close, nsensitivity*2, 11)
source = close, period = 150
// Colors
green = #2BBC4D, green2 = #00DD00
red = #C51D0B, red2 = #DD0000
adxlen = 15
dilen = 15
dirmov(len) =>
up = ta.change(high)
down = -ta.change(low)
plusDM = na(up) ? na : up > down and up > 0 ? up : 0
minusDM = na(down) ? na : down > up and down > 0 ? down : 0
truerange = ta.rma(ta.tr, len)
plus = fixnan(100 * ta.rma(plusDM, len) / truerange)
minus = fixnan(100 * ta.rma(minusDM, len) / truerange)
adx(dilen, adxlen) =>
= dirmov(dilen)
sum = plus + minus
adx = 100 * ta.rma(math.abs(plus - minus) / (sum == 0 ? 1 : sum), adxlen)
adx
sig = adx(dilen, adxlen)
// range ADX threshold
sidewaysThreshold = input.int(title='ADX Sideways Threshold (10-30)', minval=2, defval=15)
// boolean expression to see if the ADX is below tehe sideways threshold
bool isSideways = sig < sidewaysThreshold
// adding the option to color the bars when in a trading range
useBarColor = true
bColor = isSideways ? color.new(#4b148d, 0) : na
barcolor(useBarColor ? bColor : na)
barcolor(close > supertrend ? #00e2ff : #fe0100)
// High Lows
y1 = low - (ta.atr(30) * 2), y1B = low - ta.atr(30)
y2 = high + (ta.atr(30) * 2), y2B = high + ta.atr(30)
bull = ta.crossover(close, supertrend) and close >= sma9
bear = ta.crossunder(close, supertrend) and close <= sma9
// Plots
windowsize = 100
offset = 0.9
sigma = 6
//plot(ta.alma(source, windowsize, offset, sigma))
windowsize2 = 310
offset2 = 0.85
sigma2 = 32
//plot(ta.alma(source, windowsize2, offset2, sigma2))
// Chart Features
smoothrng(x, t, m) =>
wper = t * 2 - 1
avrng = ta.ema(math.abs(x - x ), t)
smoothrng = ta.ema(avrng, wper) * m
smoothrng
smrng = smoothrng(close, 22, 6)
rngfilt(x, r) =>
rngfilt = x
rngfilt := x > nz(rngfilt ) ? x - r < nz(rngfilt ) ? nz(rngfilt ) : x - r : x + r > nz(rngfilt ) ? nz(rngfilt ) : x + r
rngfilt
filt = rngfilt(close, smrng)
// ▒▒▒▒▒▒▒▒▒▒▒▒▒▒▒▒▒▒▒▒▒▒▒▒▒▒▒▒▒▒▒▒▒▒▒▒▒▒▒▒▒▒▒▒▒▒▒▒▒▒▒▒▒▒▒▒▒▒▒▒▒▒▒▒▒▒▒▒▒▒▒▒▒▒▒▒▒▒▒▒▒▒▒▒▒▒▒▒▒▒▒▒▒▒▒▒▒▒▒▒▒▒▒▒▒▒▒▒▒▒▒▒▒▒
upward = 0.0
upward := filt > filt ? nz(upward ) + 1 : filt < filt ? 0 : nz(upward )
downward = 0.0
downward := filt < filt ? nz(downward ) + 1 : filt > filt ? 0 : nz(downward )
filtcolor = upward > 0 ? color.new(#00e2ff, 50) : downward > 0 ? color.new(#fe0100, 50) : color.new(#56328f, 0)
plot(TrendFollower ? filt : na, color=filtcolor, linewidth=1, title='Trend Tracer')
// Trend Cloud
tclength = 600
hullma = ta.wma(2*ta.wma(close, tclength/2)-ta.wma(close, tclength), math.floor(math.sqrt(tclength)))
plot(LongTrendAverage ? hullma : na, 'Trend Cloud', linewidth=4, color=close > hullma ? color.new(#00e2ff, 65) : color.new(#fe0100, 65))
// Comulus Cloud
candle = ta.alma(source, windowsize2, offset2, sigma2)
reach = ta.alma(source, windowsize, offset, sigma)
candlep = plot(ShowComulus ? candle : na, color=color.new(color.white, 100))
reachp = plot(ShowComulus ? reach : na, color=color.new(color.white, 100))
fill(reachp, candlep, color= candle > reach ? color.new(#fe0100, 85) : color.new(#00e2ff, 85))
// Chart Features
x1 = 22
x2 = 9
x3 = 15
x4 = 5
smoothrngX1(x, t, m) =>
wper = t * 2 - 1
avrng = ta.ema(math.abs(x - x ), t)
smoothrngX1 = ta.ema(avrng, wper) * m
smoothrngX1
smrngx1x = smoothrngX1(close, x1, x2)
smrngx1x2 = smoothrngX1(close, x3, x4)
rngfiltx1x1(x, r) =>
rngfiltx1x1 = x
rngfiltx1x1 := x > nz(rngfiltx1x1 ) ? x - r < nz(rngfiltx1x1 ) ? nz(rngfiltx1x1 ) : x - r : x + r > nz(rngfiltx1x1 ) ? nz(rngfiltx1x1 ) : x + r
rngfiltx1x1
filtx1 = rngfiltx1x1(close, smrngx1x)
filtx12 = rngfiltx1x1(close, smrngx1x2)
// ▒▒▒▒▒▒▒▒▒▒▒▒▒▒▒▒▒▒▒▒▒▒▒▒▒▒▒▒▒▒▒▒▒▒▒▒▒▒▒▒▒▒▒▒▒▒▒▒▒▒▒▒▒▒▒▒▒▒▒▒▒▒▒▒▒▒▒▒▒▒▒▒▒▒▒▒▒▒▒▒▒▒▒▒▒▒▒▒▒▒▒▒▒▒▒▒▒▒▒▒▒▒▒▒▒▒▒▒▒▒▒▒▒▒
upwardx1 = 0.0
upwardx1 := filtx1 > filtx1 ? nz(upwardx1 ) + 1 : filtx1 < filtx1 ? 0 : nz(upwardx1 )
downwardx1 = 0.0
downwardx1 := filtx1 < filtx1 ? nz(downwardx1 ) + 1 : filtx1 > filtx1 ? 0 : nz(downwardx1 )
filtx1colorx1 = color.rgb(0, 187, 212, 100)
xxx1 = plot(CirrusCloud ? filtx1 : na, color=filtx1colorx1, linewidth=1, title='Trend Tracer', editable = false)
xxx2 = plot(CirrusCloud ? filtx12 : na, color=filtx1colorx1, linewidth=1, title='Trend Tracer', editable = false)
fill(xxx1, xxx2, color= filtx1 > filtx12 ? color.new(#fe0100, 65) : color.new(#00e2ff, 65))
buy = bull and nbuysell ? label.new(bar_index, y1, sma4 >= sma5 ? "Strong Buy" : "Buy", xloc.bar_index, yloc.price, #00e2ff, label.style_label_up, color.white, size.normal) : na
sell = bear and nbuysell ? label.new(bar_index, y2, sma4 <= sma5 ? "Strong Sell" : "Sell", xloc.bar_index, yloc.price, #fe0100, label.style_label_down, color.white, size.normal) : na
// Other initializations
avg_volume = ta.sma(volume, 20)
very_weak_multiplier = 0.5
weak_multiplier = 1
strong_multiplier = 1.5
// Rejection handling
var int demandRejections = array.new_int(history_of_demand_to_keep, 0)
var int supplyRejections = array.new_int(history_of_demand_to_keep, 0)
var int demandCreationBars = array.new_int(history_of_demand_to_keep, na)
var int supplyCreationBars = array.new_int(history_of_demand_to_keep, na)
var box current_demand_box = array.new_box(history_of_demand_to_keep, na)
var box current_supply_box = array.new_box(history_of_demand_to_keep, na)
f_check_demand_rejections() =>
for i = 0 to history_of_demand_to_keep - 1
if not na(array.get(demandCreationBars, i))
if bar_index - array.get(demandCreationBars, i) > 15 and bar_index - array.get(demandCreationBars, i) % 15 == 0
label.new(bar_index, high, "Checking demand rejection", color=color.red)
dBox = array.get(current_demand_box, i)
if (na(dBox))
continue
withinBox = (high >= box.get_bottom(dBox) and high <= box.get_top(dBox)) or (close >= box.get_bottom(dBox) and close <= box.get_top(dBox))
bearishCandlesCount = math.sum(close < open ? 1 : 0, 15)
if withinBox and bearishCandlesCount >= 7
label.new(bar_index, low, "Bearish count > 7", color=color.blue)
array.set(demandRejections, i, array.get(demandRejections, i) + 1)
f_check_supply_rejections() =>
for i = 0 to history_of_demand_to_keep - 1
if not na(array.get(supplyCreationBars, i))
if bar_index - array.get(supplyCreationBars, i) > 15 and bar_index - array.get(supplyCreationBars, i) % 15 == 0
label.new(bar_index, low, "Checking supply rejection", color=color.red)
sBox = array.get(current_supply_box, i)
if (na(sBox))
continue
withinBox = (low <= box.get_top(sBox) and low >= box.get_bottom(sBox)) or (close <= box.get_top(sBox) and close >= box.get_bottom(sBox))
bullishCandlesCount = math.sum(close > open ? 1 : 0, 15)
if withinBox and bullishCandlesCount >= 7
label.new(bar_index, high, "Bullish count > 7", color=color.blue)
array.set(supplyRejections, i, array.get(supplyRejections, i) + 1)
f_array_add_pop(array, new_value_to_add) =>
array.unshift(array, new_value_to_add)
array.pop(array)
f_sh_sl_labels(array, swing_type) =>
var string label_text = na
if swing_type == 1
if array.get(array, 0) >= array.get(array, 1)
label_text := 'HH'
else
label_text := 'LH'
label.new(bar_index - swing_length, array.get(array,0), text = label_text, style=label.style_label_down, textcolor = color.white, color = color.new(color.white, 100), size = size.tiny)
else if swing_type == -1
if array.get(array, 0) >= array.get(array, 1)
label_text := 'HL'
else
label_text := 'LL'
label.new(bar_index - swing_length, array.get(array,0), text = label_text, style=label.style_label_up, textcolor = color.white, color = color.new(color.white, 100), size = size.tiny)
f_check_overlapping(new_poi, box_array, atr) =>
atr_threshold = atr * 2
okay_to_draw = true
for i = 0 to array.size(box_array) - 1
top = box.get_top(array.get(box_array, i))
bottom = box.get_bottom(array.get(box_array, i))
poi = (top + bottom) / 2
upper_boundary = poi + atr_threshold
lower_boundary = poi - atr_threshold
if new_poi >= lower_boundary and new_poi <= upper_boundary
okay_to_draw := false
break
else
okay_to_draw := true
okay_to_draw
f_supply_demand(value_array, bn_array, box_array, label_array, box_type, atr) =>
atr_buffer = atr * (box_width / 10)
box_left = array.get(bn_array, 0)
box_right = bar_index + 20
var float box_top = 0.00
var float box_bottom = 0.00
var float poi = 0.00
if box_type == 1
box_top := array.get(value_array, 0)
box_bottom := box_top - atr_buffer
poi := (box_top + box_bottom) / 2
else if box_type == -1
box_bottom := array.get(value_array, 0)
box_top := box_bottom + atr_buffer
poi := (box_top + box_bottom) / 2
okay_to_draw = f_check_overlapping(poi, box_array, atr)
swing_volume = volume
var string strength_text = ""
highest_volume_last_20 = ta.highest(volume, 20)
volume_percentage = math.round(swing_volume / highest_volume_last_20 * 100)
volume_percentage := math.min(volume_percentage, 100) // Cap the volume percentage to 100
var extend_option = extend.right
if box_extend_option == "Right"
extend_option := extend.right
else if box_extend_option == "Both"
extend_option := extend.both
if box_type == 1 and okay_to_draw and s1
box.delete( array.get(box_array, array.size(box_array) - 5) )
f_array_add_pop(box_array, box.new( left = box_left, top = box_top, right = box_right, bottom = box_bottom, border_color = color.rgb(242,54,69,50), border_width=1,
bgcolor = supply_color, extend = extend_option, text = strength_text, text_halign = text.align_right, text_valign = text.align_center, text_color = color.white, text_size = size.small, xloc = xloc.bar_index))
box.delete( array.get(label_array, array.size(label_array) - 5) )
f_array_add_pop(label_array, box.new( left = box_left, top = poi, right = box_right, bottom = poi, border_color = color.rgb(242,54,69,50), border_width=1, border_style=line.style_dotted,
bgcolor = color.new(color.black,100), extend = extend_option, text = '', text_halign = text.align_left, text_valign = text.align_center, text_color = color.white, text_size = size.small, xloc = xloc.bar_index))
else if box_type == -1 and okay_to_draw and s1
box.delete( array.get(box_array, array.size(box_array) - 5) )
f_array_add_pop(box_array, box.new( left = box_left, top = box_top, right = box_right, bottom = box_bottom, border_color = color.rgb(0,188,212,50), border_width=1,
bgcolor = demand_color, extend = extend_option, text = strength_text, text_halign = text.align_right, text_valign = text.align_center, text_color = color.white, text_size = size.small, xloc = xloc.bar_index))
box.delete( array.get(label_array, array.size(label_array) - 5) )
f_array_add_pop(label_array, box.new( left = box_left, top = poi, right = box_right, bottom = poi, border_color = color.rgb(0,188,212,50), border_width=1, border_style=line.style_dotted,
bgcolor = color.new(color.black,100), extend = extend_option, text = '', text_halign = text.align_left, text_valign = text.align_center, text_color = color.white, text_size = size.small, xloc = xloc.bar_index))
f_sd_to_bos(box_array, bos_array, label_array, zone_type) =>
if zone_type == 1
for i = 0 to array.size(box_array) - 1
level_to_break = box.get_top(array.get(box_array,i))
if close >= level_to_break
box.delete(array.get(box_array, i))
box.delete(array.get(label_array, i))
if zone_type == -1
for i = 0 to array.size(box_array) - 1
level_to_break = box.get_bottom(array.get(box_array,i))
if close <= level_to_break
box.delete(array.get(box_array, i))
box.delete(array.get(label_array, i))
f_extend_box_endpoint(box_array) =>
for i = 0 to array.size(box_array) - 1
box.set_right(array.get(box_array, i), bar_index + 30) // Extend only 20 bars
atr567 = ta.atr(50)
swing_high = ta.pivothigh(high, swing_length, swing_length)
swing_low = ta.pivotlow(low, swing_length, swing_length)
var swing_high_values = array.new_float(5,0.00)
var swing_low_values = array.new_float(5,0.00)
var swing_high_bns = array.new_int(5,0)
var swing_low_bns = array.new_int(5,0)
var current_supply_poi = array.new_box(history_of_demand_to_keep, na)
var current_demand_poi = array.new_box(history_of_demand_to_keep, na)
var supply_bos = array.new_box(5, na)
var demand_bos = array.new_box(5, na)
if not na(swing_high)
f_array_add_pop(swing_high_values, swing_high)
f_array_add_pop(swing_high_bns, bar_index )
if show_price_action_labels
f_sh_sl_labels(swing_high_values, 1)
f_supply_demand(swing_high_values, swing_high_bns, current_supply_box, current_supply_poi, 1, atr567)
else if not na(swing_low)
f_array_add_pop(swing_low_values, swing_low)
f_array_add_pop(swing_low_bns, bar_index )
if show_price_action_labels
f_sh_sl_labels(swing_low_values, -1)
f_supply_demand(swing_low_values, swing_low_bns, current_demand_box, current_demand_poi, -1, atr567)
f_sd_to_bos(current_supply_box, supply_bos, current_supply_poi, 1)
f_sd_to_bos(current_demand_box, demand_bos, current_demand_poi, -1)
f_extend_box_endpoint(current_supply_box)
f_extend_box_endpoint(current_demand_box)
// Inside the main execution, after the box is drawn, check for rejections
if not na(swing_low)
f_array_add_pop(swing_low_values, swing_low)
f_array_add_pop(swing_low_bns, bar_index )
if show_price_action_labels
f_sh_sl_labels(swing_low_values, -1)
f_supply_demand(swing_low_values, swing_low_bns, current_demand_box, current_demand_poi, -1, atr567)
f_check_demand_rejections()
if not na(swing_high)
f_array_add_pop(swing_high_values, swing_high)
f_array_add_pop(swing_high_bns, bar_index )
if show_price_action_labels
f_sh_sl_labels(swing_high_values, 1)
f_supply_demand(swing_high_values, swing_high_bns, current_supply_box, current_supply_poi, 1, atr567)
f_check_supply_rejections()
trigger2 = bull ? 1 : 0
countBull = ta.barssince(bull)
countBear = ta.barssince(bear)
trigger = nz(countBull, bar_index) < nz(countBear, bar_index) ? 1 : 0
atrBand = ta.atr(atrLen) * atrRisk
atrStop = trigger == 1 ? low - atrBand : high + atrBand
lastTrade(close) => ta.valuewhen(bull or bear , close, 0)
entry = levels ? label.new(time, close, "ENTRY " + str.tostring(lastTrade(close), decimals), xloc.bar_time, yloc.price, #00e2ff, label.style_label_left, color.white, size.normal) : na
label.set_x(entry, label.get_x(entry) + math.round(ta.change(time) * lvlDistance))
label.set_y(entry, lastTrade(close))
label.delete(entry )
stop_y = lastTrade(atrStop)
stop = levels ? label.new(time, close, "SL " + str.tostring(stop_y, decimals), xloc.bar_time, yloc.price, red2, label.style_label_left, color.white, size.normal) : na
label.set_x(stop, label.get_x(stop) + math.round(ta.change(time) * lvlDistance))
label.set_y(stop, stop_y)
label.delete(stop )
tp1Rl_y = (lastTrade(close)-lastTrade(atrStop))*1 + lastTrade(close)
tp1Rl = levels ? label.new(time, close, "1:1 TP " + str.tostring(tp1Rl_y, decimals), xloc.bar_time, yloc.price, green2, label.style_label_left, color.white, size.normal ) : na
label.set_x(tp1Rl, label.get_x(tp1Rl) + math.round(ta.change(time) * lvlDistance))
label.set_y(tp1Rl, tp1Rl_y)
label.delete(tp1Rl )
tp2RL_y = (lastTrade(close)-lastTrade(atrStop))*2 + lastTrade(close)
tp2RL = levels ? label.new(time, close, "2:1 TP " + str.tostring(tp2RL_y, decimals), xloc.bar_time, yloc.price, green2, label.style_label_left, color.white, size.normal) : na
label.set_x(tp2RL, label.get_x(tp2RL) + math.round(ta.change(time) * lvlDistance))
label.set_y(tp2RL, tp2RL_y)
label.delete(tp2RL )
tp3RL_y = (lastTrade(close)-lastTrade(atrStop))*3 + lastTrade(close)
tp3RL = levels ? label.new(time, close, "3:1 TP " + str.tostring(tp3RL_y, decimals), xloc.bar_time, yloc.price, green2, label.style_label_left, color.white, size.normal) : na
label.set_x(tp3RL, label.get_x(tp3RL) + math.round(ta.change(time) * lvlDistance))
label.set_y(tp3RL, tp3RL_y)
label.delete(tp3RL )
style = linesStyle == "SOLID" ? line.style_solid : linesStyle == "DASHED" ? line.style_dashed : line.style_dotted
lineEntry = levels and lvlLines ? line.new(bar_index - (trigger == 0 ? countBull : countBear), lastTrade(close), bar_index + lvlDistance, lastTrade(close), xloc.bar_index, extend.none, #00e2ff, style, 2) : na, line.delete(lineEntry )
lineStop = levels and lvlLines ? line.new(bar_index - (trigger == 0 ? countBull : countBear), stop_y, bar_index + lvlDistance, stop_y, xloc.bar_index, extend.none, #fe0100, style, 2) : na, line.delete(lineStop )
lineTp1Rl = levels and lvlLines ? line.new(bar_index - (trigger == 0 ? countBull : countBear), tp1Rl_y, bar_index + lvlDistance, tp1Rl_y, xloc.bar_index, extend.none, green2, style, 2) : na, line.delete(lineTp1Rl )
lineTp2RL = levels and lvlLines ? line.new(bar_index - (trigger == 0 ? countBull : countBear), tp2RL_y, bar_index + lvlDistance, tp2RL_y, xloc.bar_index, extend.none, green2, style, 2) : na, line.delete(lineTp2RL )
lineTp3RL = levels and lvlLines ? line.new(bar_index - (trigger == 0 ? countBull : countBear), tp3RL_y, bar_index + lvlDistance, tp3RL_y, xloc.bar_index, extend.none, green2, style, 2) : na, line.delete(lineTp3RL )
alertcondition(bull, title='Buy Signal', message = "BUY")
alertcondition(bear, title='Buy Signal', message = "BUY")
//import protradingart/pta_plot/6 as pp
//pp.peakprofit(bull, bear)
 شراء
شراء
L

 شراء
شراء
 بيع
بيع بيع
بيع

 شراء
شراء