Short
Short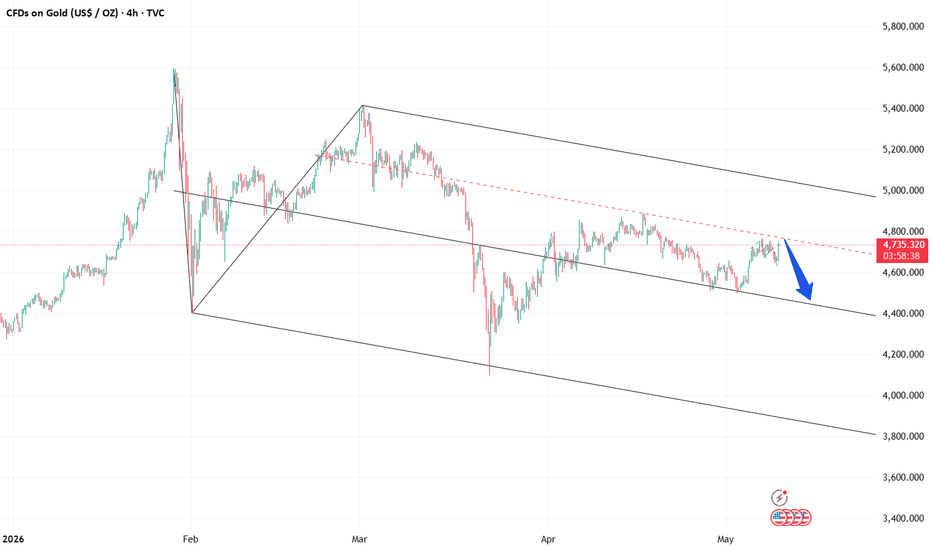
 Short
Short
 Short
Short
Where Andrews Meets GannThe Premise
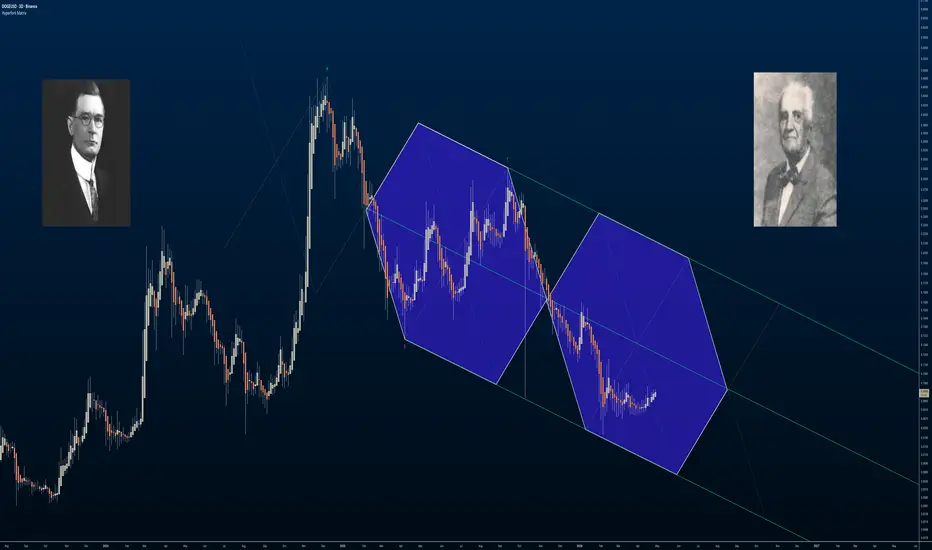
Two lineages, one geometry. Andrews' median line work and Gann's geometric price-time charts converge in the Hyperfork.
Dr. Alan Andrews' Action-Reaction method — Newton's third law applied to price, which Andrews learned from Roger Babson — uses three pivots to draw a median line with action and reaction parallels framing the trend's channel.
W.D. Gann worked with price-time charts and geometrically scaled charts — the Square of Nine and the Hexagon Chart, etc., which, in my understanding, aim to model the expansion and contraction of price and time.
I had never seen the two come together until I built the Hyperfork.
The Discovery
The Hyperfork extends Andrews/Mikula's Superpitchfork — multiple action-reaction lines layered over the same three pivots. When those lines surface, a two-dimensional hexagon emerges within the Hyperfork. Viewed differently, the same hexagon reads as a cube.
That was the moment. The hexagon-as-cube is the connection — the first time I saw Andrews' median geometry and hexagonal geometry coexist on the same chart.
The Research Direction
If the cube is the unit, the next question is what fills it.
Each cube cell can contain 13 reference points: 1 center, 6 on the outer ring at the cell tips, and 6 on the inner ring forming a nested hexagon at half scale. Connect every pair of nodes, and the figure becomes part of my attempt to produce a Metatron's Cube — a network of nodes and chord relations.
Where Andrews anchors a single median per fork, the lattice surfaces every pairwise chord between every node — a more complete relational map of the same three pivots.
What I'm Exploring
Whether price interacts meaningfully with the lattice and its nodes. Whether the outer ring marks macro pivot candidates. Whether the inner hexagon contains a higher-density confluence zone. Whether the chord crossings function as time-price reference points.
The main question I want to answer is: Does Andrews' 80% rule apply throughout other parts of the lattice? If price tends to return to the parent median about 80% of the time, does this statistical property hold at every cube cell — including each local median axis, nested hexagon, and chord intersection?
Open questions, not claims. This is a research direction, not a method.
Open questions, not claims. This is a research direction, not a method.
Setup
For reproducibility on the chart shown:
Pitchfork type: Modified Schiff
Price scale: Logarithmic
Three pivots picked from major swing points. Everything else is default.
Reference & Lineage
Built on the open-source Hyperfork Matrix . The 13-node Metatron lattice is a research-stage extension; this idea timestamps the direction.
Lineage: Babson → Andrews/Schiff → Mikula → here. Patrick Mikula's The Best Trendline Methods of Alan Andrews and Five New Trendline Techniques extended Andrews' framework and is the direct foundation for this research  Education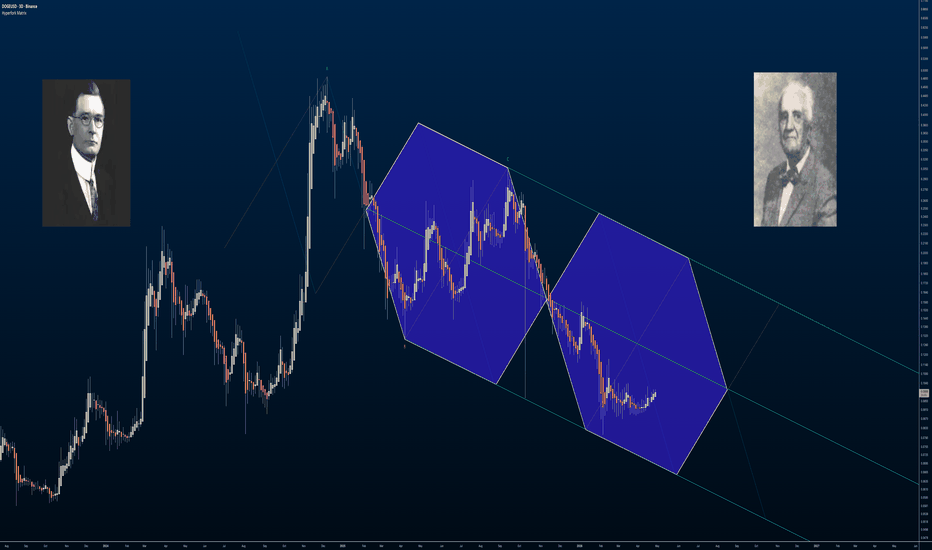
Forecast: DAX Revisiting 2009 LevelsI know this is a depressing suggestion — that equities could lose 70% or more of their current value. If you entered the market after the 2008 crisis, you have only known 17 years of growth. I do not blame you if this idea sounds unthinkable and I hope that I am wrong, but I think this setup is technically credible. It matches the mechanics I have seen across different markets and timeframes. For reference, see my similar idea "Later, Bitcoin!", which played out exactly as expected.
Technicals
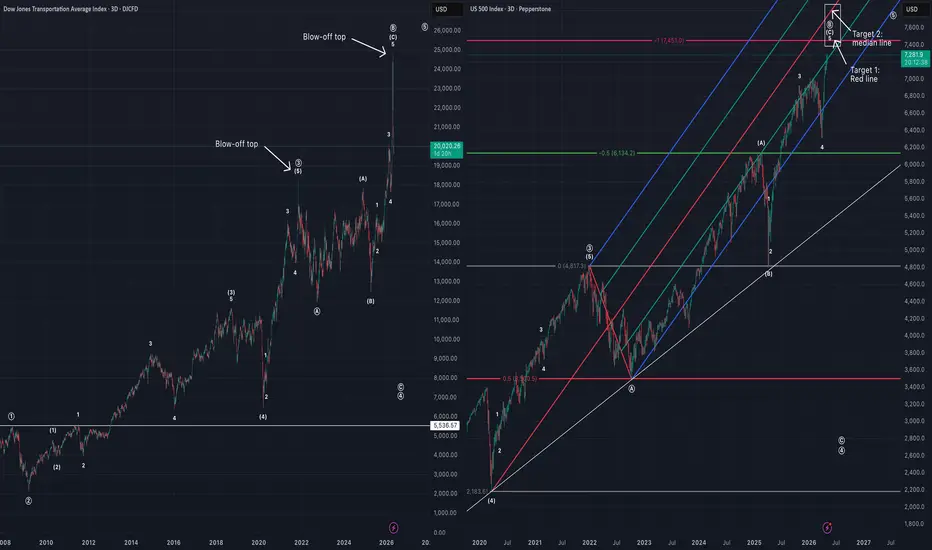
The overall trend is still bullish, but because the 2020 pullback failed to fully reset the market, it has advanced in what I consider an unsustainable way. That has created a divergence between price and momentum, visible in RSI. From a pitchfork perspective, price tends to gravitate toward the next median line, where it can stall, break through, or reverse. The DAX has already hesitated around the middle line several times, and with the trend barrier now broken, I think a reversal may begin once we bid farewell to the nearby supply zone.
Once the decline starts, I expect price to at least reach the dotted line of the crosswind channel through what I call a nostalgia retracement — a return to old, broken, downsloping structures that often occurs before the trend resumes. In my experience, where horizontal support intersects with downsloping structures often becomes an attraction point for price. On the linear chart, I see the next meaningful support around 3,800.
Macro backdrop
The global fiat system, built on debt expansion and growing liquidity, can support rising asset prices for a long time — but that does not mean bubbles cannot burst. Germany has already been losing momentum, and the country’s 2026 growth forecast was just cut to 0.5% while inflation expectations were revised higher as rising energy costs weigh on the economy. That matters for the DAX because Germany remains highly exposed to industrial and energy-sensitive sectors.
Now add the war involving the U.S., Israel, and Iran. Major forecasters including the IEA have warned that the conflict has already disrupted oil supply, driven up energy prices, and worsened the global growth outlook. In that kind of environment, stagflation risk rises and both households and investors are forced to prioritize essentials like fuel and food over risk assets.
As for timing, the yield curve adds another warning signal. Historically, inversions have often preceded recessions, and normalization after inversion has frequently happened close to the downturn rather than far ahead of it. I do not treat that as a fixed rule, but in the current backdrop it adds to the view that the macro picture is fragile rather than supportive.
 Short
Short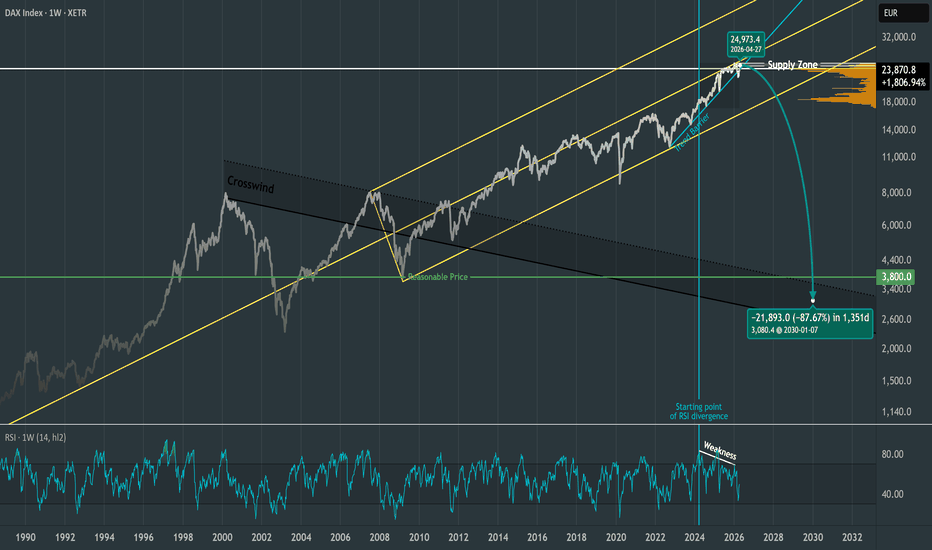
 Long
Long
 Long
Long
Long 
Gold projection up to 5800The fundamentals:
First, the US economy is currently in a phase called Stagflation. This means the economy is growing very slowly (only 1.4 percent), but prices for everything are still going up (over 3 percent inflation). Gold is the classic "insurance policy" for this exact situation, so investors are flocking to it.
Second, the old rule that a strong US Dollar kills Gold is breaking. Even though the Dollar is still strong, Gold prices are staying high. This shows that people are more worried about protecting their wealth than they are about what currency is doing.
Third, there is a massive "floor" under the price because of buyers in China and India. Regular people there are buying physical gold at record rates, even paying extra fees just to own it. Every time the price of Gold drops a little, these buyers jump in and push it back up.
Finally, Central Banks around the world are still buying huge amounts of Gold to move away from the US Dollar. They are essentially acting as a giant safety net for the market.
Fundamentals Summary:
Expect a "buy-the-dip" market. If Gold prices drop briefly, big buyers will likely step in quickly to push them back up. The general trend looks positive.
The Chart:
Price had a lot of trouble climbing above the Centerline.
Finally it was cracked and the following Candle-Lows whre bought by the big Whales in the market.
If todays Candle is closing positive, maybe even above the high of yeterday, I'm very positive that pirce will not fall again below the CL in the coming weeks.
If you liked this post, feel free to give it a boost. Thanks for the support.
Long 
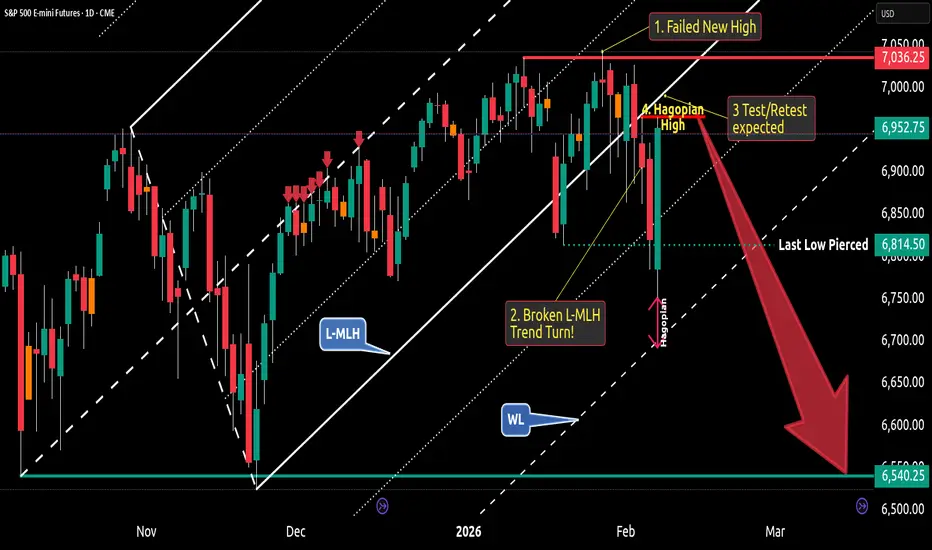
S&P500 Bearish Trend Turn - Here's My Short Trade🔱 As long as price follow the projection of a pitchfork, the trend is OK. But what we see here is a turn - and here's why:
1. The market failed to close above the last high. So, this is a failed new high - or a Double-Top
It is confirmed because the last low is pierced by the last Fridays bar.
2. Price opened & closed below the Lower-Medianline-Parallel = The projection of the fork, which shows the temporary trend, is clearly broken. And this means: Temporary Trend Turn.
3. What we see now with last Fridays bar is a expected Test/Retest of the L-MLH. It's also a slap in the face of early Bears.
4. And if you dig really deep, you also see the Hagopian against the Warning-Line (WL), which confirms the thesis of the Test/Retest of the L-MLH. Because Hagopian says, that price will go farther in the opposite direction than from where price came. In clear words: Price will go higher than the "Hagopian High". And to be precise, I expect the S&P500 to test the L-MLH.
So, week Short hands are completely clueless now. How can it be that price pulls back so hard...?
Thank God I'm trading with the pitchfork. They give me clear rules. And I never have to doubt, because there is zero subjectivity involved.
Can price go higher than the last high at 1. ?
Sure, everything is possible. But - It's not likely to happen, my Pitchfork rules say.
My trade?
I will observe price-action at the L-MLH.
As soon as the markets show it's hand by clear weakness, I'm loading my Boat to the Short side.
My exit? If a full bar is closing above the last high at 1.
There you have it.
👉 FYI: I'm NOT a signal service. I provide educational content. If you want to learn more about trading with the Pitchforks/Medianlines, I'm here for you to help. And of course you can always check out all my links where you find helpful, educational material.
I hope this helps and I wish you all a great and profitable new week.  Short
Short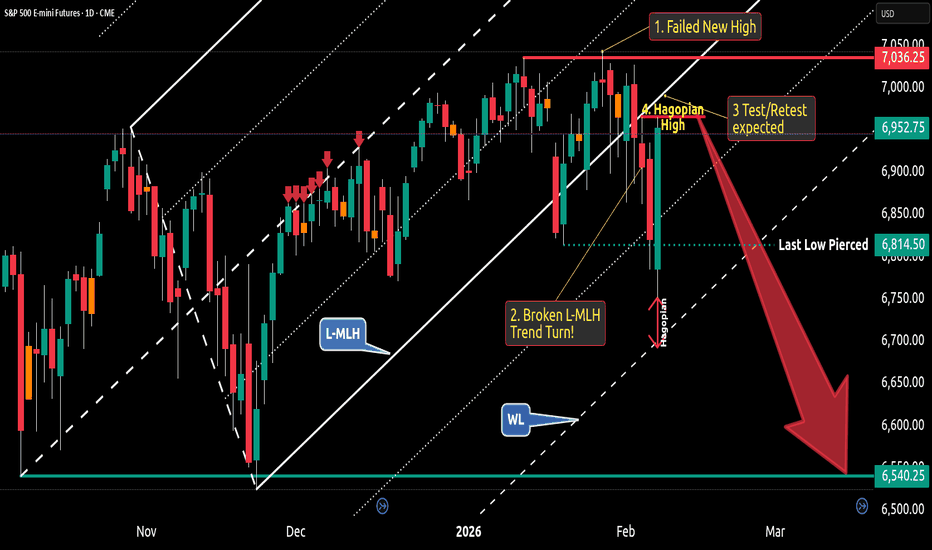
Long 
Long 
 Long
Long
Long 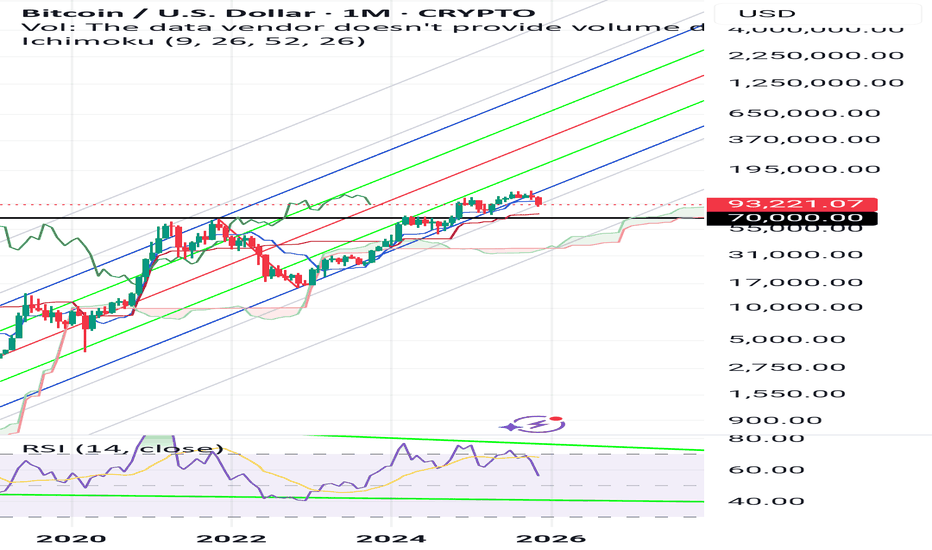
Short 
Long 
Long 
Long 
Long