ETHUSDT 4H: ending diagonal breakout and retest, wave 5 nextETH's wave 4 ended in a falling wedge. Price broke out of it, retested it, and has pushed higher. Here is what has to hold for wave 5.
The bigger picture
My read: wave 4 has been retracing wave 3, and the c leg of wave 4 formed an ending diagonal. An ending diagonal is a wedge where price makes lower highs and lower lows inside two lines that point toward each other. It often marks the end of a move, and price usually breaks out of it. Wave 5 comes next, and I expect it to extend, meaning it ru
Ending Diagonal
Silver 4H | A Classic Zigzag Takes ShapeReading time: ~3 minutes
Silver’s current 4H structure is increasingly consistent with the possibility of a Classic Zigzag completing the larger Wave IV. What makes this count particularly interesting is the combination of a potential five-wave structure in Wave A, a textbook corrective formation in Wave B, and a possible Ending Diagonal within Wave C.
Wave A | A Potential Impulse
The initial decline from the peak can be interpreted as a five-wave Impulse. This provides a structural basis for
Gold 4H | The Final Diagonal or One More Leg Down?Reading time: ~3 minutes
The current 4H structure offers two interpretations of Gold’s ongoing decline. Although the wave labeling differs between the two cases, both focus on the development of the larger corrective structure and the possibility that Wave IV has not yet completed.
Bullish Case | A Potential Ending Diagonal
In the current bullish interpretation, Wave A is counted as an Impulse, while the extended structure of Wave C may be developing as an Ending Diagonal.
Within this interp
LINKUSDT 2H: Creek break, retest and sweep of prior lowsLINK broke above its downtrend line, came back to test it, and swept the prior lows. I'm watching the 2H to confirm that the test is over.
The bigger picture
The fall into the 19 Oct low formed an ending diagonal, a wedge shape that often marks the end of a move. Price then broke above the Creek, the downtrend line that capped the fall. Since the break, price has come back to test that line from above.
What just happened
Price rose to a high on 22 Oct, then fell back to the Creek and the Prior
Copper Ending Diagonal Suggests Upside May Be LimitedCopper has recently reached new highs, but one of the wave counts we are tracking suggests that the upside could become limited. We are observing a potential ending diagonal, which is a pattern that typically shows that bulls are still in control, but are gradually losing strength. This is also reflected by the increasing number of overlaps since the beginning of this year.
You can clearly see the difference between the strong and steep advance from the August 2025 lows into the January 2026 hi
S&P 500 Finds Support At Key Zone As Wave 5 Could Followhe S&P 500 has once again returned to the 7,500–7,600 area, which we previously highlighted as an important technical zone. This region is particularly interesting because it lines up with the previous swing highs from June and July, meaning that former resistance can now potentially act as support during the current correction.
From an Elliott Wave perspective, the decline from the recent highs still appears corrective, as we can so far count only three waves lower. This leaves the possibility
Coca-Cola Faces Wave 4 Pullback Before Next Leg HigherCoca-Cola is making a strong breakout to the upside following its latest earnings report. Apparently, the rally from the previous wave B consolidation, which we labeled as a potential triangle, is extending higher. However, because of the previous overlapping price action, there is still a chance that this advance is forming an ending diagonal. We also know that earnings gaps often get filled, so despite the recent strong rally, seems like it's now slowing down within a new wave 4 pullback. That
Trading Roadmap | Wave Analysis · Lesson 10 — DiagonalsLesson 10 - Leading and Ending Diagonals
Difficulty: (Advanced)
There is one structure in the whole framework that is allowed to break a rule you have been treating as absolute since Lesson 4. It looks like a wedge, it overlaps where an impulse never should, and it shows up in exactly two places in a sequence. Reading it correctly is often the difference between calling a trend early and calling a top late.
Five legs squeezed between two converging lines, each push covering less gro
AAPL 4H — Nested Structure or Final Diagonal?🍎 AAPL 4H — Nested Structure or Final Diagonal?
In this update, the main focus is on the current price structure and what the market needs to show to confirm the wave count.
The aggressive scenario is currently focused on a nested structure across two degrees:
1-2 / 1-2
In this interpretation, the current decline could be a three-wave corrective structure. If this decline completes in three waves and price then begins to advance again, that behavior could provide important confirmation of th
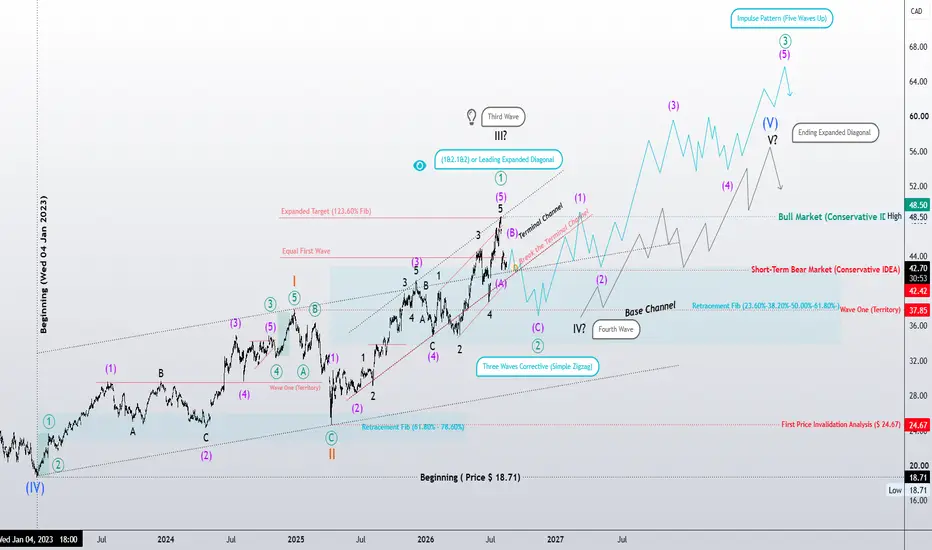
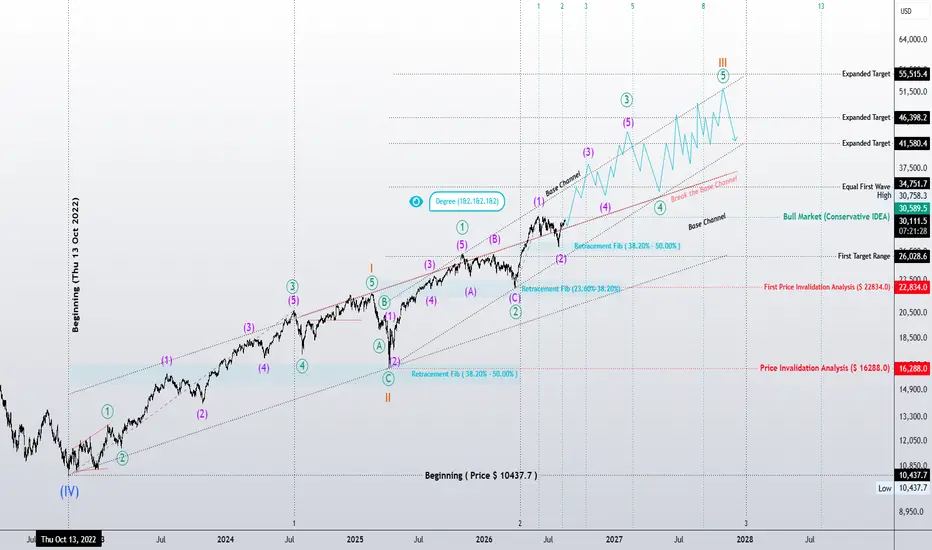
NASDAQ: The Wave Structure Is TalkingOn the larger degree, NASDAQ is still developing within a large impulsive structure, and what matters most right now is the Third Wave still unfolding. It has not yet reached a point where we can reasonably declare it complete simply based on wave proportions.
The daily chart tells a similar story on a lower degree. After Wave II, the market has continued developing impulsive structures, and more recently we can see several nested 1–2 structures. If this count remains valid, these nested struct
Bitcoin Coils Inside a Triangle — Is a Major Breakout Coming?Bitcoin ( BINANCE:BTCUSDT ) is currently trading near the Support Lines while forming a Symmetrical Triangle close to the upper trendline of the Descending Channel.
Over the weekend, price action has remained compressed, suggesting that a larger directional move could be approaching.
Can Bitcoin hold the Support Lines and break above the Descending Channel?
Technical Analysis
From an Elliott Wave perspective, Bitcoin also appears to be forming a Contracting Triangle, which could complete Wav
RBOB Gasoline | Wave II… or Something More?In this count, the initial motive structure is interpreted as a Classic Impulse, with Wave 5 completing as an Ending Diagonal after the sharp acceleration of Wave 4, ultimately reaching the peak at the beginning of 2026. From there, the market entered a corrective decline, and price is now approaching a critical structural area.
To complete a full eight-wave cycle, the internal structure of the correction becomes particularly important. In the current count, Wave A developed as an impulse, foll
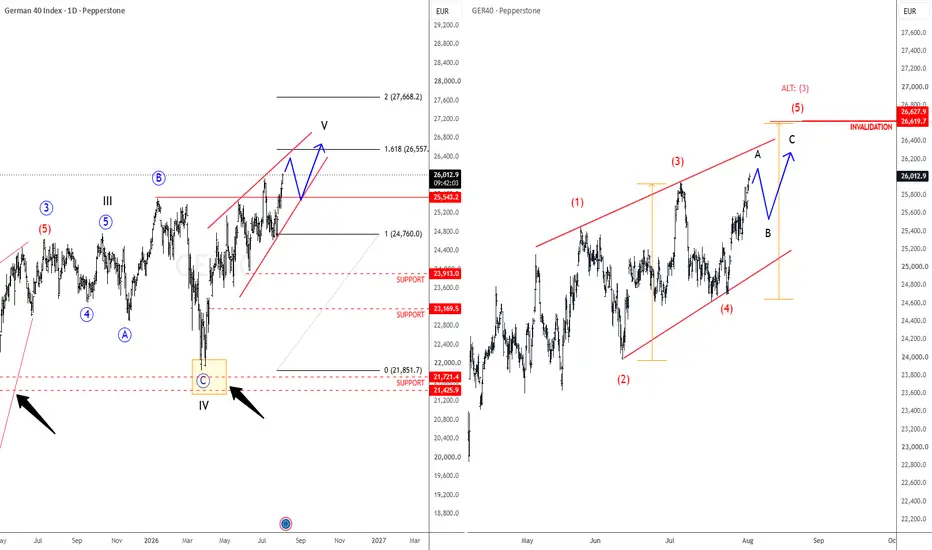
DAX Pushes Toward New Highs, But Wedge Pattern Can Limit UpsideThe German DAX continues to push higher and is now challenging the previous highs. While the current choppy recovery suggests that the upside move may not be finished yet, traders should remain cautious as the potential upside could be limited.
Looking at the latest price action, the structure increasingly resembles an ending diagonal a.k.a. wedge pattern. In this scenario, DAX would now be trading within the final wave five of this wedge formation, meaning that the remaining upside could be pa
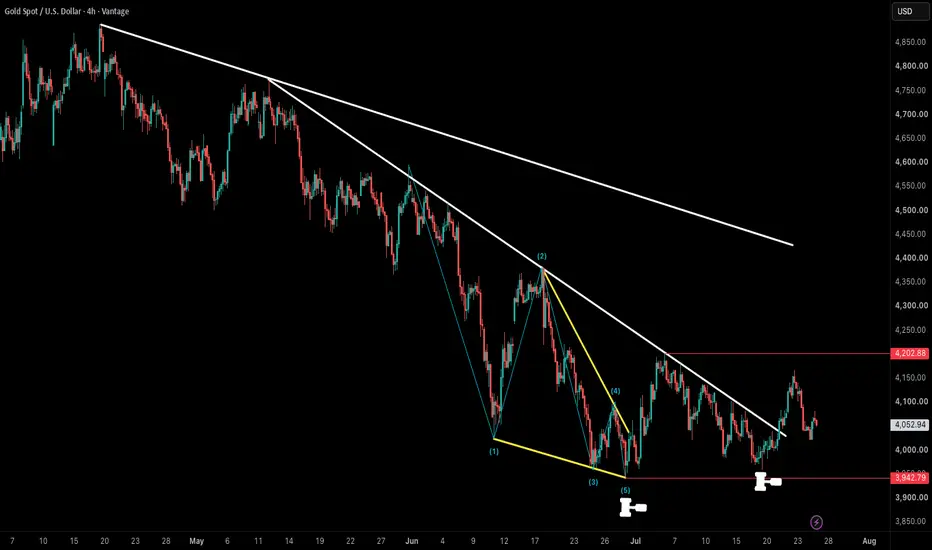
ending diagonal vs fed rate pausegold still under selling pressure below 4200 ahead of fomc week
despite recent two cool inflation report fed warsh said this is not mission acomlished and trump iran war, tariff both continue
but price first made elliott wave ending diagonal near 4k area then retest that low again
4200 most important level to confirm this breakout or just correction in bear market
trendline also breakout last week but gold immediately fall back to trend line
S&P 500 at Potential Reversal Zone—Is a Bigger Correction Next?The S&P 500 ( FOREXCOM:SPX500 ) reacted strongly to the recent support zone($7,463-$7,430) and Support Lines, which led to another bullish move. However, the index is currently trading near the key trading level of $7,500 and the Potential Reversal Zone (PRZ) .
From an Elliott Wave perspective, Wave C appears to have been completed through an Ending Diagonal pattern. The lower trendline of this pattern has already been broken, and the S&P 500 is currently pulling back to retest it.
I expect t
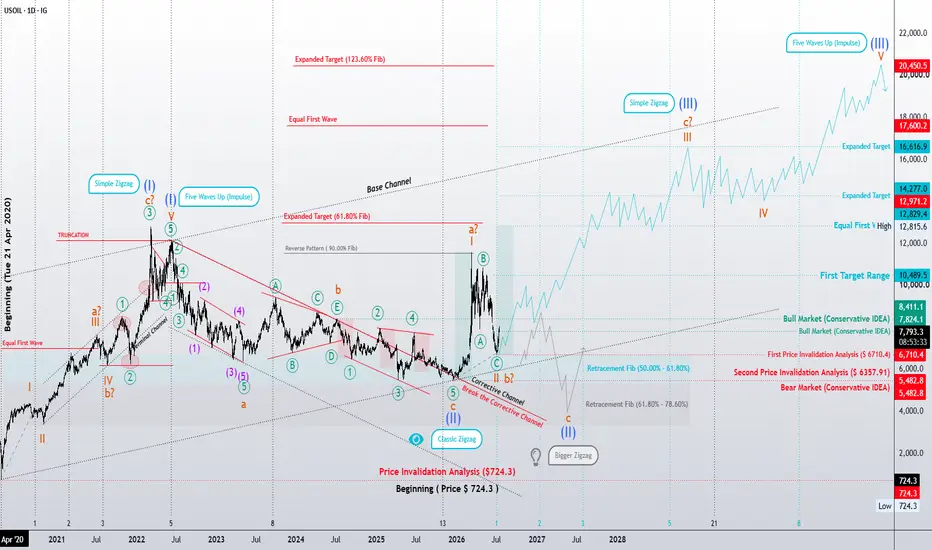
Impulse, Diagonal, or a Larger Correction?Crude Oil (USOIL)Crude Oil (USOIL) – 4H Elliott Wave Update
Impulse, Diagonal, or a Larger Correction?
The recent decline may have completed either Wave II of a developing bullish cycle or Wave b within a larger corrective structure. At this stage, both interpretations remain valid, and the market has not yet provided enough structural evidence to confirm either scenario.
If the bullish count is correct, the next advance could unfold in more than one form.
The most straightforward scenario is a classic five-w
Reading the Character of the Next Market CycleCrude Oil: Impulse or Diagonal? Reading the Character of the Next Market Cycle
In my previous long-term analysis, the primary expectation was that crude oil was developing the final fifth wave of the largest degree as a classic Impulse. If that interpretation proves correct, the long-term bullish outlook remains valid and significantly higher price objectives could still become achievable over the coming years.
However, as the market structure continues to evolve, another equally valid Elliott
Ripple(XRP) Approaches Key Support as Reversal Pattern EmergesXRP is finally moving lower and is slowly approaching the key $1 support area, which previously acted as a major breakout level nearly two years ago. This makes the $1 zone the first important support area to watch for a potential reaction.
On the 4H timeframe, XRP is approaching another critical level around $0.95. The positive aspect is that a potential ending diagonal structure is forming, which is often seen as a reversal pattern and could signal that selling pressure is starting to mature.
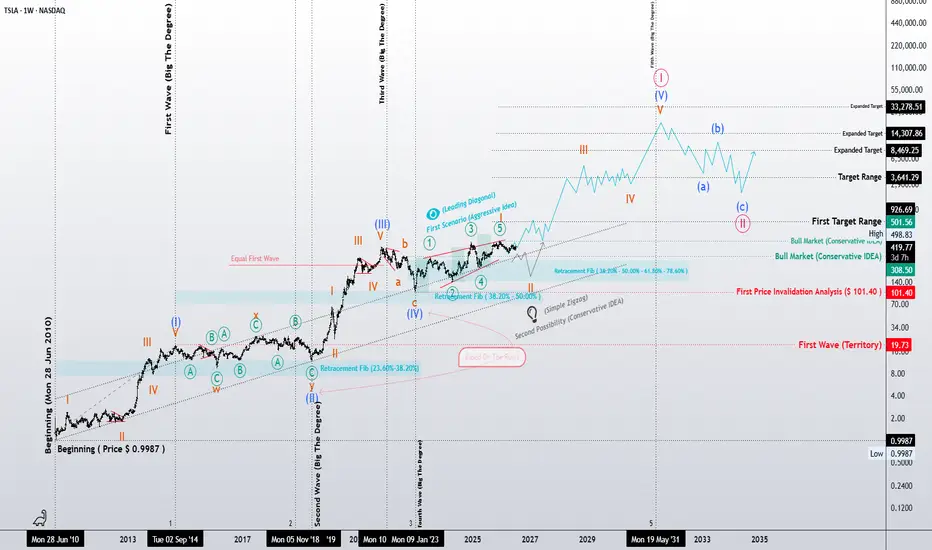
TSLA: A Structural Blueprint of the Grand Cycle
"Price is the consequence. Structure is the cause."
This analysis is not a simple price forecast. Rather, it is a structural study of Tesla's position within its Grand Cycle through the principles and guidelines of Elliott Wave Theory.
Since its 2010 low, Tesla has developed a sequence of impulsive and corrective waves, each forming part of a much larger market geometry. The objective of this study is to identify the market's current position within that hierarchy and explore the most probabl
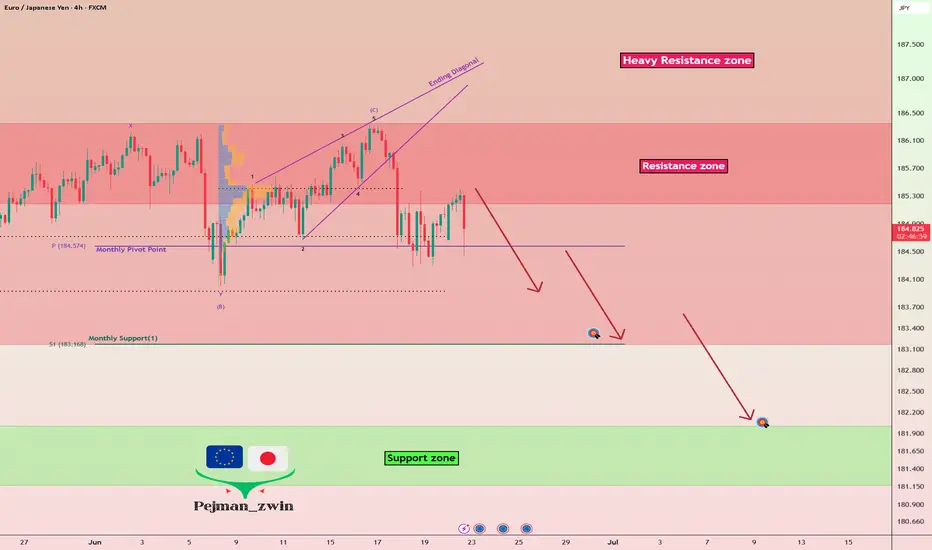
EURJPY Near Heavy Resistance — Is a Reversal Starting?EURJPY ( OANDA:EURJPY ) is currently moving within a heavy resistance zone(188.22 JPY-183.17 JPY), near the resistance zone(186.35 JPY-185.19 JPY)inside this key zone.
From an Elliott Wave perspective, it seems that an upward corrective zigzag(ABC/5-3-5) has completed, where wave C formed an ending diagonal.
I expect EURJPY to start declining from the resistance zone(186.35 JPY-185.19 JPY) and drop at least toward 183.43 JPY.
First Target: 183.43 JPY
Second Target: 182.35 JPY
Stop Loss(SL):
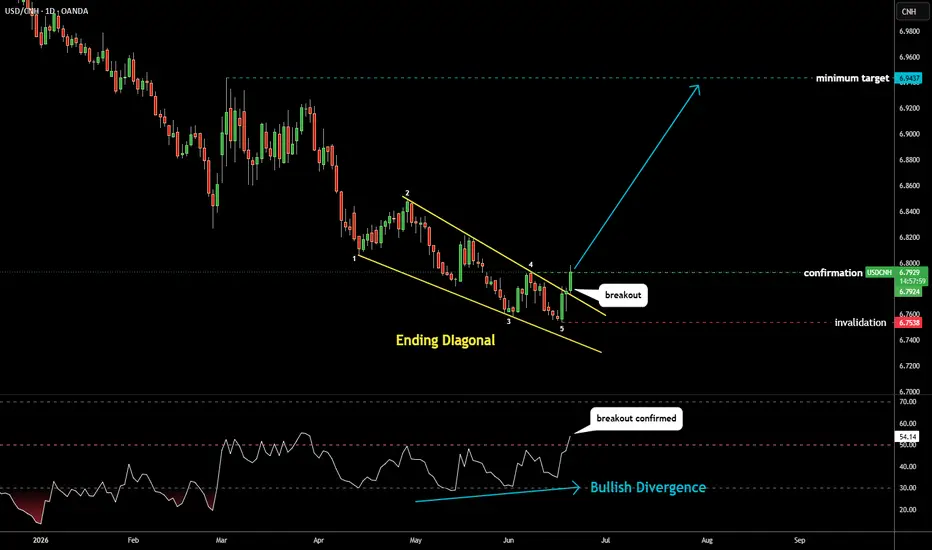
USDCNH: My Favorite Pattern Plays outAt the beginning of the month I posted my favorite pattern Ending Diagonal
that was in the making on USDCNH chart
Now it plays out as the price triggered the confirmation level
as well as the Bullish Divergence on RSI chart that supported the breakout
moving above the 50 "waterline"
6.9437 is the minimum target where this Ending Diagonal started
6.7538 is the invalidation level where this pattern bottomed
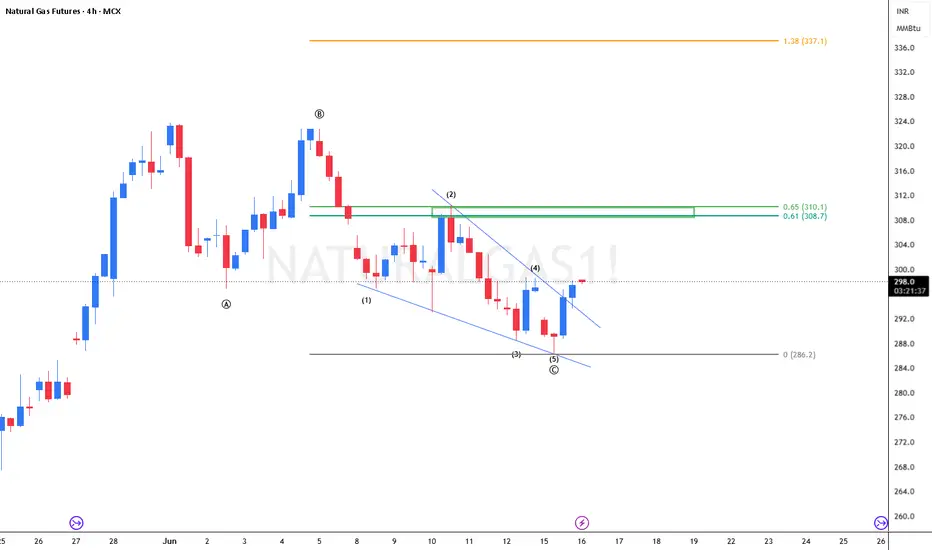
NaturalGas Natural Gas – ABC Correction Complete, C Wave Ending Diagonal Breakout
The ABC corrective structure appears to be complete, with Wave C forming an Ending Diagonal pattern. Price has now successfully broken out above the diagonal resistance, confirming bullish strength and increasing the probability of a trend reversal.
As long as the breakout remains valid, we can look for further upside momentum, with the next major target projected around 303.
Amazon: Bullish Wave Structure Structure Targets 280–300Amazon is showing renewed bullish momentum after moving higher from the lower side of its broader trading range and successfully breaking above the upper boundary near the 230 level. This breakout represents a decisive technical development, signaling the end of the prior corrective channel and reinforcing the bullish outlook supported by the company’s latest earnings results.
From an Elliott Wave perspective, the stock appears to be unfolding in a strong five-wave impulse structure, currently