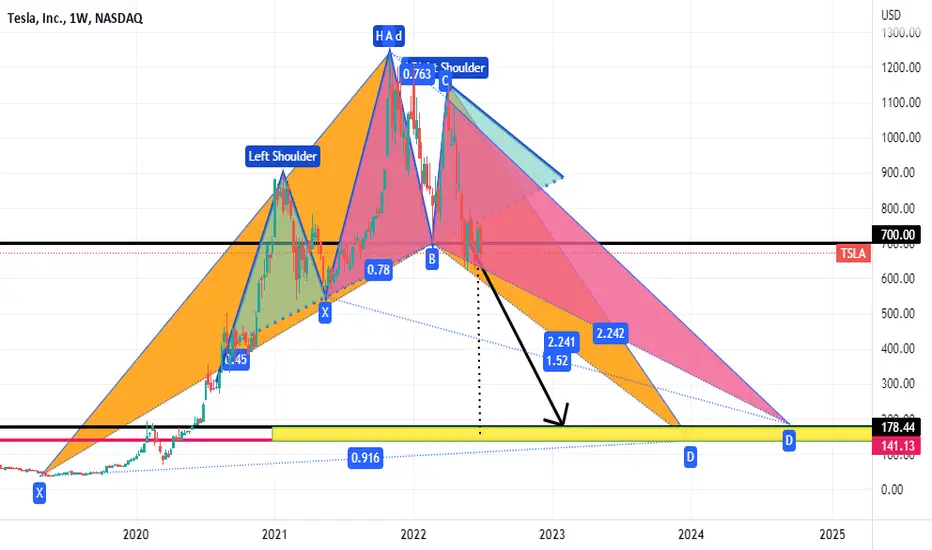
Copper Bearish Crab Pattern
In 2024, copper prices have exhibited notable fluctuations, driven by macroeconomic trends, industrial demand, and supply constraints.
Key Fibonacci retracement levels have played a crucial role in shaping market movements. With the 0% level at $3.96, the 23.6% retracement at $4.11 acted as an initial support, while the 38.2% level at $4.225 provided stronger stability.
The 50% retracement at $4.28 served as a key equilibrium zone, with the 61.8% level at $4.361 marking a critical support for potential reversals.
According to the harmonic Crab pattern , the 161.8% Fibonacci extension near $5.00 is expected to act as a major resistance. If the price reaches this level, a sharp bearish reversal is likely due to overbought conditions. A rejection at this resistance could drive prices down toward the support zones, completing the harmonic correction phase.
However, a breakout above $5.00 could invalidate this scenario and lead to further bullish momentum.
If you like this trading idea and want to stay updated with the next one, please give it a thumbs up and follow along! Your support means a lot, and I’m excited to share more insights with you. Let’s embark on this journey together!
SEYED.  Short
Short
X
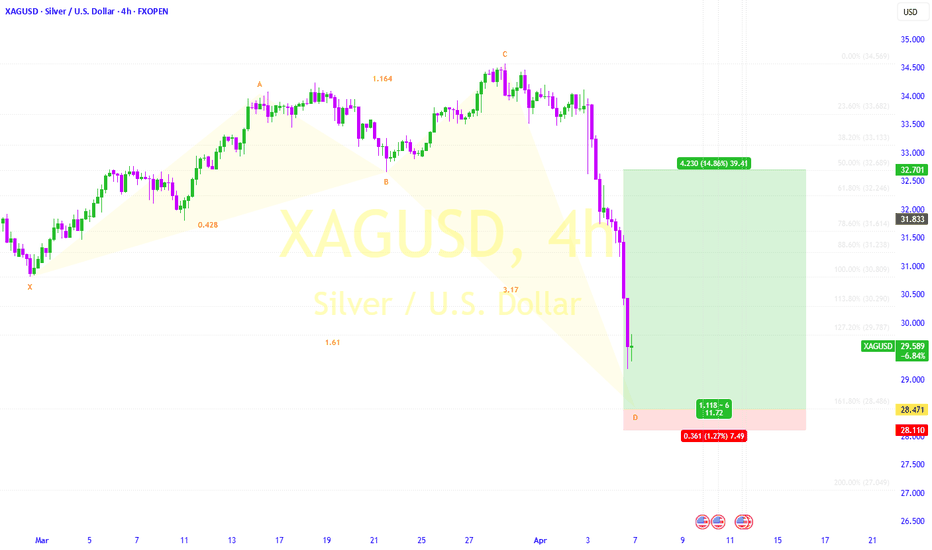
F
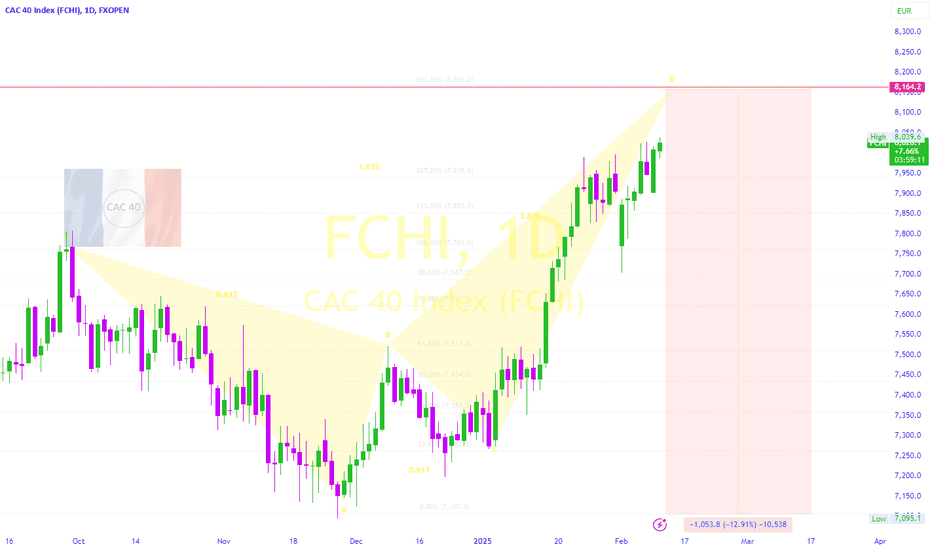
 Short
Short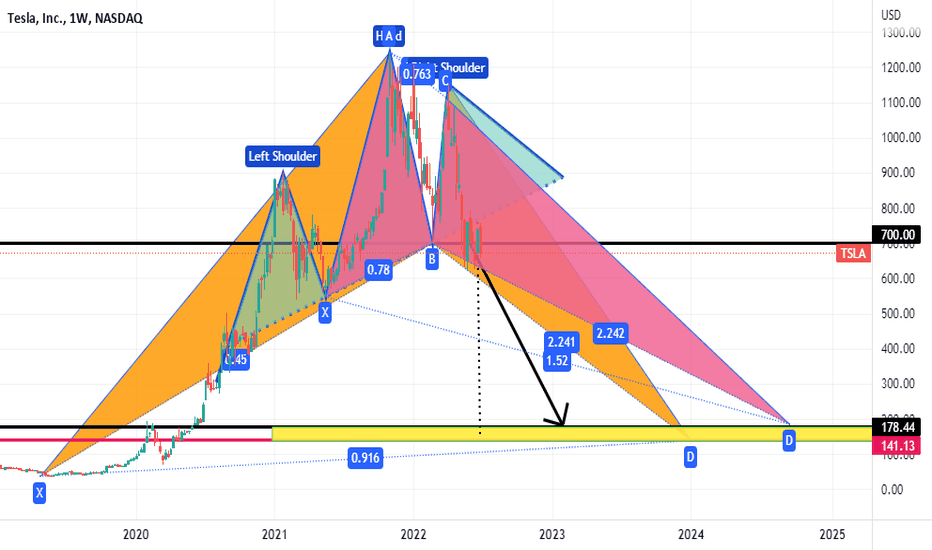
 Short
Short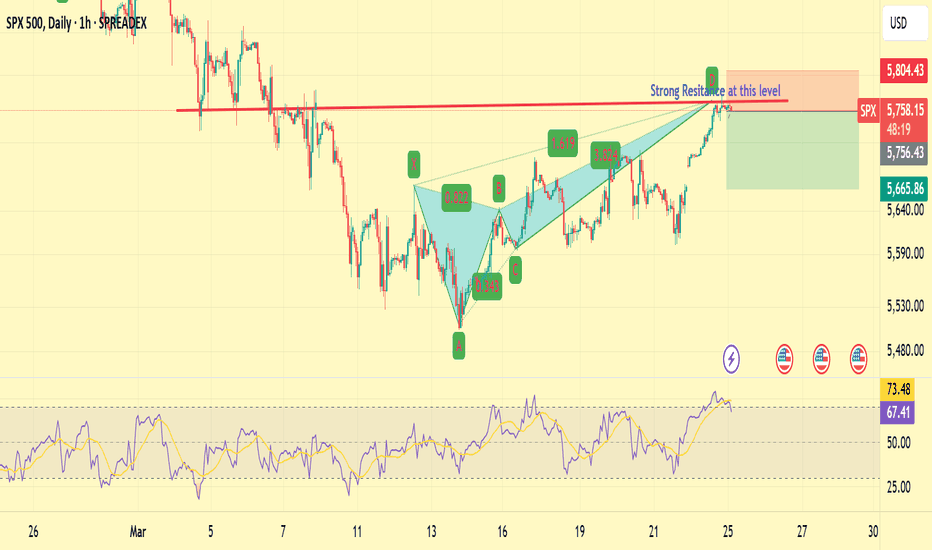
Short 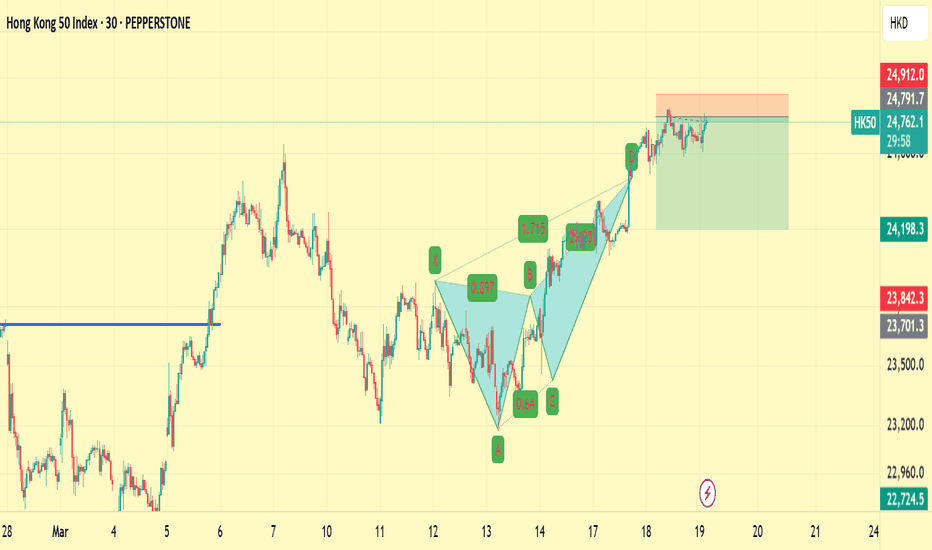
EUR/JPY Market Analysis: Potential Reversal at Key Resistance LeThe EUR/JPY pair, on the 4-hour chart, exhibits a strong bullish impulse that recently peaked around 163.64 , aligning with a key Fibonacci extension level (1.618). This area marks a critical resistance zone, where price action has shown signs of rejection.
The Harmonic pattern, such as the b]Crab , suggest potential exhaustion of the uptrend. The latest leg upward reached a 2.618 extension , reinforcing the possibility of a corrective move. Support levels to monitor include ** 162.23 ** (BC) and ** 160.59 ** (T1), which could serve as downside targets if bearish momentum gains traction.
For traders, a decisive break above **163.64** could invalidate the short-term bearish bias, paving the way for further upside. Conversely, sustained rejection from this level may trigger a deeper retracement towards key Fibonacci and harmonic support zones.
Conclusion : The pair is at a critical inflection point, where price action and confirmation of rejection signals will determine the next directional move. Traders should watch for price action at resistance and key support levels to assess trade opportunities. USD/CAD - Harmonic Patterns and Momentum IndicatorsTechnical Analysis of USD/CAD - Harmonic Patterns and Momentum Indicators
Overview:
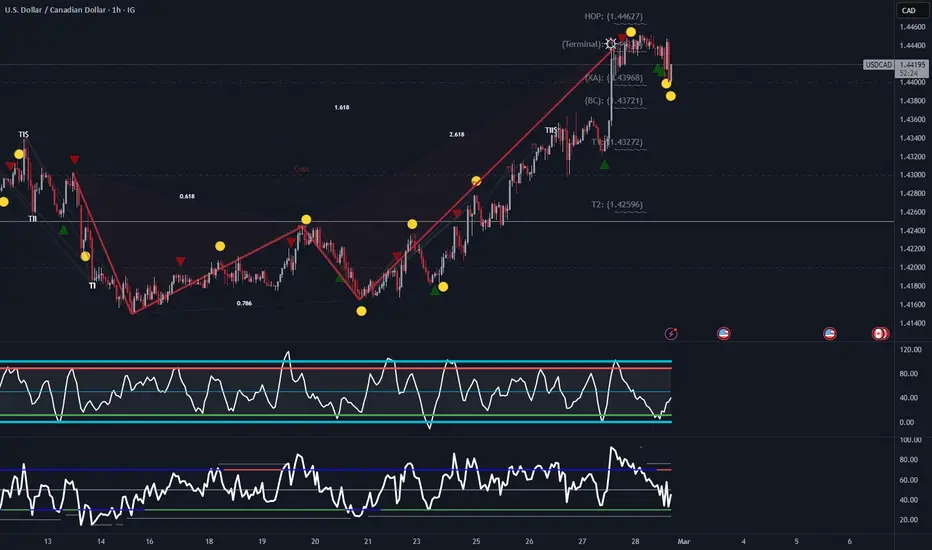
The USD/CAD chart illustrates price action on the hourly timeframe, incorporating harmonic patterns, Fibonacci retracements, and momentum indicators to identify potential reversal and continuation points. The presence of a Crab harmonic pattern suggests a critical turning point, while momentum oscillators provide additional confirmation.
**Harmonic Pattern Analysis:**
1. A **Crab harmonic pattern** is evident, with the price reaching the terminal point at approximately **1.44627**.
2. The **XA and BC Fibonacci extensions** align with key retracement levels, reinforcing the likelihood of a reversal at this zone.
3. The price has **rejected the high point**, indicating potential exhaustion of bullish momentum.
**Support and Resistance Levels:**
- **HOP (Harmonic Optimal Point):** **1.44627** - The potential completion zone of the Crab pattern.
- **XA Retracement:** **1.43968** - A key structural support level.
- **BC Level:** **1.43721** - A secondary support level for price continuation.
- **T2 (Target 2):** **1.42596** - A potential downside target if bearish momentum continues.
**Momentum Indicators:**
- **Stochastic RSI & Relative Strength Index (RSI):**
- The **Stochastic RSI** shows a recent overbought condition, followed by a decline, indicating potential bearish momentum.
- The **RSI also exhibits bearish divergence**, where price made a higher high while RSI formed a lower high, suggesting weakening bullish strength.
**Market Sentiment & Potential Trade Opportunities:**
- Given the rejection at **1.44627**, a **short position** could be considered if confirmation of further downside emerges.
- A break below **1.43968** could reinforce the bearish bias, with **1.42596** as a potential target.
- However, if the price finds support and rebounds, a bullish continuation could be anticipated, requiring further validation.
**Conclusion:**
The **Crab harmonic pattern, overbought momentum indicators, and Fibonacci confluence suggest a possible bearish reversal**. Traders should monitor **key support levels and momentum shifts** to determine whether the bearish scenario plays out or if buyers regain control. Risk management and confirmation signals are crucial before entering a trade.  Long
Long
 Short
Short
 Short
Short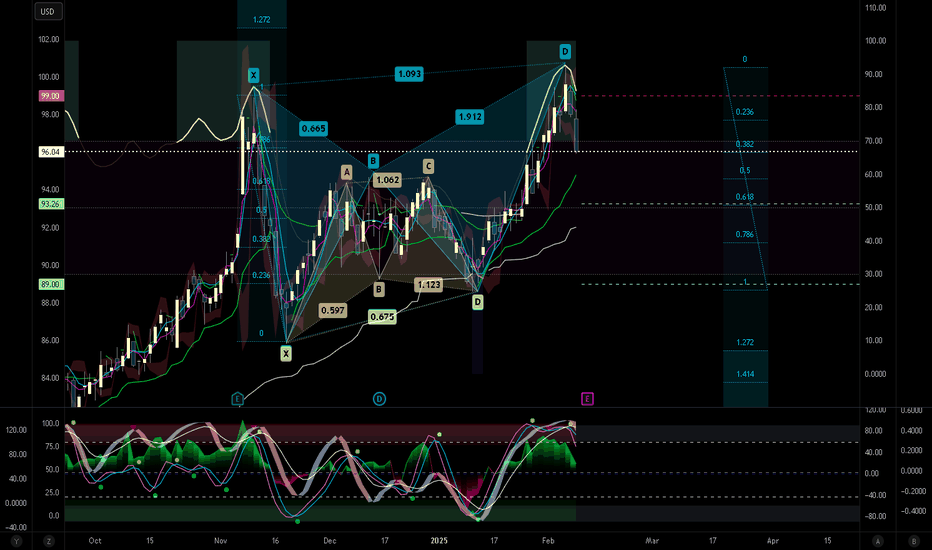
 Short
Short