Bitcoin Trapped for 8 Days—Is the Range Finally About to Break?Bitcoin ( BINANCE:BTCUSDT ) has been trading between the Support and Resistance Zones for the past eight days, creating a range-bound market with no clear directional trend.
BTC is now testing the Support Zone, the Cumulative Long Liquidation Leverage($83,000-$82,140), and the Support Lines.
Can Bitcoin rebound from this area and finally break the eight-day range?
Technical Analysis
From an Elliott Wave perspective, Bitcoin appears to be completing Primary Wave 4, potentially developing as a
Elliott Wave
USDCHF Rejects Major PRZ: Is a Deeper Correction Starting?USDCHF ( OANDA:USDCHF ) started to decline after entering the Heavy Resistance Zone(0.8476-0.8332), reacting to the Resistance Lines, and reaching the major Potential Reversal Zone(PRZ) .
The pair is now trading below the key trading level of 0.838 CHF, keeping short-term bearish pressure intact.
Can USDCHF recover above 0.84 CHF, or is a deeper corrective move beginning?
Technical Analysis
From an Elliott Wave perspective, USDCHF appears to have completed Primary Wave 5, suggesting that cor
Bitcoin Breaks Key Support — Is $83K the Next Stop?Bitcoin ( BINANCE:BTCUSDT ) has started to decline with strong bearish momentum and is now attempting to break below the Support Zone($84,940-$85,460).
The current structure suggests that selling pressure is increasing, while USDT Dominance% is also supporting the bearish scenario.
Can Bitcoin hold this Support Zone, or is a deeper correction toward $83,000 beginning?
Technical Analysis
From an Elliott Wave perspective, Bitcoin appears to have completed Primary Wave 5 through an Expanding En
One Last Shot - BTC Update (45M) - (1W)It seems like there is still room for Bitcoin to go up just a little bit longer until the final bullet is spent.
Despite an extremely complex structure and bearish divergences across the oscillators, Bitcoin is showing signals for one more push.
After the larger triangle breakout, Bitcoin created a standard impulsive inner structure: a five-wave upward move.
The inner triangle, which is only visible on the 1H or lower timeframes, has broken out and is forming an expanding diagonal (which is e
XAUUSD — Bullish Wave Setup From Buy Zone
Gold is showing a potential bullish recovery structure after reacting from the lower support area. From Kelly’s view, the chart suggests that XAUUSD may be building a new upside Elliott Wave sequence, with price currently holding above the Buy zone wave 3.
The key idea is simple: if buyers continue defending the lower buy zone, gold may push higher toward the resistance levels above, then extend toward the final wave 5 target.
⟡ Market structure
Gold is currently trading around 4,167, after bo
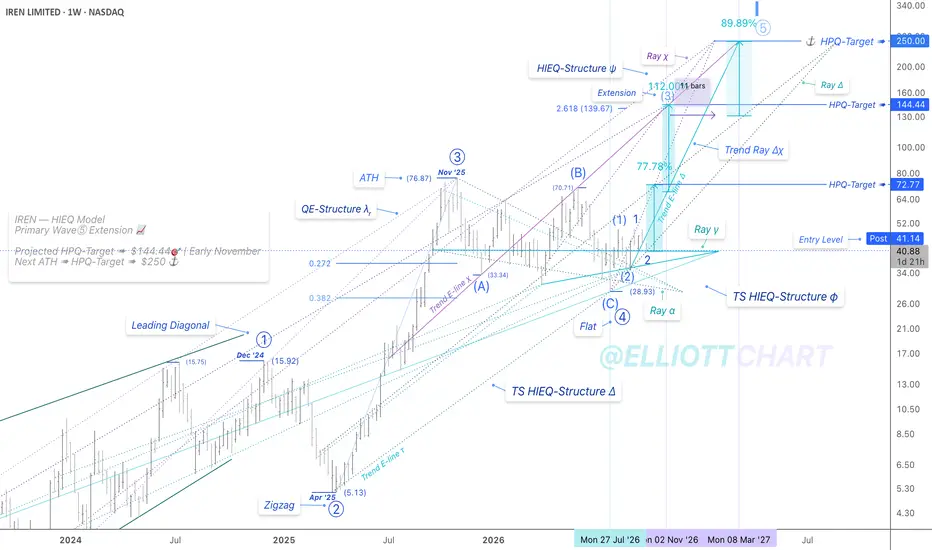
IREN | WeeklyNASDAQ:IREN — HIEQ Model
The COD is precisely at the consolidation level defined on Ray γ of the TS HIEQ-Structure φ .
My analysis hasn't changed—just further validation.
I continue to project the 77.7 % 📈 potential impulsive surge within Intermediate Wave (3) of the Primary Wave ⓹ extension. Patience is key during these foggy days!!🌫️
#StrategicAnalysis #MarketInfrastructures #CymaticTrendflow
#FutureVision #TimeSpaceMap #TSMap
USDT.D: The First Drop Played Out, 6.233% Now Decides What ComesThe previous Kap Waves thesis called for another decline in USDT dominance, with the broader idea that a continued fall in USDT.D could be constructive for crypto.
That downside structure has developed.
USDT.D has fallen to 6.324%, moving substantially lower from the corrective structure around the 7% area seen in the previous analysis. The decline has developed in line with the broader bearish wave structure.
However, the deeper downside objective has not yet been reached. The chart currentl
$EURUSD - Falling Wedge at Resistance: Watch $1.16Hi guys! 👋
🔔 Euro has been recovering after a continuous drop since mid-January, which pushed price to a new year-to-date low at $1.13245. That decline was orderly — not a crash, not panic selling — and it left a clear technical structure behind it.
🔔 The correction formed a falling wedge, internally structured as a 5-wave ABCDE sequence. Wedges of this type are typically continuation or reversal patterns depending on where they appear in the broader trend, and this one is sitting at a locatio
PEPE: 245 Days After the Original Forecast, It's Still Going!What Played Out
On January 31, 2026, I published the original PEPE analysis as a textbook Elliott Wave case study.
245 days later, the larger structure is still playing out.
The original analysis projected a prolonged corrective phase following the previous major advance, with the forecasted bottom developing within the lower Fibonacci retracement area.
That correction has now extended into the projected bottom region.
More importantly, PEPE has already traded down toward the $0.00000223 p
Tesla Elliott Wave Analysis: Bulls Attempt to Regain ControlTesla sold off aggressively in July following a disappointing earnings report, breaking below the 335 support and extending the deeper correction from the December highs. However, we still think this decline can be counted as wave C within a larger corrective structure.
Price is now reversing from the lower boundary of the declining channel, while the earnings gap has been filled and the bullish level was also tested. This opens the door for bulls to take control with wave 1 of a new five-wave
EURJPY: Complex Correction Could Extend Towards 174EURJPY is in pullback mode, and it looks like the correction from the April highs could last a bit longer, as the structure appears to be developing as a complex correction. With the recent push to a new swing low below 180, we should be aware of a potential seven-swing W-X-Y structure.
If this count is correct, wave Y could still have room to the downside, potentially targeting the gap from October 2025. That area could provide major support around 174, where we could then look for signs of a
IREN pullback to 32-35The abc move for wave (1) looks like it started a leading diagonal which might have finished today. My main target would be about 32.4 since it is the top of the open bull gap and also 78% retracement of the leading diagonal. After that we should finally get our wave 3 into the end of the year.
EURUSD Long on Wave 4 Ends in Ending Diagonal Wave YIn this video, I walk through the Elliott Wave counts for EURUSD and suggests that Wave 4 is very close to the end with an "Ending Diagonal" setup.
I also go through how I will trade this structure using 3 different previous support. In fact, I will only go Long EURUSD until price hits the invalidation price.
Good luck!
NIFTY Futures — Elliott Wave Count: Wave 5 Downside SetupThe chart presents a larger ABC corrective structure from the previous high, with the current decline developing as the next impulsive leg.
Short term - Bullish...
Elliott Wave Structure
* Wave A: The initial major decline from the ~26,500 area toward 22,050, completing the first leg of the correction.
* Wave B: A complex corrective recovery followed, forming an A-B-C structure and ultimately reaching the ~24,800 region.
* From the Wave-B peak, the market appears to be developing the final
XAUUSD — Bullish Recovery From Wave 5 Low
Gold is showing a bullish recovery after completing the previous bearish wave near the lower support area. From Kelly’s view, the chart suggests that XAUUSD may be shifting into a short-term upside structure, with price now building higher lows above the recent wave (5) bottom.
The key idea is simple: gold may pull back slightly into the buy zone first, but as long as buyers defend that area, the next bullish wave can continue toward the Fibonacci target and the upper resistance zone.
⟡ Marke
IREN | WeeklyNASDAQ:IREN — Enhancing the HIEQ Model
Trend Analysis 📈
During this structural data transmission from the Corrective Phase Rays toward the Trend Ray Advance, we are surrounded by misleading news and conflicting narratives, as you all know—I call them foggy days.🌫️
No specific change to my analysis; I’ve just designed a T ransition- S upport HIEQ-Structure φ , with Rays ➤ α and γ , in which Ray γ functions as a structural launchpad, as highlighted on the chart.
With the preset now fully
WTI Crude Oil | Testing a Nested Wave III Structure⏱️ Reading Time: About 2 Minutes
For this update, I am focusing only on the bullish scenario and allowing price action to show us whether this structure can continue to develop.
One possibility I am currently tracking is a sequence of three nested 1–2 structures across different degrees. If this interpretation is correct, the market may be building the early stages of a larger Wave III, with each lower-degree structure preparing the next impulsive advance.
The recent decline is important, but
TAO — The Next Long SetupAfter completing the 5 impulse waves, TAO is now working through a corrective ABC structure, with Wave C currently in progress.
Today’s sharp drop makes sense after the 4-day sideways trading range, where a lot of longs had time to build up and get trapped. The flush was needed to clear that liquidity, and now I’m looking towards the downside targets.
The first level I want to see taken out is the $278.1 swing low. Ideally, we get that sweep over the weekend.
Below the swing low, we have a re
Part 4 Elliott Waves: Professional Guide to the Triangle Pattern🥇 Part 4 Elliott Waves: Professional Guide to the Triangle Pattern | GOLD – 5H
Welcome to Part 4 of our educational series dedicated to the secrets and rules of Elliott Wave Theory and Price Action reading.
In previous parts, we learned how to build the initial five-wave count, handle alternatives, and distinguish structural breaks. Today in this part, we dive deep into one of the most deceptive and powerful corrective patterns: The Contracting Triangle Pattern .
Our goal in this lesson i