AYE FINANCE — A CONTRACTION, WORTH WATCHING.Daily chart | Educational study only
AYE Finance has spent the last several weeks consolidating after a strong advance from the April lows.
At first glance, it looks like a simple sideways range. But the more interesting part is what is happening inside that range.
The structure
The upper end of the base has repeatedly attracted supply, while the lows inside the range have gradually moved higher.
That gives the structure ascending-triangle characteristics: resistance remains broadly in the same area, while buyers appear willing to step in progressively higher on each pullback.
The stock is still inside the base, so there is no confirmed breakout yet. What is interesting is that the structure appears to be getting tighter.
The contraction is the interesting part
The swings inside the base appear to be progressively shrinking.
The first pullback was relatively deep.
The next was shallower.
The latest contraction is tighter again.
That gives the chart VCP-like characteristics.
The basic idea behind volatility contraction is straightforward: as a base matures, aggressive supply can gradually reduce. If fewer holders are willing to sell at progressively lower prices, the swings often become quieter and tighter.
That is what makes this chart worth monitoring.
The rounded contractions
Another interesting feature is the character of the lows.
Instead of repeated sharp V-shaped reversals, several of the pullbacks have developed more gradually and formed rounded contractions.
That suggests orderly consolidation rather than panic liquidation.
It doesn't guarantee a positive resolution, but the character of the pullbacks can be just as important as their direction.
Volume
Volume has generally moderated through much of the consolidation, apart from a few obvious expansion days, including earnings-related activity.
That is broadly constructive for a developing base.
What matters more from here is whether participation expands meaningfully when the range eventually resolves.
Recent average trading activity also does not suggest an extremely illiquid counter, so the tightening cannot simply be dismissed as price becoming quiet because nobody is participating.
Market context matters
The broader market backdrop deserves serious attention here.
The candle from two sessions ago was particularly ugly across multiple indices and sectors. Several sectors slipped below their 50-DMA, breadth deteriorated sharply, and the technical structure of many individual stocks was damaged.
So far, we have not seen meaningful follow-through to that weakness.
But no immediate follow-through does not mean the risk has disappeared. Further selling can still emerge, and damaged breadth often takes time to repair.
That makes this an environment where analysing an individual chart in isolation can be misleading.
Even when a stock-specific setup looks constructive, absolute caution and disciplined risk management are imperative. Position sizing, stop discipline and respect for overall market breadth matter as much as the individual setup.
What I would watch
Not a target.
Not an entry.
Just behaviour.
Does price eventually leave the base with strong participation and hold the move?
Or does it lose the sequence of higher lows and fall back deeper into the range?
Either outcome provides information.
Until then, this remains a developing consolidation with tightening price action near the upper part of the base.
The structure is interesting, but given the current broader-market backdrop, confirmation matters more than anticipation.
Takeaway
The most interesting bases are often the boring ones.
After a strong move, a stock that stops advancing, absorbs supply, forms progressively smaller contractions and continues to hold higher lows deserves attention.
But no stock operates in a vacuum.
The important part is not predicting the breakout. It is watching whether price, volume and the broader market eventually confirm that demand has taken control.
Disclaimer: This post is for educational and chart-study purposes only. It is not investment advice or a recommendation to buy or sell any security. I am not a SEBI-registered Research Analyst or Investment Adviser. Please conduct your own research, manage risk appropriately and consult a SEBI-registered professional before making any investment or trading decision.  Long
Long
MAR: Daily Ascending Triangle Breakout & Retest1. The Macro Perspective: The Ascending Triangle Base
I am taking a LONG bias on Marriott International (MAR) on the daily (1D) timeframe.
When analyzing pure market structure on a global hospitality leader, prolonged consolidation patterns are necessary to build kinetic energy for the next major thrust. Following its steady rally throughout late 2025 and early 2026, the stock entered a massive ascending triangle formation. This structure was characterized by a flat overhead resistance ceiling and a rising sequence of higher lows along a dynamic trendline. This pattern successfully absorbed profit-taking and allowed institutional capital to quietly accumulate shares. Fundamentally, this technical momentum aligns perfectly with the company's strong Q1 2026 earnings report, where adjusted diluted EPS came in at $2.72, easily surpassing consensus estimates of $2.58. Furthermore, total revenues reached $6.65 billion, reflecting a 6% year-over-year increase. The company also reported a 4.2% increase in global RevPAR, exceeding expectations driven by strong travel demand.
2. The Educational Setup: Horizontal Resistance and Dynamic Support
To understand the absolute technical validity behind this setup, look closely at how the price structure interacted with its core boundaries right before breaking out:
The 378.05 Resistance Ceiling: The definitive line in the sand for a bullish continuation was the solid black horizontal resistance line drawn at 378.05. As the price tested this upper boundary multiple times over the past month, it established a massive supply zone that systematically rejected upward expansion until the recent catalyst.
The Ascending Trendline: During the consolidation block, every deep pullback was heavily defended by institutional buyers at progressively higher levels, forming the solid black diagonal support line. This sequence steadily squeezed volatility directly beneath the breakout zone, building immense structural pressure.
3. Current Price Action: Breakout and Structural Retest
Look at the most recent daily candles on the far right of the chart. The structural pressure cooker exploded. Driven by strong fundamental catalysts, institutional buyers stepped in with undeniable conviction, printing a powerful green expansion candle that decisively obliterated the 378.05 ceiling and pushed the stock to fresh all-time highs near 386.88. The most recent daily candle is a healthy red pullback closing at 376.84, acting as a textbook retest of the breakout zone. The stock is officially attempting to transition out of accumulation and into a highly explosive markup trend into blue-sky territory.
4. The Trade Plan: Entries, Targets, and Risk Management
Entry Strategy: Momentum remains strong despite the recent intraday pullback. The highest-probability, lowest-risk entry strategy involves utilizing this exact current structural retest. Look to scale into long positions right here in the 375.00 to 378.00 zone. Letting old historical resistance prove itself as a concrete new support floor provides an unmatched risk-to-reward ratio before the next leg up.
Take Profit (Targets): We use a classical measured move strategy based on the structural depth of the ascending triangle. By taking the depth of the major range (roughly 30 points from the 348.00 swing low up to the 378.05 ceiling) and projecting it upward from the breakout point, our primary structural target sits comfortably in the 405.00 to 410.00 zone over the coming weeks as pure price discovery continues.
Invalidation (Stop Loss): An ascending triangle breakout thesis is completely invalidated if the price fails to hold its newly claimed structural floor and collapses back inside the core of the base boundaries. A hard stop loss should be placed safely below the diagonal trendline and the recent higher lows, specifically around the 355.00 to 360.00 level. A definitive daily close completely back below 355.00 would act as a severe warning sign of a failed breakout and a major bull trap.
5. Time Horizon:
Because this technical setup is built on a 1-Day chart capturing a clear structural phase transition and an all-time high horizontal breakout, this is a high-alpha swing trade designed to capture a rapid momentum markup phase over the coming weeks. Let the trend run!  Long
Long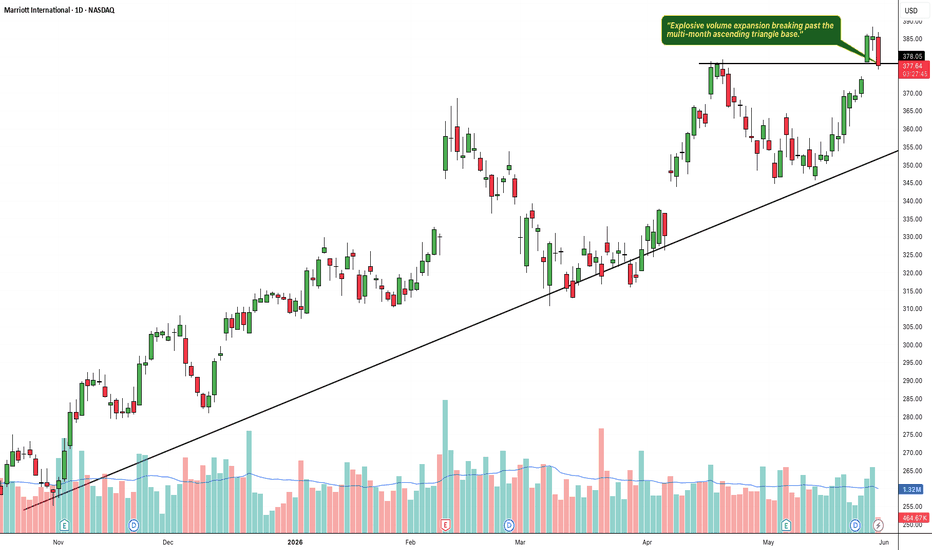
ILMN: Weekly Ascending Triangle Breakout1. The Macro Perspective: The Multi-Month Accumulation Base
I am taking a LONG bias on Illumina, Inc. (ILMN) on the macro weekly (1W) timeframe.
When analyzing pure market structure on a biotechnology leader, prolonged consolidation patterns are necessary to build kinetic energy for the next major thrust. Following a severe markdown phase throughout 2025, the stock carved out a massive structural bottom and entered a prolonged accumulation phase. This ascending triangle formation successfully absorbed overhead supply while institutional capital quietly accumulated shares at progressively higher levels. Fundamentally, this technical momentum is strongly supported by the company's recent Q1 2026 earnings report. Illumina delivered strong revenue of $1.09 billion, representing a 4.8% year-over-year increase, and reported a non-GAAP EPS of $1.15. Based on robust clinical demand, management even raised their full-year revenue guidance to roughly $4.57 billion. Furthermore, on May 28, 2026, the company announced the launch of an innovative whole-genome sequencing solution aimed at advancing molecular residual disease (MRD) research for cancer, providing a significant fundamental catalyst for future growth.
2. The Educational Setup: Horizontal Resistance and Ascending Support
To understand the absolute technical validity behind this launch, look closely at how the price structure interacted with its core boundaries prior to breaking out:
The 152.34 Resistance Ceiling: The definitive line in the sand for a macro trend reversal was the solid black horizontal resistance line drawn at 152.34. This level acted as a heavy supply zone over the past year, systematically capping upward momentum and rejecting breakout attempts.
The Ascending Trendline: Notice how every deep structural pullback since early 2025 was heavily defended by buyers at progressively higher levels, forming the solid black diagonal support line. This sequence of higher lows steadily squeezed volatility directly beneath the breakout zone, building immense structural pressure.
3. Current Price Action: Breakout and Volatility Expansion
Look at the most recent weekly candle on the far right of the chart. The structural pressure cooker has officially exploded. Driven by the strong earnings and new product pipeline, institutional buyers stepped in with undeniable conviction. The stock printed a massive, full-bodied green expansion candle that decisively obliterated the 152.34 ceiling, currently trading strong near 164.28. This explosive thrust confirms that the asset has officially transitioned out of the accumulation phase and into a highly explosive secular markup trend into fresh territory.
4. The Trade Plan: Entries, Targets, and Risk Management
Entry Strategy: Momentum is exceptionally strong with the stock trading vertically out in the open above the pivotal breakout line. Chasing an extended weekly breakout candle carries a minor risk of a short-term, lower-timeframe mean-reversion pullback. The highest-probability, lowest-risk entry strategy involves stepping down to the daily timeframe and looking to scale into long positions on a potential structural pullback that perfectly retests the broken 148.00 to 153.00 prior resistance zone. Letting old historical resistance prove itself as a concrete new support floor provides an unmatched risk-to-reward ratio.
Take Profit (Targets): By utilizing a classical measured move strategy based on the structural depth of the ascending triangle pattern, we can project upside targets. Taking the approximate depth of the range (roughly 70 points from the structural floor near 80.00 up to the 152.34 ceiling) and projecting it upward from the breakout point, our primary structural macro target sits comfortably in the 215.00 to 225.00 zone over the coming quarters as price discovery continues.
Invalidation (Stop Loss): An explosive breakout thesis is completely invalidated if the price fails to hold its newly claimed structural floor and collapses back inside the core of the base boundaries. A hard stop loss should be placed safely below the diagonal trendline and the recent weekly higher lows, specifically around the 130.00 to 135.00 level. A definitive weekly close completely back below 130.00 would act as a severe warning sign of a failed macro breakout and a major bull trap.
5. Time Horizon:
Because this technical setup is built on a 1-Week chart capturing a clear structural phase transition and a major horizontal breakout, this is a longer-term position trade designed to capture a rapid momentum markup phase over the coming months. Let the macro trend run!  Long
Long
AVALONhas explosively broken out of a massive ascending triangle1. The Macro Perspective: The Institutional Staircase
I am taking a LONG bias on Avalon Technologies Limited (AVALON) on the weekly (1W) timeframe.
When analyzing pure market structure, the most powerful and sustainable breakouts occur in alignment with an established macro trend. Look at the massive structural development on this chart. The defining feature is the steep, unbroken ascending trendline (the lower solid black line). Every single time the stock experienced a pullback, institutional buyers aggressively stepped in exactly at this dynamic support line. They refused to let the secular bull trend break, consistently printing higher lows and indicating massive, systemic accumulation over the long term.
2. The Educational Setup: The Squeeze and The Ceiling
To understand the sheer strength of this current breakout, look at how the price systematically squeezed historical resistance to form a textbook "Ascending Triangle":
The Concrete Ceiling: The stock's recovery was heavily capped by a formidable horizontal resistance line at 1,264.45. Sellers repeatedly defended this extreme high, creating a clear supply ceiling.
The High-Level Squeeze: Notice how the pullbacks became shallower over time, riding the ascending trendline and the 20 SMA (the middle blue line of your Bollinger Bands). By pressing up against the flat horizontal ceiling while simultaneously forming higher lows, the stock acted like the ultimate pressure cooker. It gracefully transferred shares from impatient retail traders to strong-handed institutional buyers, storing immense kinetic energy as the structure tightened.
3. Current Price Action: Riding the Upper Band into Blue Sky
Look at the most recent weekly candles on the far right. The high-level pressure cooker has absolutely exploded. Buyers have effortlessly shattered the 1,264.45 macro ceiling with a massive, full-bodied green momentum thrust, pushing the price well past the 1,400 mark. Furthermore, notice how the price has violently pierced the upper Bollinger Band, forcing the bands to rapidly expand upward. By decisively clearing this extreme resistance zone, AVALON has officially entered "Blue Sky Territory" (pure price discovery). All historical overhead supply has been completely eliminated.
4. The Trade Plan: Entries, Targets, and Risk Management
Entry Strategy: Momentum is exceptionally strong right now near 1,464.40. Chasing a massive vertical expansion candle that is riding outside the weekly Bollinger Bands always carries a higher risk of an immediate intraday or daily mean-reversion pullback as the stock breathes. The highest-probability, lowest-risk entry involves stepping down to a daily timeframe and waiting for the dust to settle. Look to place limit orders to catch a potential structural pullback to perfectly retest the 1,260.00 to 1,300.00 breakout zone. Letting that heavy historical resistance prove itself as a new, indestructible support floor offers a phenomenal risk-to-reward ratio.
Take Profit (Targets): Because the stock is breaking out of a massive macro structure into pure price discovery, we use measured targets based on the depth of the pattern. By taking a conservative depth of the ascending triangle (roughly 600+ points from the ~646 mid-base up to the 1,264.45 ceiling) and projecting it upward from the breakout line, our primary structural macro target sits comfortably in the 1,850.00 to 1,900.00 zone. The immediate psychological milestone will be the 1,500.00 mark.
Invalidation (Stop Loss): A trade thesis is only valid if the new market structure holds. A hard stop loss should be placed safely below the breakout line and the rising 20 SMA, around the 1,100.00 to 1,150.00 level. A definitive weekly close completely back inside the triangle and breaking below the ascending trendline would invalidate the immediate continuation thesis and signal a severe macro bull trap.
5. Time Horizon:
Because this technical setup is built on a 1-Week chart capturing a massive structural phase transition and volatility expansion, this is a medium-to-longer-term position trade designed to capture the explosive new markup phase. Let the new trend run!  Long
Long
ASML: Daily Ascending Triangle Breakout1. The Macro Perspective: The Secular Tech LeaderI am taking a LONG bias on ASML Holding N.V. (ASML) on the daily (1D) timeframe.When analyzing pure market structure on a mega-cap technology leader, periods of horizontal digestion are essential before the next major leg up. Following a strong rally in early 2026, the stock entered a multi-month consolidation phase. Rather than collapsing, institutional buyers stepped in at progressively higher prices, establishing a clear sequence of higher lows. Fundamentally, this technical strength aligns with recent news that UBS raised its price target on ASML, citing rising demand for AI chips and predicting a prolonged investment cycle extending into 2028. Additionally, the company recently announced a strategic partnership with Tata Electronics to advance India's semiconductor manufacturing ecosystem, reinforcing ASML's global dominance. 2. The Educational Setup: The Ascending TriangleTo understand the absolute technical validity behind this setup, look at the key components forming the accumulation structure:The Rising Support Floor: Notice the diagonal trendline starting from the mid-March lows. Buyers consistently defended the daily 20 SMA (the middle blue line of the Bollinger Bands), carving out a sequence of higher lows. This indicates that institutional accumulation was becoming increasingly aggressive.The 1,529.24 Resistance Ceiling: While the lows were getting higher, the highs were being capped by a massive horizontal resistance line drawn at 1,529.24. The price action compressed tightly between the rising trendline and this rigid ceiling, forming a textbook Ascending Triangle. This pattern represents a volatility squeeze, where demand systematically overpowers supply until the ceiling breaks.3. Current Price Action: Volatility Expansion and BreakoutLook at the recent cluster of daily candles on the right side of the chart. The structural pressure cooker has exploded. Buyers have stepped in with undeniable conviction, printing a powerful sequence of green expansion candles that decisively shattered the 1,529.24 horizontal ceiling. The stock is currently trading around the 1,632.90 level, up 2.57% on the session. By closing cleanly above this multi-month resistance block, the price has transitioned out of the ascending triangle compression phase and into a high-volatility markup trend.4. The Trade Plan: Entries, Targets, and Risk ManagementEntry Strategy: Momentum is currently very strong, with the stock trading out in the open above the breakout line. Chasing an extended daily move carries a short-term mean-reversion risk. The highest-probability, lowest-risk entry strategy involves waiting for a minor structural cooling-off period. Look to scale into long positions or place limit orders to catch a potential pullback that retests the broken 1,520.00 to 1,540.00 neckline zone. Letting old historical resistance prove itself as a concrete new support floor offers a phenomenal risk-to-reward ratio.Take Profit (Targets): We use a classical measured move strategy based on the depth of the ascending triangle pattern. By taking the maximum depth of the pattern (roughly 290 points from the ~1,240 base up to the 1,529.24 ceiling) and projecting it upward from the breakout point, our primary structural target sits comfortably in the 1,800.00 to 1,820.00 zone over the coming weeks.Invalidation (Stop Loss): An ascending triangle breakout thesis is invalidated if the price fails to hold its newly claimed structural floor and collapses back below the rising trendline. A hard stop loss should be placed safely below the daily 20 SMA cushion and the recent higher low, specifically around the 1,410.00 to 1,430.00 level. A definitive daily close completely back below 1,400.00 would act as a severe warning sign of a failed macro breakout and a major bull trap.5. Time Horizon:Because this technical setup is built on a 1-Day chart capturing a classic structural continuation pattern and a clear horizontal breakout, this is a high-alpha swing trade designed to capture a rapid momentum markup phase over the coming weeks. Let the trend run!  Long
Long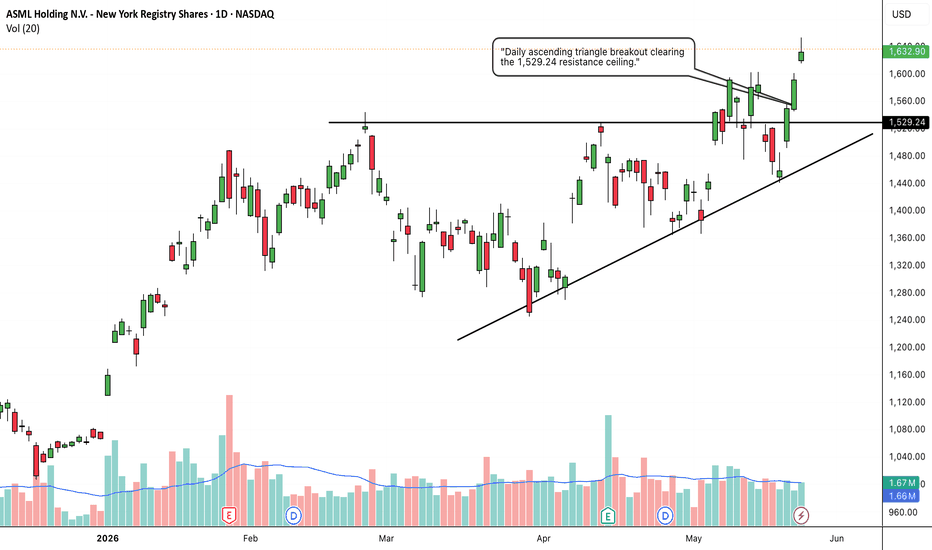
APOLLOHOSP: Massive Ascending Triangle and Blue Sky Breakout1. The Macro Perspective: The Secular Trendline
I am taking a LONG bias on Apollo Hospitals Enterprise Limited (APOLLOHOSP) on the weekly (1W) timeframe.
When analyzing pure market structure, the most powerful breakouts occur in alignment with an established secular trend. Look at the massive structural development on this chart. The defining feature is the steep, unbroken ascending trendline originating from the bottom left. Every single time the stock experienced a deep macro pullback, institutional buyers aggressively stepped in exactly at this dynamic support line. This tells us that heavy capital is systematically accumulating shares over the long term and refusing to let the secular bull trend break.
2. The Educational Setup: The Ascending Pressure Cooker
To understand the sheer strength of this current breakout, look at how the price systematically squeezed historical resistance to form a textbook "Ascending Triangle":
The Concrete Ceiling: The stock's recovery was heavily capped by a formidable horizontal resistance line at 7,968.20. Sellers repeatedly swatted the price down from this level.
The Squeeze: Notice how the pullbacks became shallower over time. Because buyers were defending the ascending trendline, they stepped in at higher and higher prices. By aggressively pressing up against the 7,968.20 horizontal ceiling while forming higher lows, the stock acted like the ultimate pressure cooker. It squeezed short-sellers and transferred shares to strong-handed buyers, storing immense kinetic energy for the final launch.
3. Current Price Action: Entering the Price Vacuum
Look at the most recent weekly candle on the far right. The high-level pressure cooker has absolutely exploded. Buyers have effortlessly shattered the 7,968.20 macro ceiling with a massive, full-bodied green momentum thrust, pushing the price above 8,000. By decisively clearing this multi-month accumulation zone, APOLLOHOSP has officially entered "Blue Sky Territory" (pure price discovery). There is absolutely zero historical overhead supply left. Every investor holding this stock is now in profit, meaning natural selling pressure evaporates.
4. The Trade Plan: Entries, Targets, and Risk Management
Entry Strategy: Momentum is exceptionally strong right now near 8,084.00. Chasing a massive vertical expansion candle on the weekly timeframe always carries a higher risk of agonizing intraday drawdowns as the stock naturally breathes. The highest-probability, lowest-risk entry involves stepping down to a daily timeframe and waiting for the dust to settle. Look to place limit orders to catch a potential structural pullback to retest the 7,950.00 to 8,000.00 breakout zone. Letting that heavy historical resistance prove itself as a new, indestructible support floor offers a phenomenal risk-to-reward ratio.
Take Profit (Targets): Because the stock is in pure price discovery, we use measured structural targets based on the depth of the pattern. By taking the widest part of the ascending triangle (roughly 1,150 points from the ~6,800 trendline bounce to the 7,968.20 ceiling) and projecting it upward, our primary structural macro target sits comfortably in the 9,100.00 to 9,150.00 zone. Immediate psychological milestones are 8,500.00 and 9,000.00.
Invalidation (Stop Loss): A trade thesis is only valid if the new market structure holds. A hard stop loss should be placed safely below the breakout line and the most recent swing low along the trendline, around the 7,300.00 to 7,400.00 level. A definitive weekly close completely back inside the triangle and breaking below the ascending trendline would invalidate the immediate continuation thesis and signal a severe macro bull trap.
5. Time Horizon:
Because this technical setup is built on a 1-Week chart capturing a massive structural phase transition and ascending triangle breakout, this is a medium-to-longer-term position trade designed to capture the explosive new markup phase. Let the new trend run!  Long
Long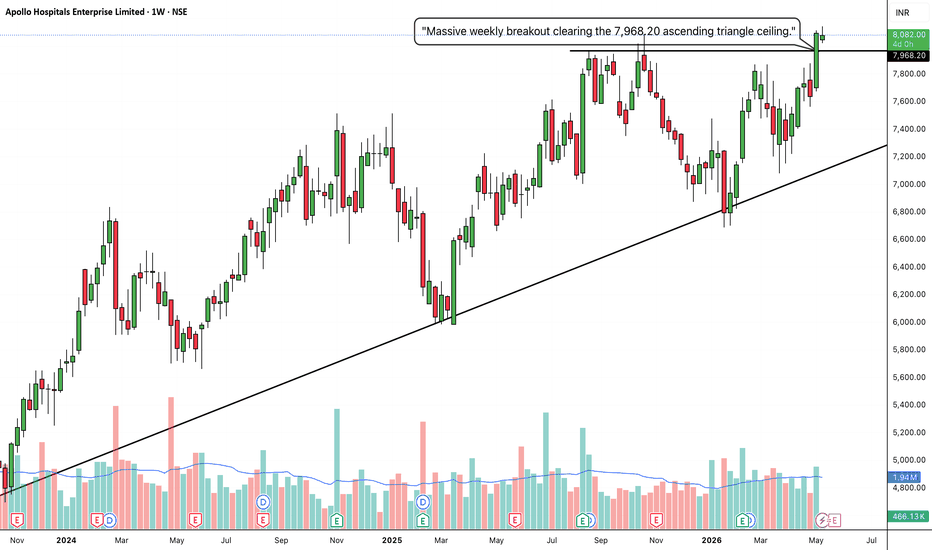
MARICO: The Ascending Pressure Cooker and High-Level Base Breako1. The Macro Perspective: The Ascending Squeeze
I am taking a LONG bias on Marico Limited (MARICO) on the daily (1D) timeframe.
When analyzing pure market structure, the most powerful breakouts come from prolonged periods of systemic accumulation. Look at the structural development on the left side of this chart. For months, the stock was trapped below the heavy historical ceiling at the solid black 755.05 line. However, look at the ascending trendline at the bottom. Every single time the stock pulled back, institutional buyers stepped in aggressively at higher and higher prices. By violently pressing up against a horizontal ceiling while forming higher lows, the stock formed a massive "Ascending Triangle"—acting as a pressure cooker to systematically squeeze out short-sellers.
2. The Educational Setup: The Step-Up Base
To understand the sheer strength of this current breakout, look at how the price behaved after it finally conquered the 755.05 macro ceiling:
Flipping the Script: Once the price broke above 755.05, it didn't suffer a "bull trap" rejection. Instead, buyers ruthlessly defended that old resistance, flipping it into a rock-solid support floor.
The High-Level Consolidation: Using the 755.05 line as its new foundation, the stock chopped sideways, establishing a mid-level pivot at the dashed 771.65 line and a new temporary ceiling at 811.80. This tight, multi-week consolidation directly above a prior breakout is a textbook "Step-Up Base." It gracefully transfers shares from impatient retail traders taking quick profits over to strong-handed institutional buyers, storing immense kinetic energy for the next leg higher.
3. Current Price Action: Blue Sky Territory
Look at the most recent daily candles on the far right, accompanied by a massive surge in buying volume (visible on the bottom panel). The high-level pressure cooker has absolutely exploded. Buyers have effortlessly shattered the 811.80 ceiling with a massive momentum thrust, pushing the price straight into the 830 zone. By decisively clearing this final accumulation step, MARICO has officially entered "Blue Sky Territory" (pure price discovery). Historical overhead supply in this region has been entirely eliminated.
4. The Trade Plan: Entries, Targets, and Risk Management
Entry Strategy: Momentum is exceptionally strong right now near 830.00. Chasing a massive, near-vertical daily expansion candle always carries a higher risk of an immediate intraday drawdown as the stock naturally breathes. The highest-probability, lowest-risk entry involves placing limit orders to catch a potential minor structural pullback to perfectly retest the 810.00 to 815.00 breakout zone. Letting that old heavy resistance prove itself as a new, indestructible support floor offers a phenomenal risk-to-reward ratio.
Take Profit (Targets): Because the stock is in pure price discovery, we use measured structural targets based on the depth of the recent base. By taking the depth of the step-up base (roughly 55 points from the 755.05 floor to the 811.80 ceiling) and projecting it upward from the breakout line, our immediate structural macro target sits comfortably in the 865.00 to 870.00 zone. The ultimate psychological milestone is the massive 900.00 mark.
Invalidation (Stop Loss): A trade thesis is only valid if the new market structure holds. A hard stop loss should be placed safely below the breakout line and the dashed mid-level pivot, around the 765.00 to 770.00 level. A definitive daily close completely back below the foundational 755.05 line would act as a massive warning sign of a failed structural breakout.
5. Time Horizon:
Because this technical setup is built on a 1-Day chart capturing a Step-Up Base completion into fresh price discovery, this is a short-to-medium-term swing trade designed to capture the explosive markup phase. Let the new trend run!
 Long
Long
AZAD:MassiveAscending Triangle Breakout andTextbook Macro Retest1. The Macro Perspective: The Secular Trendline Defense
I am taking a LONG bias on Azad Engineering Limited (AZAD) on the weekly (1W) timeframe.
When analyzing pure market structure, the most powerful and sustainable breakouts occur in alignment with an established macro trend. Look at the massive structural development on this chart. The defining feature is the steep, unbroken ascending trendline (the lower solid black line) that has acted as an indestructible foundation since early 2024. Every single time the stock experienced a deep pullback, institutional buyers aggressively stepped in exactly at this dynamic support line. They refused to let the secular bull trend break, consistently printing higher lows and indicating massive, systemic accumulation over the long term.
2. The Educational Setup: The Squeeze and The Ceiling
To understand the sheer strength of this setup, look at how the price systematically squeezed historical resistance to form a textbook "Ascending Triangle":
The Concrete Ceiling: The stock's recovery was heavily capped by a formidable horizontal resistance line at 1,910.25. Sellers repeatedly defended this zone, creating a clear supply ceiling.
The High-Level Squeeze: Notice how the pullbacks became shallower over time, riding the ascending trendline and the 20 SMA (the middle blue line of your Bollinger Bands). By pressing up against the flat horizontal ceiling while simultaneously forming higher lows, the stock acted like the ultimate pressure cooker. It gracefully transferred shares from impatient retail traders to strong-handed institutional buyers, storing immense kinetic energy as the structure tightened.
3. Current Price Action: The Breakout and the Ultimate Confirmation
Look at the right side of the chart. That pressure cooker exploded a few weeks ago, shattering the 1,910.25 ceiling and soaring past the 2,106.50 dashed pivot into pure price discovery. But in technical analysis, a breakout is only half the battle. The most lucrative entries occur when a stock proves it can defend its newly claimed territory. Look at the current red weekly candles. After an explosive vertical run, the stock is taking a healthy, necessary breather. To amateur traders, massive red candles look like a failed rally. To structural traders, this is a textbook "Break and Retest." The stock is pulling back to digest its gains in the golden zone between 1,910 and 2,100. By holding its ground here, that old, heavy historical resistance is officially being flipped into a brand-new, indestructible structural launchpad.
4. The Trade Plan: Entries, Targets, and Risk Management
Entry Strategy: We are currently entering the "golden entry" zone. The highest-probability, lowest-risk entry involves stepping down to a daily timeframe to catch this structural pullback. Look for bullish reversal candles to form as the price works its way into the 1,900.00 to 2,050.00 support block. Buying the retest of a multi-month macro ceiling offers a phenomenal risk-to-reward ratio before the next momentum expansion.
Take Profit (Targets): Because the stock is breaking out of a massive macro structure into pure price discovery, we use measured targets based on the depth of the pattern. By taking a conservative depth of the ascending triangle and projecting it upward from the 1,910.25 breakout line, our primary structural macro target sits comfortably in the 2,800.00 to 3,000.00 zone over the coming months.
Invalidation (Stop Loss): A break-and-retest thesis is only valid if the new floor holds. A hard stop loss should be placed safely below the 1,910.25 breakout line and the rising 20 SMA, around the 1,600.00 to 1,700.00 level. A definitive weekly close completely back inside the triangle and breaking below the ascending trendline would invalidate the immediate continuation thesis and signal a severe macro bull trap.
5. Time Horizon:
Because this technical setup is built on a 1-Week chart capturing a massive structural phase transition and a textbook macro retest, this is a medium-to-longer-term position trade designed to capture the explosive new markup phase. Let the macro trend run!  Long
Long
 Long
Long
WELINV: The Ascending Pressure Cooker and Explosive Vertical Bre1. The Macro Perspective: The Aggressive Accumulation Trend
I am taking a LONG bias on Welspun Investments & Commercials Ltd. (WELINV) on the weekly (1W) timeframe.
When analyzing pure market structure, the steepness of a trendline tells you everything you need to know about institutional urgency. Look at the massive structural development on this chart. After recovering from its macro lows, the stock established a steep, unbroken ascending trendline. Every single time the price pulled back, heavy institutional capital aggressively stepped in at higher and higher prices. They refused to let the stock suffer a deep correction, indicating a massive, underlying accumulation phase.
2. The Educational Setup: The High-Level Squeeze
To understand the sheer strength of this current breakout, look at how the price systematically squeezed historical resistance to form a textbook "Ascending Triangle":
The Structural Floors: Notice how the stock used the dashed 1,316.50 line as a mid-level stepping stone. Once it broke above it, buyers defended it, establishing a higher high-level floor.
The Pressure Cooker Ceiling: The stock's markup phase was temporarily capped by a formidable horizontal resistance line at 1,509.05.
The Squeeze: By aggressively pressing up against the 1,509.05 horizontal ceiling while riding the ascending trendline, the stock acted like the ultimate pressure cooker. It systematically squeezed out early sellers and transferred shares to strong-handed buyers, storing immense kinetic energy for the final launch.
3. Current Price Action: Entering the Price Vacuum
Look at the most recent weekly candles on the far right. The high-level pressure cooker has absolutely exploded. Buyers have effortlessly shattered the 1,509.05 macro ceiling with a massive, near-vertical momentum thrust, pushing the price well into the 1,650 zone. By decisively clearing this massive high-level accumulation step, WELINV has officially entered "Blue Sky Territory" (pure price discovery). Historical overhead supply has been completely eliminated.
4. The Trade Plan: Entries, Targets, and Risk Management
Entry Strategy: Momentum is exceptionally strong right now near 1,652.40. Chasing a massive, vertical expansion candle on the weekly timeframe always carries a high risk of agonizing intraday drawdowns as the stock naturally breathes. The highest-probability, lowest-risk entry involves stepping down to a daily timeframe and waiting for the dust to settle. Look to place limit orders to catch a potential structural pullback to retest the 1,500.00 to 1,520.00 breakout zone. Letting that heavy historical resistance prove itself as a new, indestructible support floor offers a phenomenal risk-to-reward ratio.
Take Profit (Targets): Because the stock is in pure price discovery, we use measured structural targets based on the depth of the pattern. By taking the depth of the recent massive swing (roughly 600 points from the ~900 trendline origin to the 1,509.05 ceiling) and projecting it upward, our primary structural macro target sits comfortably in the 2,100.00 to 2,150.00 zone. Immediate psychological milestones are 1,800.00 and 2,000.00.
Invalidation (Stop Loss): A trade thesis is only valid if the new market structure holds. A hard stop loss should be placed safely below the breakout line and the dashed mid-level pivot, around the 1,280.00 to 1,300.00 level. A definitive weekly close completely back inside the triangle and breaking below the ascending trendline would invalidate the immediate continuation thesis and signal a severe macro bull trap.
5. Time Horizon:
Because this technical setup is built on a 1-Week chart capturing a massive structural phase transition and ascending triangle breakout, this is a medium-to-longer-term position trade designed to capture the explosive new markup phase. Let the new trend run!  Long
Long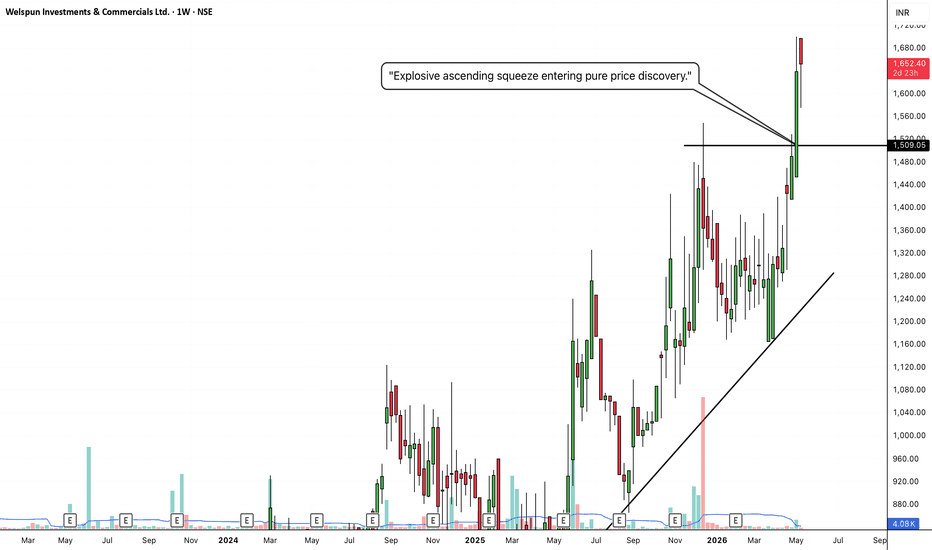
GRAPHITE: Multi-Year Ascending Triangle Breakout to Fill the Mac1. The Macro Perspective: The Boom, The Bust, and The Base
I am taking a LONG bias on Graphite India Limited (GRAPHITE) on the absolute macro monthly (1M) timeframe.
When analyzing pure market structure on a monthly chart, we are looking at the true footprints of heavy institutional capital playing out over years. Look at the massive structural development on this chart. In 2018, the stock established its ultimate historical ceiling at the solid red 883.50 line. What followed was a brutal, multi-year markdown phase that completely decimated weak hands. However, instead of bleeding into a permanent bear market, the stock found an absolute floor in 2020. For the last four years, the stock has been quietly carving out a massive accumulation phase, systematically grinding its way back up the chart.
2. The Educational Setup: The Ascending Pressure Cooker
To understand the sheer strength of this current breakout, look at how the price systematically squeezed historical resistance to form a textbook macro "Ascending Triangle":
The Dual Ceilings: The stock's recovery was heavily capped by a formidable dual-resistance zone consisting of the solid black lines at 662.90 and 698.50.
The Aggressive Trendline: Notice the defining feature of this right-side recovery: the steep, unbroken ascending trendline originating from the 2020 lows. Every time the stock pulled back from the black resistance lines, institutional buyers stepped in earlier and earlier, forming a beautiful sequence of higher lows.
The Squeeze: By aggressively pressing up against the horizontal ceilings while forming higher lows, the stock acted like the ultimate pressure cooker. It squeezed short-sellers and transferred millions of shares to strong-handed buyers, storing immense kinetic energy for the final launch.
3. Current Price Action: Entering the Price Vacuum
Look at the most recent monthly candle on the far right. The multi-year pressure cooker has absolutely exploded. Buyers have effortlessly shattered both the 662.90 and 698.50 macro ceilings with a massive, full-bodied green momentum thrust. By decisively clearing this multi-year accumulation zone, GRAPHITE has officially confirmed a secular trend shift. More importantly, it has entered a "Price Vacuum." Looking to the left, there is very little structural resistance between the current price and the ultimate red 883.50 level.
4. The Trade Plan: Entries, Targets, and Risk Management
Entry Strategy: Momentum is exceptionally strong right now near 731.30. Because this is a monthly breakout, chasing a massive vertical expansion candle on smaller timeframes carries a higher risk of agonizing drawdowns. The highest-probability, lowest-risk entry involves stepping down to a weekly or daily timeframe and waiting for the dust to settle. Look to place limit orders to catch a potential structural pullback to retest the 680.00 to 700.00 breakout zone. Letting those years of heavy resistance prove themselves as a new, indestructible support floor offers a phenomenal risk-to-reward ratio.
Take Profit (Targets): The primary macro target is undeniable: the massive red historical resistance line sitting at 883.50. The stock is attempting to complete a massive, multi-year round trip to fill that void.
Invalidation (Stop Loss): A macro trade thesis is only valid if the new market structure holds. A hard stop loss should be placed safely below the recent monthly accumulation and the ascending trendline, ideally near the dashed 550.85 mid-level pivot. A definitive monthly close completely back inside the old base and below 600.00 would invalidate the immediate continuation thesis and signal a severe macro bull trap.
5. Time Horizon:
Because this technical setup is built on a 1-Month chart capturing a massive, multi-year structural phase transition, this is a long-term position trade/investment designed to capture a secular markup phase that could play out over several quarters. Let the macro trend run!  Long
Long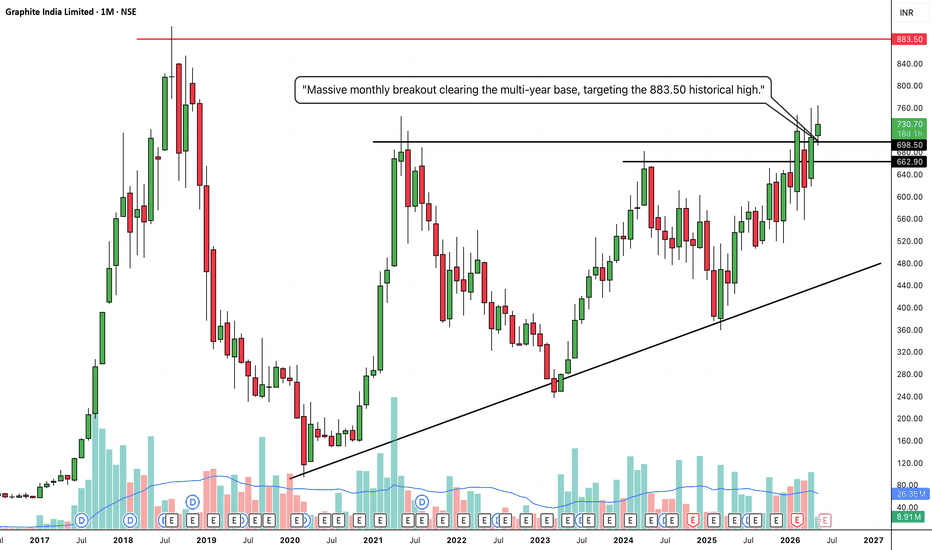
SHRIPISTON: Explosive Daily Triangle Breakout1. The Macro Perspective: The Structural Breakout
I am taking a LONG bias on SPR Auto Technologies Ltd (SHRIPISTON) on the daily (1D) timeframe. Over the past five months, following a dip early in the year, the stock entered a highly constructive digestion phase. By continuously printing higher lows against a fixed horizontal resistance, the stock carved out a high-precision ascending triangle pattern. This structure is a classic footprint of institutional accumulation; buyers were willing to step in at progressively higher prices, continuously coiling the spring before unleashing this recent highly aggressive markup phase.
2. The Educational Setup: Defining the Boundaries
To understand the technical validity behind this move, look closely at how the price structure interacted with its core boundaries:
The 3,757.10 Upper Resistance: The definitive ceiling for a bullish structural shift was the black horizontal resistance line marked strictly at 3,757.10. This level acted as a major supply zone that capped the prominent peaks in early April and late May.
The Ascending Support Trendline: Complementing the resistance was a firm upward-sloping trendline connecting the higher lows since February. This rising floor continuously compressed the price action against the 3,757.10 ceiling, building immense structural pressure.
3. Current Price Action: Breakout Confirmation and Continuation
The structural pressure cooker has officially exploded. Looking at the far right of the chart, buyers stepped in with overwhelming conviction a few sessions ago. The stock printed a powerful green expansion candle that decisively obliterated the 3,757.10 macro ceiling. It is currently showing excellent follow-through and continuation, trading exceptionally strong at 3,926.90. The stock has officially transitioned out of its multi-month accumulation pattern and into a highly explosive, momentum-driven markup trend.
4. The Trade Plan: Entries, Targets, and Risk Management
Entry Strategy: Momentum is currently established and strong. While chasing an extended daily move carries a risk of a short-term lower-timeframe mean-reversion pullback, the highest-probability entry strategy is to look to scale into long positions on a potential structural pullback to retest the broken 3,700.00 to 3,760.00 prior resistance zone. Letting old historical resistance prove itself as a concrete new support floor provides an unmatched risk-to-reward ratio.
Targets: By utilizing a classical measured move strategy based on the structural depth of the triangle base (measuring from the most recent major swing low near 3,200.00 up to the 3,757.10 ceiling), we project an initial expansion of roughly 550+ points. Projecting this upward from the breakout point, our primary short-term structural target sits comfortably in the 4,300.00 to 4,400.00 zone.
Risk Management: An explosive continuation breakout thesis is invalidated if the price fails to hold the breakout and collapses back deep inside the triangle pattern, breaking the ascending trendline. A hard stop loss should be placed safely below the recent minor swing consolidation structure just prior to the breakout, specifically around the 3,450.00 to 3,550.00 level.
5. Time Horizon:
Because this technical setup captures a highly explosive momentum breakout and a textbook ascending triangle completion on the 1-Day chart, this is a swing-to-position trade designed to capture a rapid, sustained markup phase. Trail your stop losses tightly as it runs!  Long
Long
UNP: Massive Macro Breakout From Multi-Year Ascending TriangleThe Setup (Bias): I am taking a LONG bias on Union Pacific Corporation (UNP) on the macro monthly (1M) timeframe.
The "Why" (Technical Reasons): 1. Ascending Triangle Breakout: The price has powerfully broken out of a massive, multi-year ascending triangle pattern. After years of buyers continually stepping in at higher prices (indicated by the rising lower trendline), they have finally overwhelmed the sellers and cleared the flat-top historical resistance at $252.27.
2. Macro Bullish Momentum: The breakout is confirmed by a strong, full-bodied monthly green candle. Breaking out of a structural pattern of this size on a monthly chart indicates a high probability of a sustained, long-term trend continuation.
Trade Plan (Entry & Exits): * Entry: Momentum and position traders can look for entries near the current market price of $268.70. A more conservative, lower-risk approach would be scaling in on a potential monthly pullback to retest the $252.27 breakout line, letting that old historic ceiling prove itself as a new floor.
Take Profit (Target): Based on the measured move of a triangle this large, the momentum can carry it significantly higher. The next major psychological target is the $300.00 milestone, followed by $320.00.
Stop Loss: Placed safely below the breakout line and the rising trendline support, around $230.00. A monthly close below this level would invalidate the ascending triangle structure.
Duration: Because this analysis is built on a massive 1-Month chart, this is a long-term position trade designed to play out over the coming months to years.  Long
Long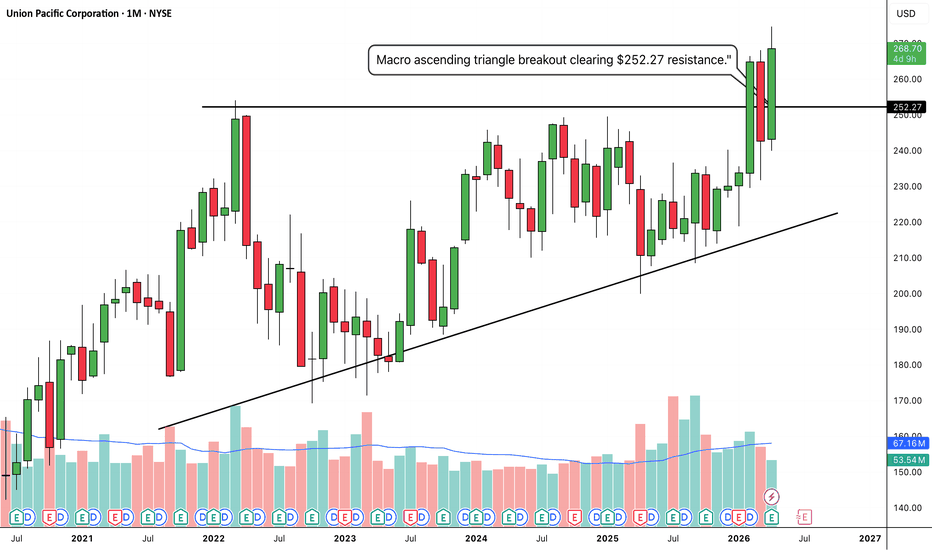
Nifty 50 Ready for a Big Move? Watch These Key LevelsNifty 50 is currently trading around 24,032 and has entered an important technical zone where the next directional move could determine the broader trend. The chart shows an Ascending Triangle Pattern, with rising support underneath price and a well-defined resistance zone around 24,500–24,800. This structure indicates that buyers are gradually pushing the market higher while sellers continue to defend the same resistance area.
The immediate focus is the 23,900–24,000 support region, where the ascending trendline is currently providing support. As long as Nifty holds this rising support, the broader setup remains constructive. The highlighted consolidation zone suggests that the index may continue moving within a range before attempting a decisive breakout.
🟢 Bullish Scenario
A sustained breakout above the 24,500–24,800 resistance zone would provide confirmation of the ascending triangle breakout. Once this resistance is convincingly cleared, momentum could accelerate toward 25,200, followed by the projected upside target of 26,800+.
The measured-move structure shown on the chart supports the possibility of a substantial upside expansion if the breakout is accompanied by strong momentum and participation.
🔴 Bearish Scenario
The bullish structure becomes vulnerable if Nifty decisively breaks below the 23,900–24,000 rising support zone. Such a breakdown would indicate that the ascending trendline has failed and could trigger further profit booking.
In that case, the chart projects a potential downside move toward 21,900. Therefore, the rising support remains the key level that bulls need to defend.
🟡 Consolidation Scenario
Between the major support and resistance zones, Nifty could remain range-bound. Traders may see opportunities to trade the consolidation, but a larger directional position would ideally wait for confirmation.
Key Levels:
Support: 23,900–24,000
Resistance: 24,500–24,800
Bullish Targets: 25,200 → 26,800+
Bearish Target: 21,900
Overall View: Nifty is at a crucial technical decision point. The Ascending Triangle remains bullish as long as the rising support holds, while a decisive breakout above resistance could unlock the next major upside move.  Long
Long
Bank Nifty Daily Chart Analysis: Ascending Triangle Formation
Pattern Overview
On the daily (1D) timeframe, the Bank Nifty index is currently consolidating within a classic Ascending Triangle pattern. This is generally considered a bullish continuation pattern, indicating a potential upward breakout after a period of consolidation.
Key Technical Observations:
Horizontal Resistance (Top Line): The upper trendline highlights a clear and stubborn resistance zone. The price has tested this ceiling multiple times but has faced consistent selling pressure, creating a flat top. This indicates a strong supply zone.
Ascending Support (Bottom Line): The lower trendline connects a series of higher lows. This is a strong bullish indicator, showing that buyers are stepping in at increasingly higher prices. The buying pressure is steadily building up, squeezing the price against the upper resistance.
Market Psychology:
The structure of this pattern reveals a tightening battle between buyers and sellers. While sellers are successfully defending the horizontal resistance, buyers are becoming more aggressive, refusing to let the price drop to previous lows. This upward pressure narrows the trading range and compresses volatility as the price approaches the apex of the triangle.
What to Watch For (Potential Scenarios):
Bullish Breakout: A decisive daily candle close above the horizontal resistance line, ideally accompanied by high volume, would confirm the breakout. This would signal that buyers have finally absorbed the supply, potentially leading to a sharp upward rally.
Pattern Invalidation: If the price faces rejection at the resistance and breaks below the ascending support line, the bullish setup becomes invalid. This could trigger a short-term correction or further sideways momentum.
Conclusion:
The index is currently in a tight squeeze, preparing for its next major move. Traders should watch closely for a high-volume breakout above the resistance zone before taking aggressive long positions, while maintaining strict risk management below the ascending trendline.
(Disclaimer: This analysis is for educational purposes only and does not constitute financial advice. Always perform your own due diligence before trading.)
 Long
Long
AUROPHARMA Ascending Triangle Breakout📊 Aurobindo Pharma Ltd.: Daily Technical Snapshot – Ascending Triangle Breakout
📊 STWP Technical Analysis
________________________________________
MARKET STRUCTURE SNAPSHOT | NSE: AUROPHARMA | DAILY
Closing Price: 1,658.00 (+69.10 | +4.35%)
Core Trend: Uptrend
Market State: Ascending Triangle Breakout
Price Structure: Price has broken above the horizontal resistance zone of an Ascending Triangle, supported by a rising trendline, strong bullish candle and above-average volume. The breakout indicates an attempt to move into a higher trading range.
________________________________________
OPERATIONAL PRICE GRID & KEY REFERENCE LEVELS
Model Reference Level: 1,662.40
Hard Invalidation Level: 1,564.80
Structural Risk: 97.60 (5.87%)
Resistance Levels: R1 1,686.97 | R2 1,715.93 | R3 1,769.47
Support Levels: S1 1,604.47 | S2 1,550.93 | S3 1,521.97
Range Structure: Low 1,416.10 | High 1,769.47
Higher Timeframe Observation Zones: 1,716 | 1,769 | 1,850
________________________________________
MOMENTUM, PARTICIPATION & CPR DATA
Volume Profile: 2.00 Million Shares
Volume Character: High Relative Participation
Current Bias: BREAKOUT CONFIRMATION / BUY ON PULLBACKS
CPR State: Bullish Zone | CPR Sideways (Wide)
Today's CPR: Pivot 1,602.50 | Top 1,595.70 | Base 1,609.30
Tomorrow's CPR (Projected): Pivot 1,633.40 | Top 1,645.70 | Base 1,621.20
________________________________________
💡 STWP QUICK READ
Price has broken above an Ascending Triangle resistance.
Strong volume supports the breakout.
Buyers remain in control above the breakout zone.
Momentum remains firmly bullish, though extended.
Watch for sustained acceptance above the breakout area.
________________________________________
📚 EDUCATIONAL OBSERVATION
Aurobindo Pharma has delivered a notable Ascending Triangle breakout after several weeks of price compression. The pattern developed through a series of higher lows while price repeatedly encountered resistance around the same horizontal zone. This combination reflected increasing buying pressure as buyers gradually accepted higher prices.
The latest session has pushed price decisively above the upper boundary of the formation, accompanied by a strong bullish candle and increased participation. This gives the breakout greater technical significance compared with a move occurring on weak volume.
The overall technical picture suggests that buyers are attempting to establish a new higher trading range.
Momentum remains constructive. RSI at 65.27 indicates strong bullish momentum, while ADX at 27.03 suggests that the developing trend has meaningful strength. ROC at +8.22% confirms positive price acceleration, while the CCI at +233.75 reflects strong buying pressure. The Stochastic at 97.07 shows highly extended momentum, which means short-term consolidation or pullbacks remain possible even while the broader structure remains bullish.
Volume expanded to 2.00 million shares, approximately double the 20-day average of 1.00 million shares, representing a participation ratio of around 2.00x. Such above-average volume indicates increased market participation and adds credibility to the Ascending Triangle breakout.
The projected Central Pivot Range (CPR) has shifted higher, with tomorrow's Pivot at 1,633.40 and the projected CPR extending from 1,621.20 to 1,645.70. The upward shift in CPR supports the improving price structure, although sustained acceptance above the breakout zone remains important.
Immediate attention remains on 1,686.97 and 1,715.93, followed by 1,769.47 as the next major resistance zone. Sustained trading above the breakout area could strengthen the developing trend and bring higher-timeframe observation zones into focus. On the downside, 1,604.47 becomes the first important support, while 1,564.80 remains the structural invalidation level.
________________________________________
🏢 BUSINESS & FUNDAMENTAL UPDATE
Aurobindo Pharma remains a major Indian pharmaceutical company with a strong presence across generic medicines, active pharmaceutical ingredients (APIs), specialty products and international markets. Its diversified product portfolio, manufacturing capabilities and global presence provide a constructive long-term business backdrop. Continued focus on complex generics, specialty pharmaceuticals and international expansion remains important to the company's growth trajectory. Aurobindo Pharma delivered a strong Q1 FY27, with consolidated revenue rising approximately 16% YoY to 9,150 crore and net profit increasing 25.2% YoY to 1,032 crore. EBITDA grew around 20%, with the EBITDA margin improving to approximately 21%. The performance was supported by broad-based growth, particularly across its Europe and US businesses. Management also maintained a double-digit revenue growth outlook for FY27, while continuing investments in biosimilars and specialty products. The strong quarterly performance provides a constructive fundamental backdrop to the stock's current technical breakout.
________________________________________
📖 Educational Note
The Ascending Triangle generally develops when price repeatedly encounters resistance at a similar level while successive lows move higher. This reflects increasing demand and compression between buyers and sellers. However, the pattern becomes more meaningful when the breakout is accompanied by strong participation and sustained price acceptance above resistance. Support and resistance levels should be treated as observation zones rather than predictive targets. Chart patterns, price action, momentum indicators, volume analysis and CPR are educational tools that help market participants understand evolving market structure within a disciplined risk-management framework.
________________________________________
⚠️ Disclaimer
This analysis is provided strictly for educational and informational purposes.
This is not financial, investment or trading advice and should not be considered a recommendation to buy or sell any security.
Stock market investments are subject to market risks, including the possible loss of capital.
Past performance, historical observations, chart patterns and technical indicators do not guarantee future results.
Please conduct your own research and consult a SEBI-registered investment adviser before making investment decisions.
STWP assumes no responsibility or liability for any financial loss arising directly or indirectly from the use of this information.
 Long
Long
 Long
Long
SRF Ascending Triangle Breakout (Possible)________________________________________
📊 SRF: Daily Technical Snapshot – Ascending Triangle Breakout (Possible)
📊 STWP Technical Analysis
________________________________________
MARKET STRUCTURE SNAPSHOT | NSE: SRF | DAILY
Closing Price: ₹2,889.30 (+₹113.70 | +4.10%)
Core Trend: Strong Uptrend
Market State: Confirmed Breakout in Progress
Price Structure: Price has broken above an Ascending Triangle, supported by a strong bullish candle and exceptionally high trading volume. The breakout reflects increasing buying pressure following a period of consolidation.
________________________________________
OPERATIONAL PRICE GRID & KEY REFERENCE LEVELS
Model Reference Level: ₹2,916.00
Hard Invalidation Level: ₹2,606.80
Structural Risk: ₹309.20 (10.60%)
Resistance Levels: R1 ₹2,944.50 | R2 ₹2,999.70 | R3 ₹3,083.40
Support Levels: S1 ₹2,805.60 | S2 ₹2,721.90 | S3 ₹2,666.70
Range Structure: Low ₹2,606.80 | High ₹3,083.40
Higher Timeframe Observation Zones: ₹3,000 | ₹3,083 | ₹3,150
________________________________________
MOMENTUM, PARTICIPATION & CPR DATA
Volume Profile: 1.53 Million Shares
Volume Character: Extremely High Relative Participation
RSI: 63.62 (Strong Momentum Zone)
ADX: 10.48 (Early Trend Development)
ROC: +3.21%
MACD Status: Fresh Bullish Crossover
CCI: +198.29 (Strong Bullish Momentum)
Stochastic Reading: 90.01 (Extended Momentum Zone)
Current Bias: BUY ON PULLBACKS
CPR State: Bullish Zone | CPR Moving Up (Narrow)
Today's CPR: Pivot ₹2,777.55 | Top ₹2,776.55 | Base ₹2,778.50
Tomorrow's CPR (Projected): Pivot ₹2,860.80 | Top ₹2,875.05 | Base ₹2,846.55
________________________________________
📚 EDUCATIONAL OBSERVATION
SRF has confirmed a breakout from an Ascending Triangle, a bullish continuation pattern that often develops during an established uptrend. The pattern is characterised by a series of higher lows, indicating increasing buyer aggression, while repeated tests of a relatively flat resistance level gradually absorb selling pressure. The eventual breakout above resistance suggests that buyers have gained control and that the prior uptrend may be ready to resume.
The latest breakout is supported by a strong bullish candle, exceptionally high trading volume and expanding momentum, reflecting broad market participation. Increased volume during a triangle breakout generally strengthens the reliability of the move, as it indicates that the breakout is supported by genuine buying interest rather than low-volume price fluctuations.
Momentum indicators continue to remain constructive. The RSI at 63.62 reflects healthy bullish momentum without reaching extreme overbought territory. MACD has generated a fresh bullish crossover, signalling improving trend strength, while the ROC of +3.21% indicates continued upside acceleration. The CCI reading of +198.29 confirms strong buying momentum, and the Stochastic reading of 90.01 reflects sustained participation, although elevated momentum readings may occasionally lead to short-term consolidations.
The projected Central Pivot Range (CPR) for the next trading session has shifted higher, with the projected Pivot at ₹2,860.80. A rising CPR generally indicates improving market acceptance of higher prices and often supports trend continuation when accompanied by strong participation. The dashboard therefore continues to maintain a Buy on Pullbacks approach rather than chasing prices after a sharp advance.
The immediate technical focus remains on the resistance zone between ₹2,945 and ₹3,000. Sustained trading above this region could reinforce the breakout and bring the higher-timeframe observation zones near ₹3,083 and ₹3,150 into focus. On the downside, ₹2,806 remains the first important support, while the structural invalidation level is positioned near ₹2,607.
________________________________________
🏢 BUSINESS OVERVIEW
SRF Limited is a diversified chemicals and manufacturing company with businesses spanning specialty chemicals, fluorochemicals, packaging films and technical textiles. The company continues to benefit from increasing global demand for specialty chemicals, expanding export opportunities and ongoing capacity additions across its high-margin businesses. Its diversified product portfolio and focus on innovation provide a constructive long-term business outlook.
________________________________________
📖 Educational Note
Support and resistance levels should be treated as observation zones rather than predictive targets. Chart patterns, price action, volume analysis, momentum indicators and CPR are educational tools that help market participants understand evolving market structure within a disciplined risk-management framework.
________________________________________
⚠️ Disclaimer
This analysis is provided strictly for educational and informational purposes.
It does not constitute financial, investment or trading advice and should not be interpreted as a recommendation to buy or sell any security.
Investments in the stock market are subject to market risks, including the possible loss of capital.
Historical performance, chart patterns and technical indicators do not guarantee future results.
Please conduct your own research and consult a SEBI-registered investment adviser before making investment decisions.
STWP assumes no responsibility or liability for any financial loss arising directly or indirectly from the use of this analysis.
 Long
Long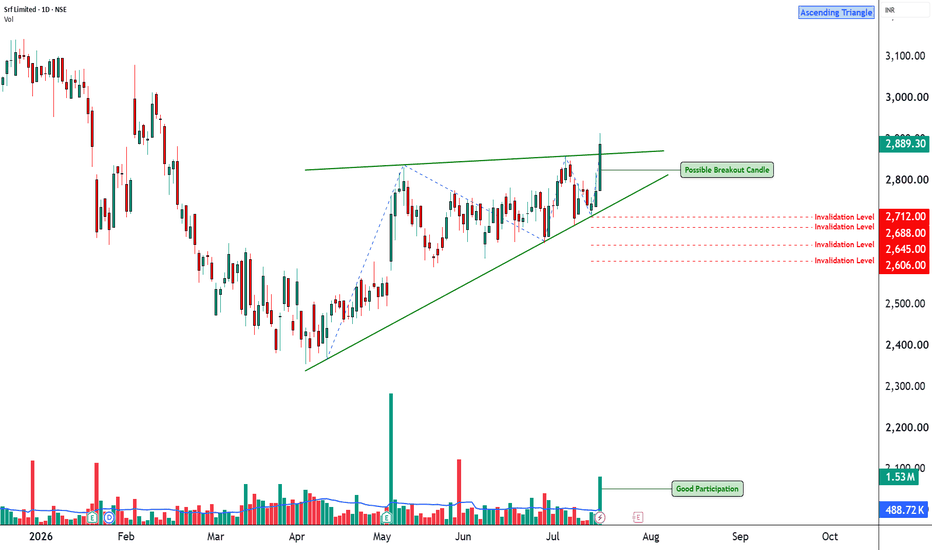
 Long
Long
AMBER ENTERPRISES | Positional Trade SetupTechnical View
AMBER is trading within a well-defined Ascending Triangle, supported by a series of higher lows and a strong horizontal resistance zone. The price has repeatedly respected the rising support trendline, indicating sustained buying interest despite short-term corrections.
The current consolidation appears constructive. A decisive breakout above the resistance zone may trigger the next leg of the uptrend.
Trade Setup
CMP: ₹7,484
Add on Dips: Around ₹7,200
Stop Loss (Closing Basis): ₹6,989
Target Levels
🎯 Target 1: ₹8,228
🎯 Target 2: ₹8,666
🎯 Target 3: ₹8,888
🎯 Target 4: ₹9,111
🎯 Target 5: ₹9,333
🎯 Target 6: ₹9,666
Trading Strategy
* Fresh positions may be considered around the current market price.
* Additional accumulation may be considered near ₹7,200 if the stock witnesses healthy corrective moves.
* Maintain a strict Closing Basis Stop Loss at ₹6,989.
* Consider partial profit booking at successive targets while trailing the stop loss (TSL) to protect gains.
Technical Highlight
* Pattern: Ascending Triangle
* Trend: Bullish
* Support: Rising Trendline
* Resistance: ₹8,228 Zone
* Time Horizon: Positional (Medium Term)
Disclosure: This technical view is based on price action and chart analysis. The analysis reflects the current market structure and is subject to change based on evolving market conditions. There are no guaranteed returns in the stock market. Investors should assess their risk profile and follow appropriate risk management before making any investment decisions.
 Long
Long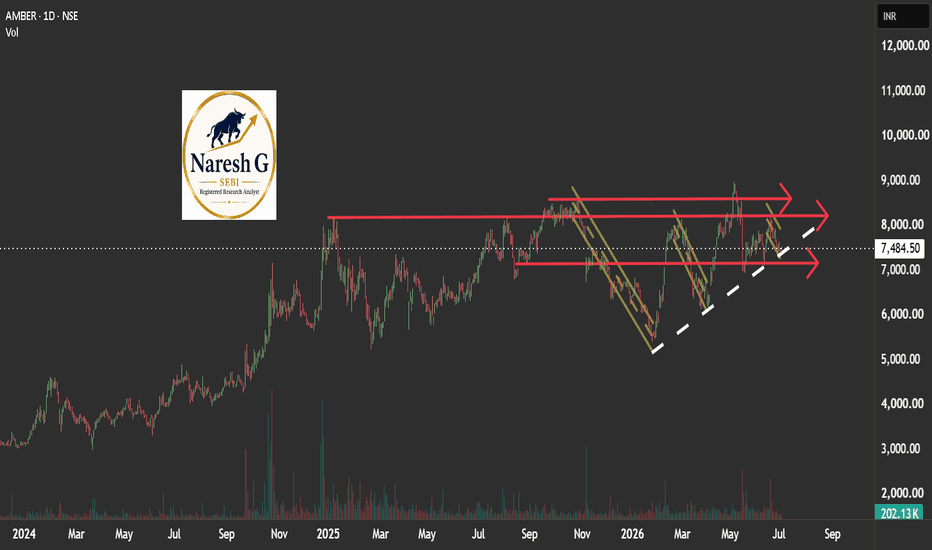
DR REDDY'S | Ascending Triangle — Watch ₹1,415 BreakoutOverview
Dr. Reddy's Laboratories — one of India's leading pharmaceutical companies — is forming a well-defined Ascending Triangle on the Daily chart. Today's strong +2.11% session pushed price to ₹1,390, approaching the key resistance at ₹1,415, before closing at ₹1,374. The triangle structure remains intact and the breakout zone is approaching.
The Ascending Triangle
An Ascending Triangle forms when price makes higher lows (rising trendline below) while repeatedly testing a flat horizontal resistance above. This pattern signals accumulation — buyers are consistently stepping in at higher levels, pushing price toward the resistance ceiling.
Upper Boundary: Flat resistance at ₹1,415 — tested multiple times since 2024. Sellers have defended this level consistently. This is the key breakout trigger.
Lower Boundary: Rising trendline support connecting the lows from April 2025 through February 2026 — confirming buyers are making higher lows over time.
Today's Price Action — Why This Setup is Timely
Today's +2.11% session saw Dr. Reddy's rally to ₹1,390 — approaching but not yet breaking the ₹1,415 resistance. Price closed at ₹1,374, consolidating within the triangle structure. The ascending triangle remains fully intact.
The stock is in the compression zone — the narrowing space between rising support and flat resistance — where the next directional move is building energy.
The EMA Context
📈 50 EMA at ₹1,300 — price trading well above, confirming medium-term bullish momentum.
📈 200 EMA at ₹1,273 — price above the 200 EMA, confirming the long-term trend remains bullish.
Both EMAs are positioned as support layers below — adding depth to the bullish structure.
Key Levels
🔴 Triangle Upper Resistance — 1,415 (breakout trigger)
🟡 Current Price — 1,374 (inside triangle)
🟢 50 EMA Support — 1,300
🟢 200 EMA Support — 1,273
🟢 Rising Trendline Support — dynamic, rising from April 2025 lows
🎯 Measured Move Target — 1,820 (triangle height ₹400 projected from breakout at 1,415)
🔴 Invalidation — close below rising trendline
Two Scenarios
🟢 Scenario A — Breakout Confirms
Price breaks above ₹1,415 on a daily close with good volume. This confirms the Ascending Triangle breakout. First interim target is ₹1,600+, with a measured move target of ₹1,820 (triangle height of ~₹400 projected upward from the breakout level).
🔴 Scenario B — Resistance Holds, Pullback
Price fails to break above ₹1,415 and pulls back toward the rising trendline support. The triangle structure remains valid as long as price holds above the rising trendline. A close below the trendline would invalidate the pattern — watch the 50 EMA at ₹1,300 as the next support.
Beginner's Lesson — What is an Ascending Triangle?
An Ascending Triangle tells a story of shifting power from sellers to buyers:
The flat resistance shows sellers defending the same price level repeatedly
The rising trendline shows buyers becoming more aggressive — unwilling to wait for lower prices
As the two lines converge, pressure builds inside the pattern
Eventually buyers overwhelm sellers — and the breakout happens
The key insight: the pattern is bullish not because of the breakout, but because of the higher lows forming before it. Each higher low is a sign buyers are getting stronger.
Always wait for a confirmed daily close above ₹1,415 before acting — not just an intraday breach.
Conclusion
Dr. Reddy's is forming a clean Ascending Triangle on the Daily chart. The upper resistance at ₹1,415 is the key level — multiple tests, multiple rejections. But the rising trendline below shows buyers getting stronger with each pullback.
Watch for a daily close above ₹1,415 with volume — that is the confirmation signal.
For educational purposes only. Not financial advice. Always manage your risk.  Long
Long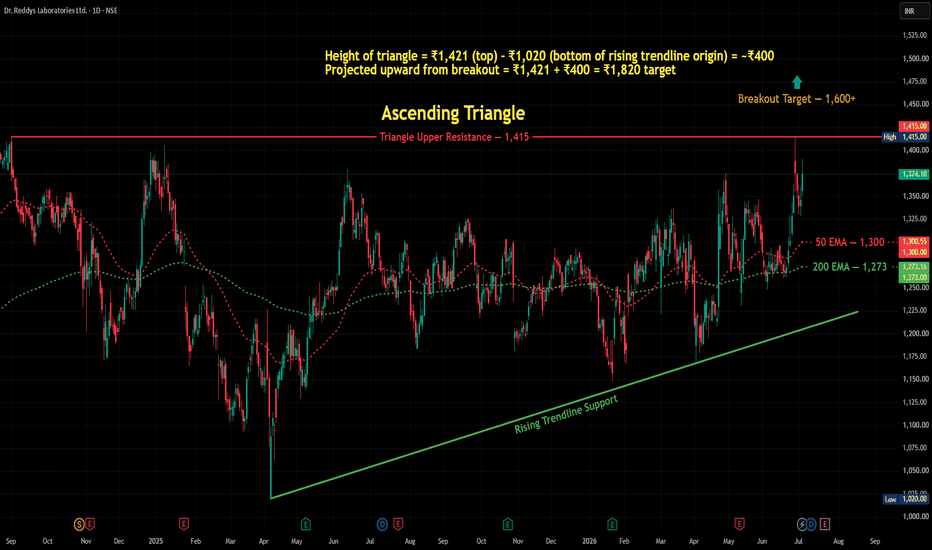
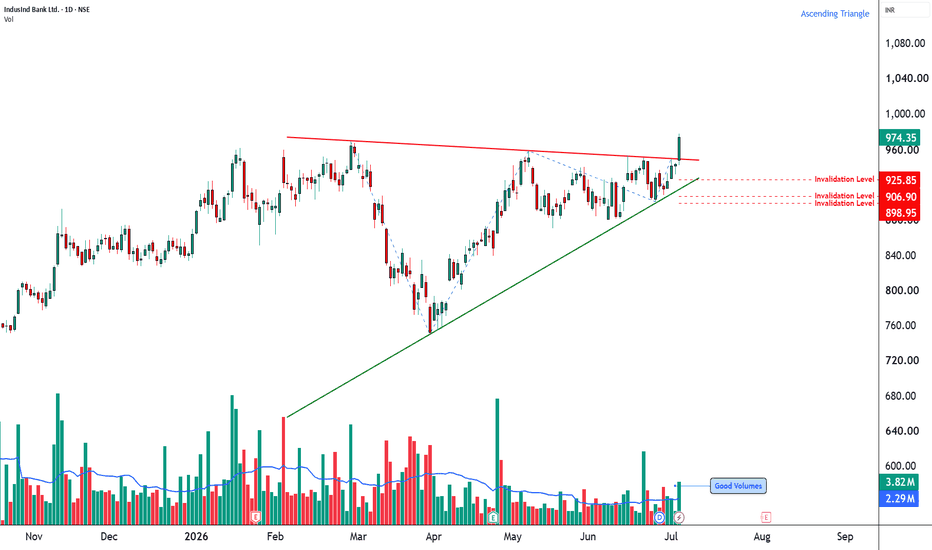
INDUSINDBK Ascending Triangle Breakout & 52-Week High📊 IndusInd Bank: Daily Technical Snapshot – Ascending Triangle Breakout & 52-Week High
📊 STWP Technical Analysis
________________________________________
MARKET STRUCTURE SNAPSHOT | NSE: INDUSINDBK | DAILY
Closing Price: 974.35 (+30.85 | +3.27%)
Core Trend: Strong Uptrend
Market State: Confirmed Breakout in Progress
Price Structure: Price has broken above an Ascending Triangle and is trading near a fresh 52-week high, indicating continued bullish strength.
________________________________________
OPERATIONAL PRICE GRID & KEY REFERENCE LEVELS
Model Reference Level: 978.40
Hard Invalidation Level: 879.45
Structural Risk: 98.95 (10.11%)
Resistance Levels: R1 987.80 | R2 1,001.25 | R3 1,024.10
Support Levels: S1 951.50 | S2 928.65 | S3 915.20
Range Structure: Immediate Trading Range 879.45 – 1,024.10
Higher Timeframe Observation: Sustained acceptance above 988–1,001 may strengthen the trend towards the 1,024 region.
________________________________________
MOMENTUM, PARTICIPATION & CPR DATA
Volume Profile: 3.82 Million Shares
Volume Character: High Relative Participation
RSI: 64.59 (Strong Momentum Zone)
ADX: 21.61 (Trend Development Phase)
ROC: +3.79%
MACD: Strong Positive Momentum Structure
CCI: +128.27 (Strong Bullish Momentum)
Stochastic: 94.82 (Extended Momentum Zone)
Current Bias: BUY ON PULLBACKS
CPR State: Bullish Zone | Wide Projected CPR
Today's CPR: Pivot 940.00 | Top 941.75 | Base 938.25
Tomorrow's Projected CPR: Pivot 964.95 | Top 969.65 | Base 960.25
________________________________________
📚 EDUCATIONAL OBSERVATION
IndusInd Bank has delivered a strong bullish breakout by moving above an Ascending Triangle, a continuation pattern that typically reflects sustained buying interest after a period of consolidation. The breakout is further reinforced by a move towards a fresh 52-week high, indicating improving market sentiment and strengthening price structure.
The pattern is characterised by a series of higher lows, reflecting increasing buyer aggression, while repeated tests of the horizontal resistance eventually resulted in a decisive breakout. Such formations often indicate that demand has gradually absorbed available supply before prices expand higher.
Several technical factors are currently aligned in support of the prevailing trend:
Ascending Triangle Breakout
52-Week Breakout
Strong Bullish Candle
RSI Breakout
Bollinger Band Expansion
Strong Price-Volume Confirmation
Buyers' Dominance
Relative Strength Outperforming NIFTY
Momentum indicators continue to paint a constructive picture. The RSI at 64.59 reflects healthy bullish momentum without entering an extreme overbought condition. MACD remains firmly positive, while ADX at 21.61 suggests that the emerging trend is gaining strength. CCI at +128.27 highlights strong upside momentum, and the Stochastic reading of 94.82 confirms sustained buying pressure, although it also indicates that short-term pullbacks remain possible following a sharp advance.
The projected Central Pivot Range (CPR) for the next trading session has shifted higher, with the Pivot projected at 964.95. A rising and wide CPR generally indicates improving market acceptance of higher prices and often supports trend continuation when accompanied by healthy participation.
Immediate attention remains focused on the resistance zone between 988 and 1,001. A sustained move above this region could strengthen the existing bullish structure and bring the 1,024 area into focus for future market structure analysis. On the downside, 951.50 serves as the first important support, while the structural invalidation level remains at 879.45.
From a business perspective, IndusInd Bank is one of India's leading private sector banks, offering retail banking, corporate banking, vehicle finance, microfinance, treasury operations and digital banking services. Continued improvement in asset quality, steady credit growth and increasing digital adoption remain supportive factors for the bank's long-term business outlook.
Support and resistance levels should be viewed as observation zones rather than predictive targets. Chart patterns, price action, volume analysis, momentum indicators and CPR are educational tools intended to help market participants understand evolving market structure within a disciplined risk-management framework.
________________________________________
⚠️ Disclaimer
This analysis is provided strictly for educational and informational purposes.
It does not constitute financial, investment or trading advice and should not be interpreted as a recommendation to buy or sell any security.
Investments in the stock market are subject to market risks, including the possible loss of capital.
Historical performance, chart patterns and technical indicators do not guarantee future results.
Please conduct your own research and consult a SEBI-registered investment adviser before making investment decisions.
STWP assumes no responsibility or liability for any financial loss arising directly or indirectly from the use of this analysis.
 Long
Long