XAUUSD — Bullish Wave 5 Setup From Buy FVGXAUUSD — Bullish Wave 5 Setup From Buy FVG
Gold is starting to build a bullish recovery structure after defending the lower area near 4,570–4,580. From Kelly’s view, the current chart suggests that XAUUSD may be forming a new Elliott Wave upside sequence, with the latest pullback acting as wave (2) before price attempts to continue higher into wave (3), wave (4), and finally wave (5).
The key idea is simple: if gold continues to hold above the Buy FVG zone, the bullish structure remains valid
Bill Williams Indicators
15-minute Nifty 50 chart | August 27, 2026Based on your 15-minute Nifty 50 chart for today (August 27, 2026), here is a breakdown of the key intraday levels and zones to structure
Immediate Trading Zone
Current Price Action: Nifty opened with a sharp drop, testing the immediate support zone after a strong upward push on August 26.
Immediate Resistance (Supply Zone): 24,206.10 – 24,218.90
Context: The price is currently reacting just below this band. A sustained move above 24,220 is required to regain short-term bullish momentum.
I
NIFTY is heading towards important demand zone!As we can see NIFTY had been weak throughout the day but we can see it approaching a very important demand zone which is 24000 level which is also a psychological level. Hence, despite the weakness and volatility, we cannot expect NIFTY to fall unidirectionally unless NIFTY manages to close below this important zone. SO plan your trades accordingly and keep watching everyone
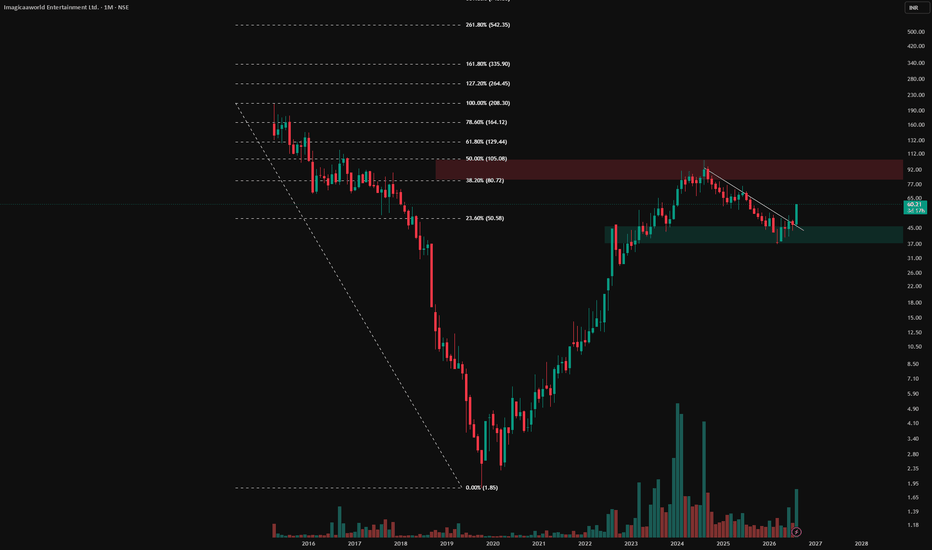
Flipping the Fibonacci ( Concept and Price action ) This post is educational and observational in nature based on historical price action. It is not a forecast or a trading recommendation.
The Reverse Fibonacci Approach
In a typical Fibonacci retracement, the swing low is anchored as the zero point and the swing high as the one point, measuring a retracement within an upward move. In this chart, that logic has been reversed. Since this stock is in a downtrend, the swing high has been anchored as the zero point and the swing low as the one poi
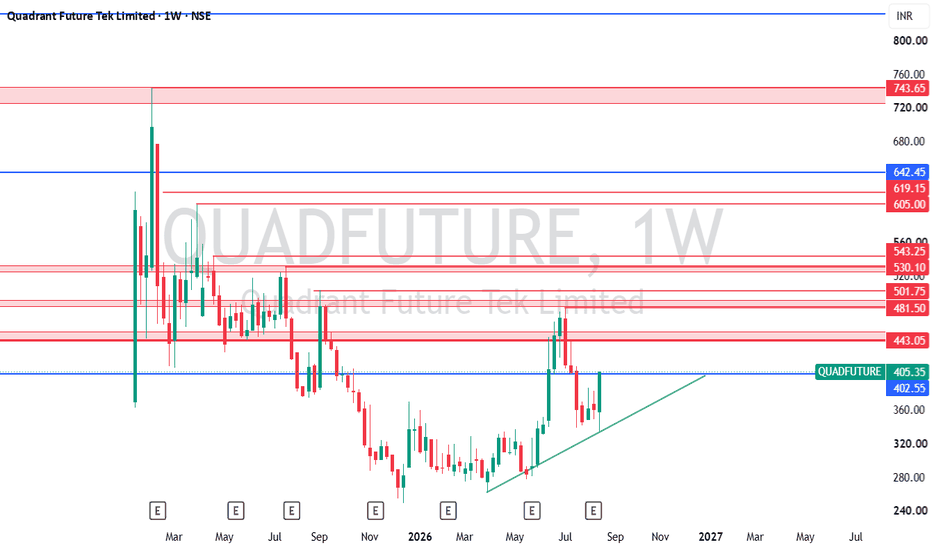
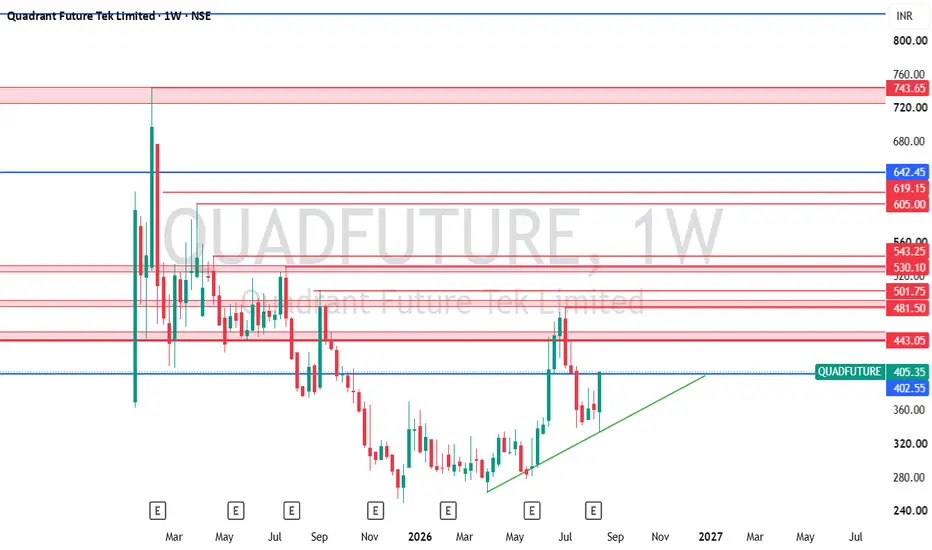
QUADFUTURE (Weekly Chart): Bullish Momentum🚀 QUADFUTURE (Weekly Chart): Bullish Momentum — Waiting for Retest/Pull-back Entry
Trade Thesis:
Following a sharp consolidation phase, NSE:QUADFUTURE has displayed a decisive bullish reversal, honoring its long-term ascending trendline. The stock locked in a 20% upper circuit backed by exceptional institutional volume (7.50M vs 30D average of ~558K). To avoid chasing fixed circuit limits, the strategy relies strictly on a pull-back or breakout consolidation entry.
Technical Parameters
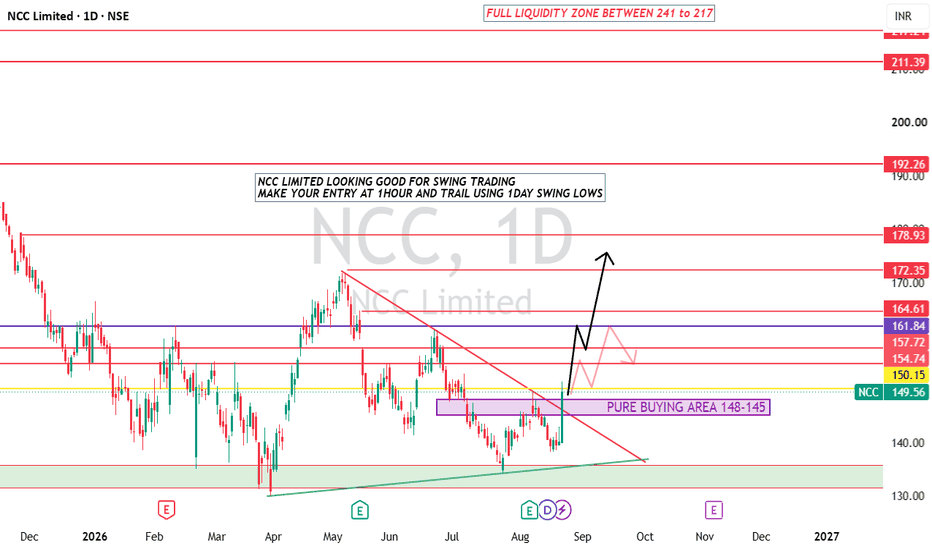
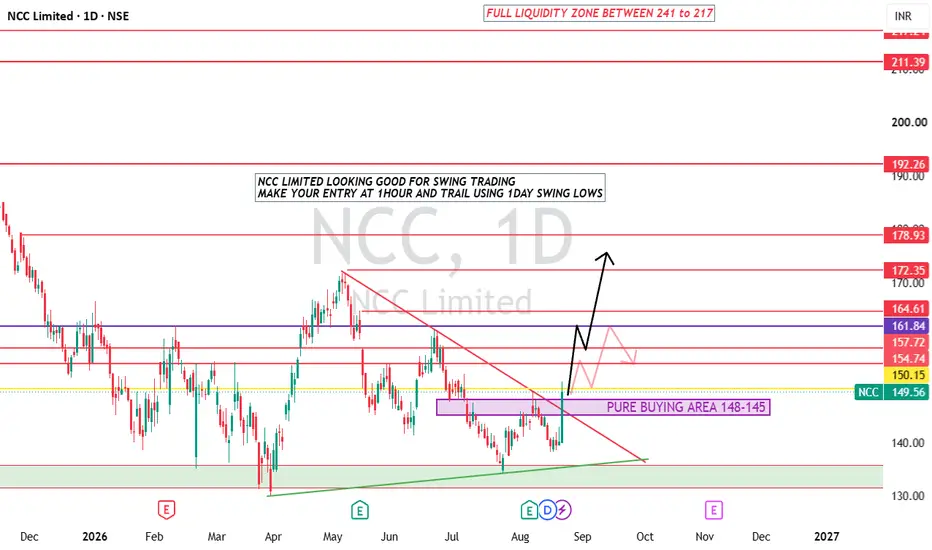
NCC (1D Chart): Bullish Swing Trade SetupNSE:NCC has broken out of a descending wedge continuation pattern on the daily chart. After forming a clear higher-low structure off the major ascending trendline, the stock confirmed strong demand with a +6.78% single-day impulse move. The price is expanding cleanly from the ₹145 – ₹148 demand zone.
Technical Parameters
Current Market Price: ₹149.56 (+6.78%)
Primary Accumulation Zone: ₹145.00 – ₹148.00 (Demand Floor / Value Area)
Immediate Support / Invalidated Below: ₹140.00 (Daily
IDBI Bank Limited (1D NSE): Swing Trade AnalysisIDBI Bank is coming out of a prolonged multi-week consolidation box on the daily chart, supported by a long-term ascending trendline. A strong bullish candle is testing the overhead horizontal resistance zone near 91.00 – 92.00, indicating potential for a fresh swing expansion.
Key Technical Levels
Breakout Trigger: Above 91.00 (Needs a daily candle close above resistance to confirm breakout)
Immediate Support Base: 84.00 – 82.00 (Top of the lower trendline support channel)
Invalidati
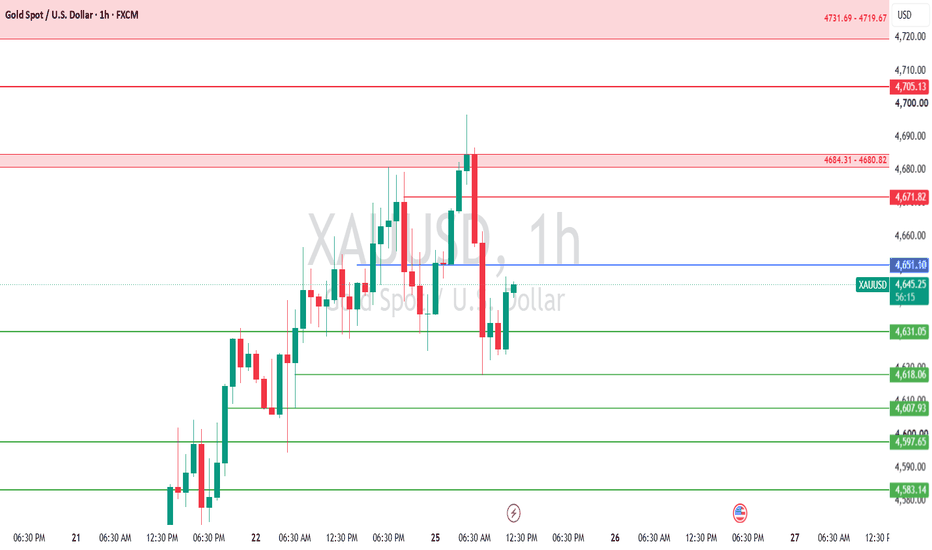
XAUUSD 1H Analysis: Key Support Hold & Liquidity Grab Below ResiMarket Context
Gold (XAUUSD) on the 1-hour timeframe is currently consolidating around 4,643, recovering from a quick liquidity sweep down toward the 4,631 support area. Prior bullish momentum saw price reject strongly near the 4,680–4,684 resistance zone.
Technical Breakdown
Resistance Zones : Major resistance sits at 4,680.82 – 4,684.31, followed by higher targets at 4,705.13 and 4,671.82 acting as intermediary pivot levels.
Support Levels: Immediate support is holding well at 4,631.0
Nifty Intraday Analysis for 27th August 2026NSE:NIFTY
The index is in the 24200 - 24500 range and a trend is expected to be formed if the index breaks and sustains either side of the range.
The upward movement may lead to 24400 – 24450 resistance range and if the index crosses and sustains above this level then may reach near 24650 – 24700 range.
On the contrary, The downward moment may drag the Index to 24000 – 23950 support range in downward momentum and if this support is broken then index may tank near 23750 – 23700 range.
Banknifty Intraday Analysis for 27th August 2026NSE:BANKNIFTY
Highest Calla and Put OI is at 57500 strike which will act as support in near term and Index is expected to continue uptrend.
The upward moment may lead the Index to 58500 – 58600 resistance range in upward momentum and if the index crosses and sustains above this level then may reach near 59200 – 59300 range.
On the contrary, The downward moment may drag the Index to 57100 – 57000 support range in downward momentum and if this support is broken then the index may tank near t
Finnifty Intraday Analysis for 27th August 2026NSE:CNXFINANCE
Index is near support range and if Index breaks and sustains 26500 level then uptrend is expected to continue.
The upward movement may lead the Index to 26650 - 26700 resistance range and if the index crosses and sustains above this level then may reach near 26950 - 27000 range.
On the contrary, The downward moment may drag the to 26150 – 26100 support range and if this support too is broken then index may tank near 25850 – 25800 range.
Midnifty Intraday Analysis for 27th August 2026NSE:NIFTY_MID_SELECT
Index has resistance at 15000 strike and uptrend will be formed only if index breaks and sustains 15000 decisively.
The upward movement may lead the Index near 15100 – 15125 resistance range and if the index crosses and sustains above this level then may reach 15275 – 15300 range.
On the contrary, The downward moment may drag the index to 14800 – 14775 support range and if this support is broken then index may tank near 14625 – 14600 range.
ANF : Major breakout after quarterly resultsANF has broken the resistance at 130 with good volume of 17M with a jump of 35% after the quarterly results on 26th August. A 'W' like pattern has formed and stock price is placed above the middle spike of 'W'.
Earlier ANF Tried to break the resistance in January 2026 but could not succeed.
Major Support
ANF took support three times near 69.23.
RSI Divergence : Bullish RSI Divergence is visible on the chart between 10th April '26 to 26th May'26. After that price has shown a good bullish r
XAUUSD — Bearish Structure Below 4,600XAUUSD — Bearish Structure Below 4,600
Gold is starting to lose upside momentum after rejecting from the upper side of the rising channel. From this chart, the latest rebound still looks corrective, which keeps the short-term bias tilted to the downside and supports the idea of one more bearish leg.
⟡ Market structure
Price previously advanced inside an ascending channel, but after peaking near the upper boundary, momentum faded and the market began to print a weaker lower-high sequence. The
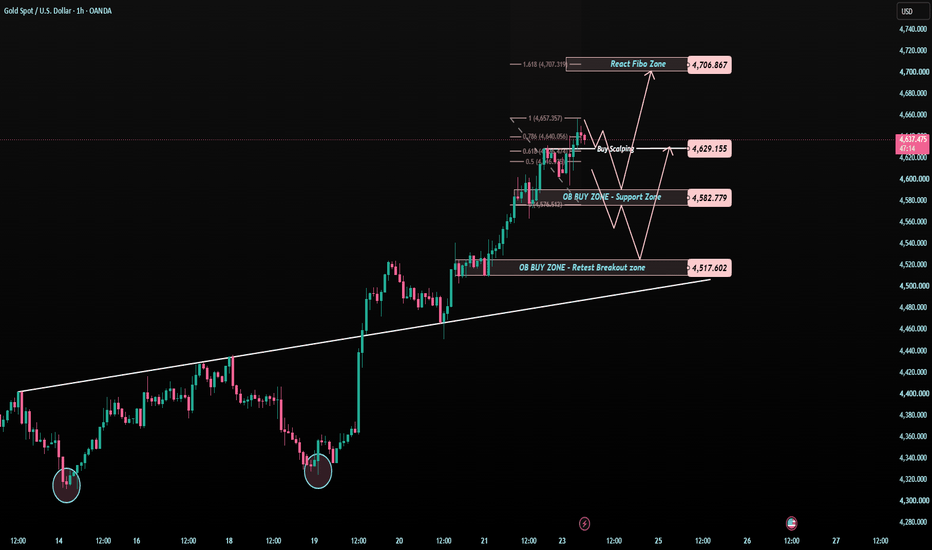
XAUUSD — 4,629 Holds, 4,706 Opens?Gold is still moving inside a strong bullish structure after the recent breakout and trendline recovery.
Price is now trading around 4,630, right near the short-term Buy Scalping reaction area.
This is where the chart becomes interesting.
The market is bullish, but after a strong push, I do not want to chase the candle blindly.
I want to see whether buyers can protect the support zones first.
The simple read
4,629 is the first important reaction zone today.
If gold holds above this area,
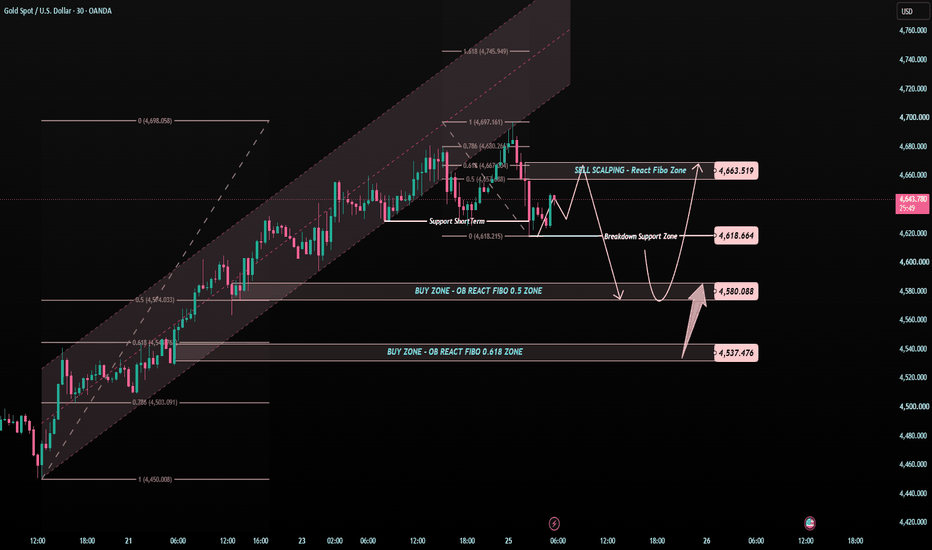
XAUUSD — 4,663 Retest or 4,580 Sweep?Gold is starting to lose the clean bullish rhythm after moving inside the rising channel.
Price is now trading around 4,630 and reacting near the short-term breakdown support zone.
This is a sensitive area.
The market can still bounce first, but the structure is no longer clean enough to chase buys emotionally.
The simple read
4,618 is the short-term breakdown support area.
If gold holds above this zone, price may create a recovery toward 4,663.
But 4,663 is the key Sell Scalping / React
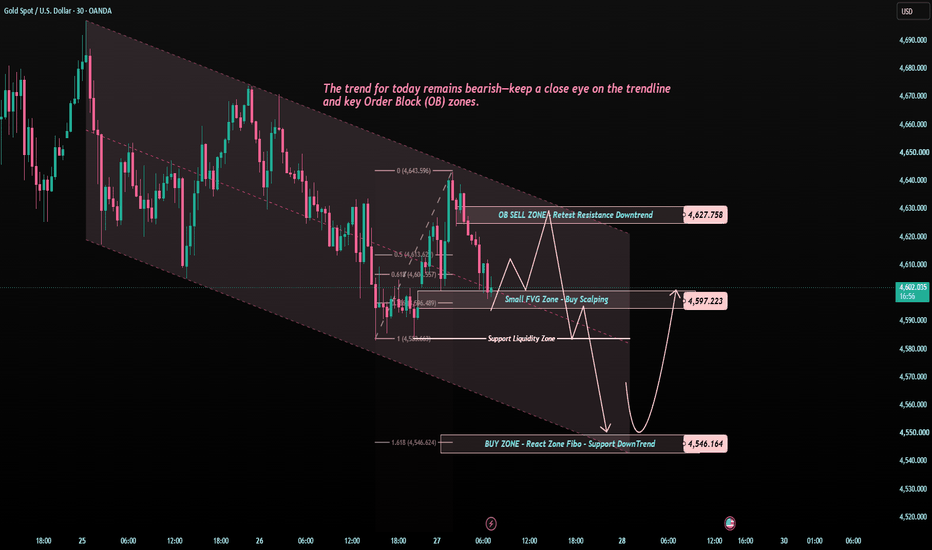
XAUUSD — The Market Is Testing the BreakdownGold is still moving with short-term bearish pressure.
After the recent drop, price is trying to pause around 4,597, but this area is not enough to confirm a bullish recovery yet.
For me, the current chart is simple:
Gold may bounce first.
But the bounce must prove itself.
The simple read
4,597 is the first zone to watch today.
If buyers defend this area, gold may recover toward 4,627.
But 4,627 is the important retest zone.
This area connects with the OB Sell Zone and the downtrend res
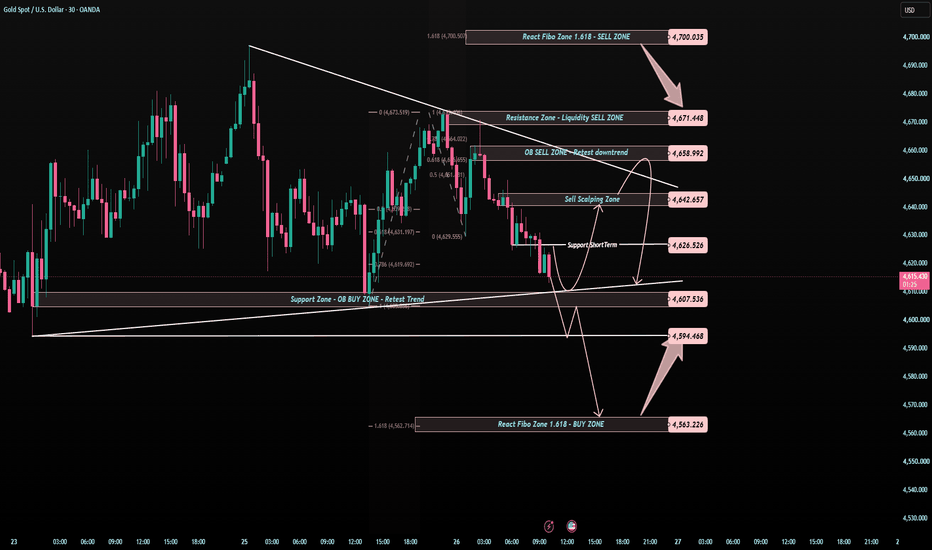
XAUUSD — 4,626 Lost, Now 4,607 Must AnswerGold is no longer holding the short-term support cleanly.
After rejecting from the upper sell structure, price has slipped below the 4,626 area and is now trading around 4,615 - 4,620.
This changes the short-term picture.
The market is still inside a larger structure, but buyers now need to prove themselves again from lower zones.
The simple read
4,626 was the first support.
Now that price is trading below it, this level can become a retest area.
If gold pulls back into 4,626 - 4,642 and
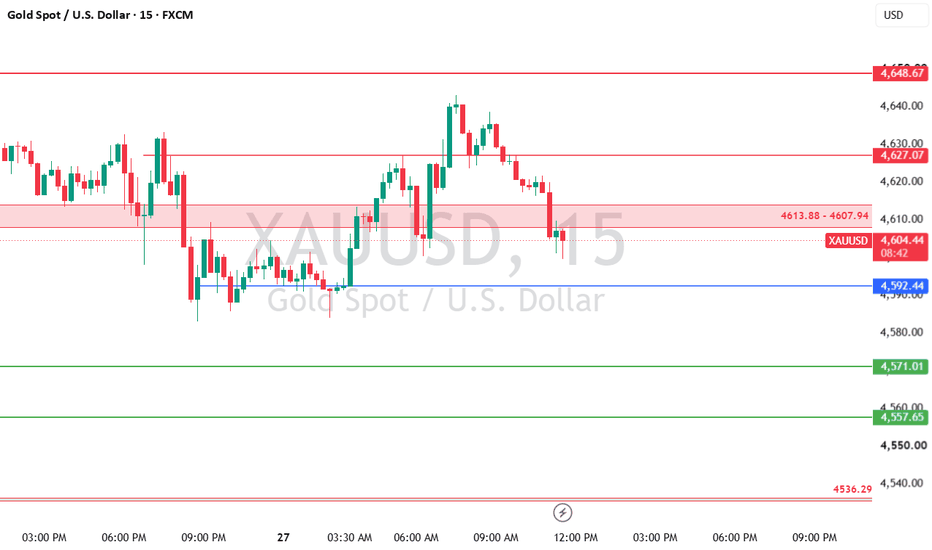
XAUUSD LEVELS INTRADAY | 27-08-2026Gold is trading around $4,604. The price is squeezed inside a shaded range ($4,607.94 – $4,613.88). Think of this range as neutral ground: buyers and sellers are competing for control, and a break out of this box will dictate the next big move.
Upside Targets (Resistance / Sellers' Territory)
If price breaks above the neutral zone, expect buyers to push higher toward these targets:
$4,613.88 – $4,627.07: Immediate resistance. A candle closing above $4,613 confirmation that buyers are stepping
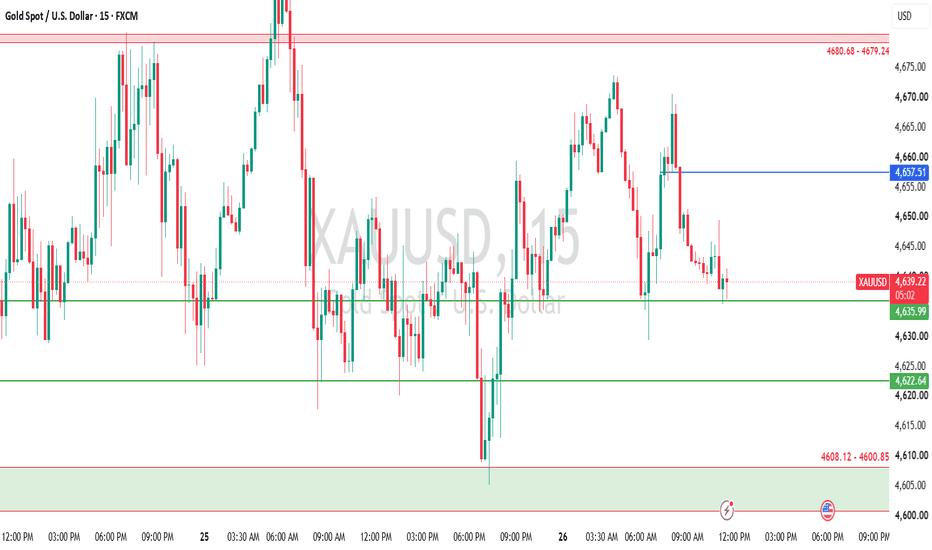
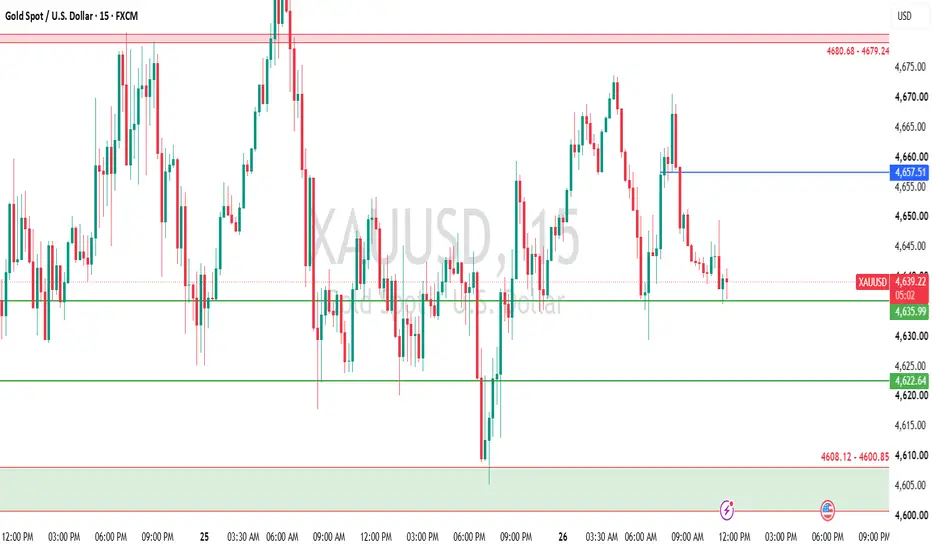
Gold Intraday Levels | 26 August 2026Gold (XAUUSD) is trading around 4638 today, and these are the key intraday levels generated by TheBullTargets Levels Technology.
🔴 Resistance Zone
• 4680.68 – 4679.24 — Major resistance zone
• 4657.51 — Immediate resistance / decision level
🟢 Support Levels
• 4635.99 — Immediate support
• 4622.64 — Next important support
• 4608.12 – 4600.85 — Major support zone
At the current price, 4635.99 is an important level to watch. Holding above it can keep the short-term structure stronger, while a decis
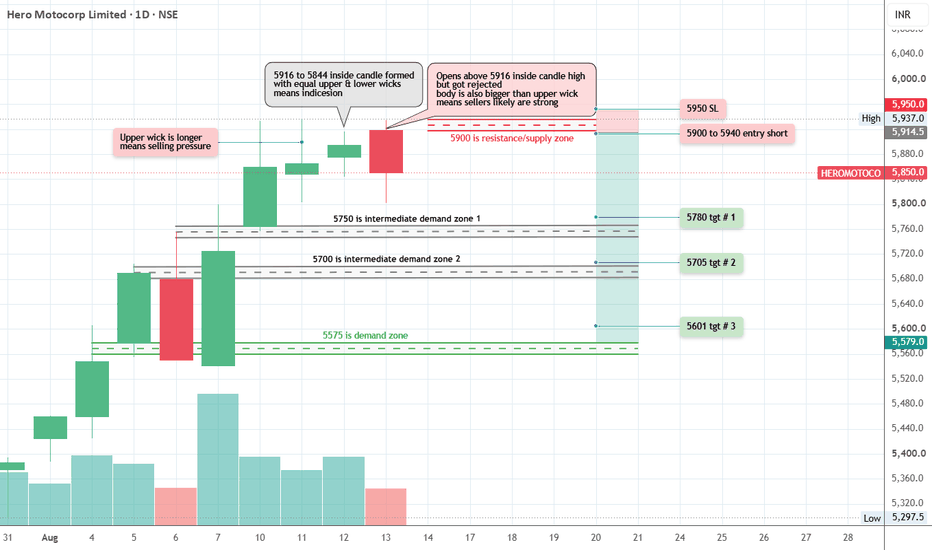
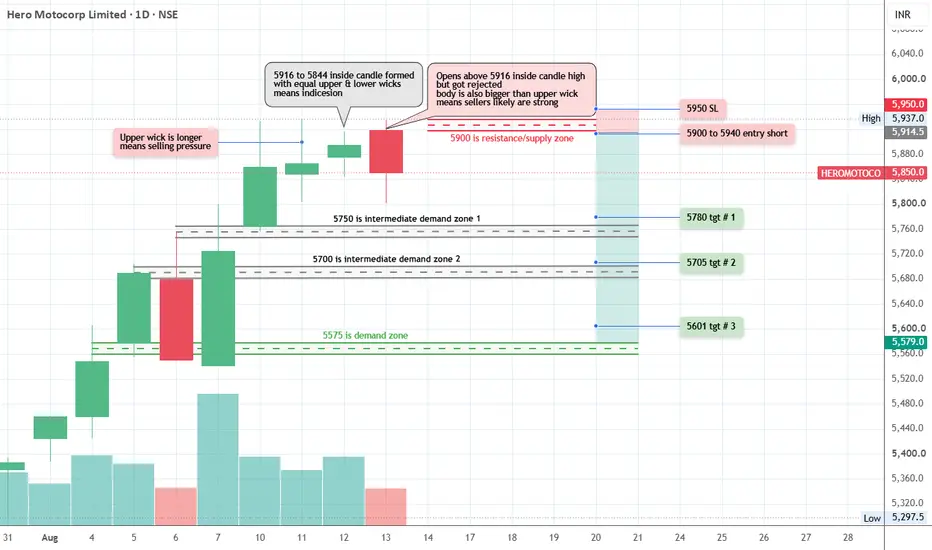
HeroMoto Price Action Analysis - Daily TF4 days of repeated attempts to cross 5900 seem to be getting rejected.
Upper wicks show 5900 levels as sellers area.
Last time we saw sell-off and immediate buying was near 5575 level.
The 5900 to 5600 can be seen with negative bias keeping SL at 5950.
Intermediate targets are 5750-5700 and final one is 5600
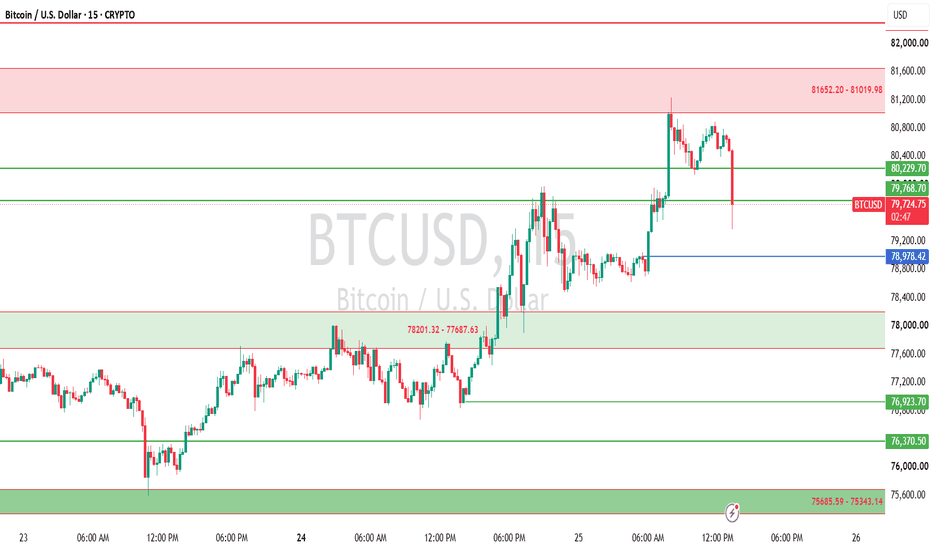
BTCUSD (15-Min Chart) — Supply & Demand Analysis |25 August 2026
BTCUSD is trading around 79,677, pulling back after a rejection from the top resistance. Overhead, Major Supply Zone (81,019.98 – 81,652.20) caps intermediate upside momentum, with immediate resistance sitting at 80,229.70. On the downside, price is testing key pivot support at 78,978.42, backed by Strong Demand Zone 1 (77,687.63 – 78,201.32), while deeper structural support lies at Major Demand Zone 2 (75,343.14 – 75,685.59).
For trade execution, bullish continuation setups look to buy pullba