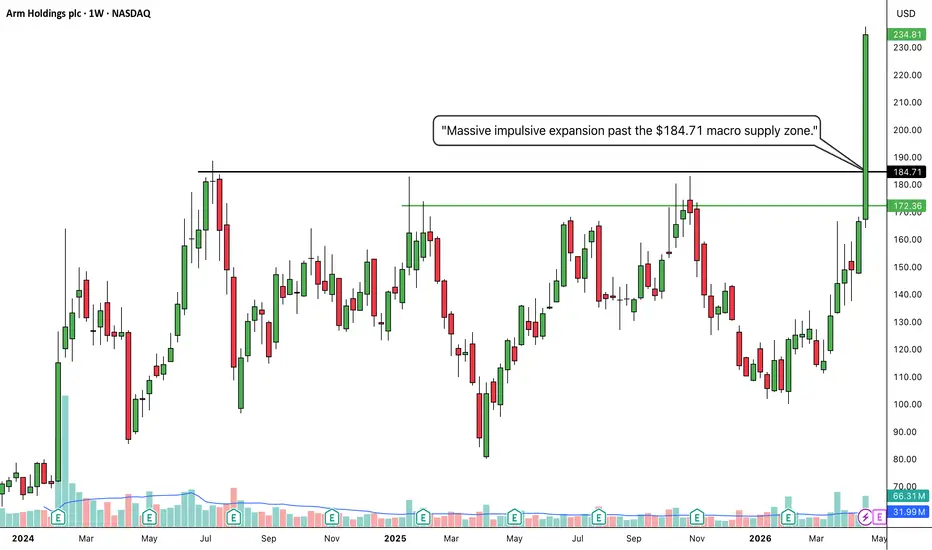
ARM: Explosive Structural Breakout From Multi-Month RangeThe Setup (Bias): I am taking a LONG bias on Arm Holdings plc (ARM) on the weekly timeframe.
The "Why" (Technical Reasons): 1. Major Range Breakout: After a massive, choppy consolidation period spanning back to mid-2024, the price has forcefully broken out of its range. It sliced cleanly through the heavy historical resistance ceiling at $184.71.
2. Extreme Bullish Momentum: The breakout is driven by a gigantic, full-bodied green weekly candle closing near its absolute highs. This type of impulsive, vertical price action indicates aggressive institutional buying and a complete absorption of any overhead supply.
Trade Plan (Entry & Exits): * Entry: Momentum traders can look for entries near the current extended market price of $234.81 to capture the aggressive surge. A safer, lower-risk approach would be waiting for the momentum to eventually cool off and placing limit orders to catch a potential pullback or retest of the $195.00 to $184.71 zone, letting the old ceiling prove itself as a new floor.
Take Profit (Target): With the stock breaking out into fresh blue skies with this much momentum, the next major psychological targets are $250.00, followed by $275.00.
Stop Loss: Placed safely below the green intermediate support line and the breakout origin, around $165.00. A weekly close back below the $184.71 structural level would be an early warning sign of a failed breakout.
Duration: Because this analysis is built on a 1-Week chart, this is a longer-term swing trade designed to play out over the coming weeks to months.  Long
Long
 Long
Long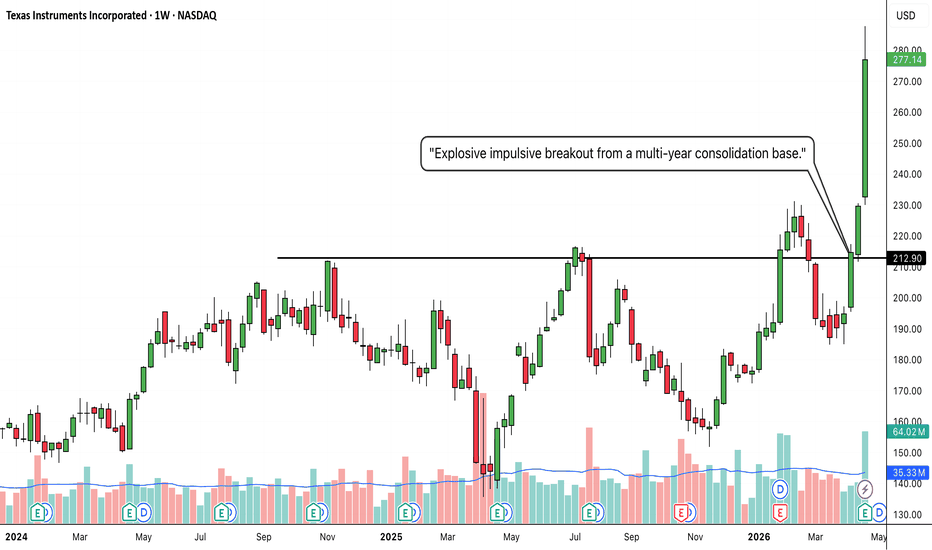
AMAT: Bullish Continuation and Decisive Breakout Above Key ResisThe Setup (Bias): I am taking a LONG bias on Applied Materials, Inc. (AMAT) on the weekly timeframe.
The "Why" (Technical Reasons): 1. Major Resistance Breakout: The price has forcefully broken out above the recent swing high, cleanly slicing through the established resistance level at $375.15 with a strong, full-bodied green weekly candle.
2. Textbook Stair-Step Trend: This breakout confirms a highly robust macro uptrend. Looking historically, the chart demonstrates a perfect pattern of breaking resistance levels and flipping them into solid support floors (as seen clearly at the $270.29 and $334.74 levels). This structural behavior indicates buyers are consistently in control.
Trade Plan (Entry & Exits): * Entry: Momentum traders can look for entries near the current market price of $417.04 to ride the immediate upside. A more conservative, lower-risk entry would involve placing limit orders to catch a potential pullback/retest of the $375.15 to $385.00 zone, waiting for that old ceiling to prove itself as a new floor.
Take Profit (Target): With the stock entering fresh price discovery and showing excellent relative strength, the next major psychological targets are $450.00, followed by the $500.00 milestone.
Stop Loss: Placed safely below the previous structural support step, around $325.00. A weekly close below the $334.74 base would indicate a breakdown in the current stair-step structure and invalidate the immediate bullish thesis.
Duration: Because this analysis is built on a 1-Week chart, this is a medium-to-longer-term swing trade designed to play out over the coming weeks to months.  Long
Long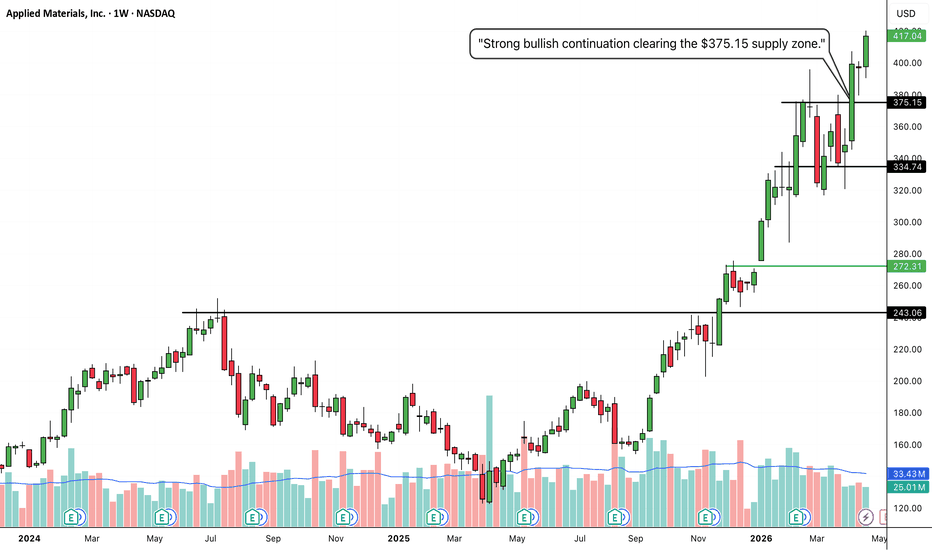
 Long
Long
NUE: Explosive Macro Breakout and Volatility ExpansionThe Setup (Bias): I am taking a LONG bias on Nucor Corporation (NUE) on the macro monthly (1M) timeframe.
The "Why" (Technical Reasons): 1. Historic Structural Breakout: Zooming out to the monthly timeframe reveals the true magnitude of this move. The price has forcefully broken out of a massive, multi-year consolidation base, cleanly slicing through the heavy macro resistance ceiling at 195.07 that has capped the stock for years.
2. Volatility Expansion: By applying Bollinger Bands, we can see a textbook volatility squeeze and subsequent expansion. The bands are opening up rapidly as the price rides the upper band, confirming that this breakout is backed by extreme momentum and aggressive institutional buying pressure.
Trade Plan (Entry & Exits): * Entry: Momentum and position traders can look for entries near the current extended market price of 225.11 to capture the aggressive phase transition. A safer, lower-risk approach would be waiting for the momentum to cool and placing limit orders to catch a potential monthly pullback to retest the 195.00 to 200.00 breakout zone, letting that old macro ceiling prove itself as a new floor.
Take Profit (Target): With the stock breaking out into fresh territory with this much monthly momentum, the trend can carry it significantly higher. The next major psychological targets are the 250.00 milestone, followed by 300.00.
Stop Loss: Placed safely below the middle of the recent monthly consolidation block, around the 160.00 level. A monthly close back below the 195.07 structural level would be an early warning sign of a failed macro breakout.
Duration: Because this analysis is built on a massive 1-Month chart capturing a macro trend continuation, this is a long-term position trade designed to play out over the coming months to years.  Long
Long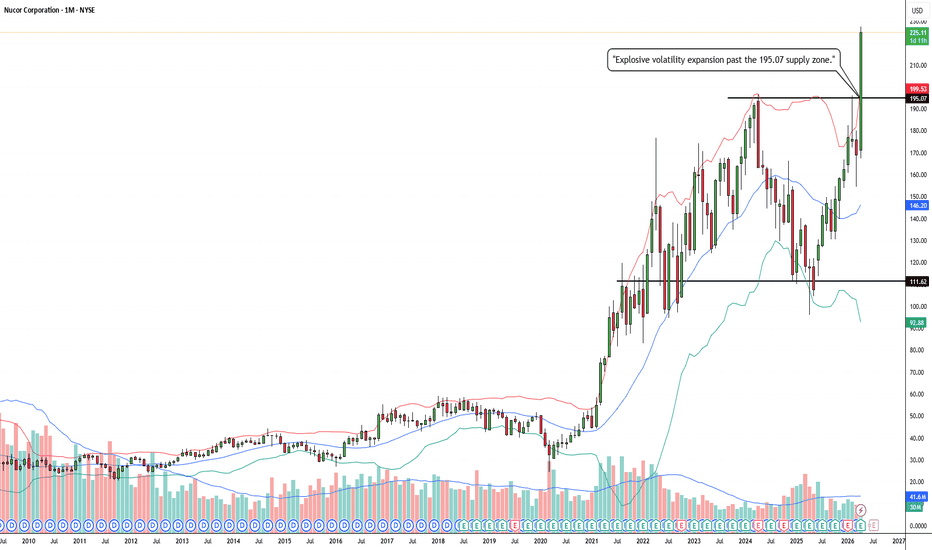
 Long
Long
ENLT: Explosive High-Tight Flag Breakout and Bullish ContinuatioThe Setup (Bias): I am taking a LONG bias on Enlight Renewable Energy Ltd. (ENLT) on the weekly timeframe.
The "Why" (Technical Reasons): 1. High-Tight Flag Breakout: After a truly historic, multi-month run originating from a massive base at 19.77, the stock entered a very healthy, tight consolidation phase. Instead of experiencing a deep correction, buyers defended the price at high levels, forming a "High Tight Flag." The price has now violently broken out above the 79.30 resistance ceiling of this flag, signaling that the next massive leg up has begun.
2. Bollinger Band Volatility Expansion: By looking at the Bollinger Bands, we can see the bands pinched tight during the recent consolidation. With this week's explosive green candle pushing the upper band outward again, we have clear confirmation of a volatility expansion. Momentum is back, and institutional buyers are aggressively stepping up.
Trade Plan (Entry & Exits): * Entry: Momentum traders can look for entries near the current extended market price around 88.78 to capture the immediate velocity of the breakout. A safer, lower-risk approach would be waiting for a potential minor pullback on a lower timeframe to retest the 79.30 to 82.00 zone, letting the old flag ceiling act as a new launchpad.
Take Profit (Target): With the stock breaking out of a high-level continuation pattern with this much relative strength, the immediate target is the major 100.00 psychological milestone. If momentum sustains, 110.00 to 120.00 is next.
Stop Loss: Placed safely below the bottom of the flag consolidation, around the 68.00 to 70.00 level. A weekly close back below the 79.30 structural level would be a warning sign that the breakout is stalling.
Duration: Because this analysis is built on a 1-Week chart capturing a high-momentum trend continuation, this is a medium-term swing trade designed to play out over the coming weeks.  Long
Long
 Long
Long
DLR: Impulsive Structural Breakout from Long-Term ConsolidationThe Setup (Bias): I am taking a LONG bias on Digital Realty Trust, Inc. (DLR) on the weekly timeframe.
The "Why" (Technical Reasons): 1. Major Range Breakout: After months of choppy consolidation, the price has forcefully broken out of its trading range, slicing through the heavy structural resistance at $187.77.
2. Extreme Bullish Momentum: The breakout candle is a massive, full-bodied weekly green candle closing near its absolute high. This indicates immense buyer demand and a complete lack of selling pressure at these new levels.
Trade Plan (Entry & Exits): 1. Entry: Momentum traders can enter near the current market price of $199.98. A more conservative, lower-risk entry would be placing limit orders to catch a potential retest of the $187.77 level, looking for that old resistance to act as new support.
2. Take Profit (Target): With the stock breaking into fresh territory, the next logical psychological targets are $220.00, followed by $230.00.
3. Stop Loss: Placed safely below the intermediate support level and breakout origin, around $175.00. A weekly close below this level would indicate a false breakout and invalidate the setup.
Duration: Because this analysis is built on a 1-Week chart, this is a longer-term swing trade designed to play out over the coming weeks to months.  Long
Long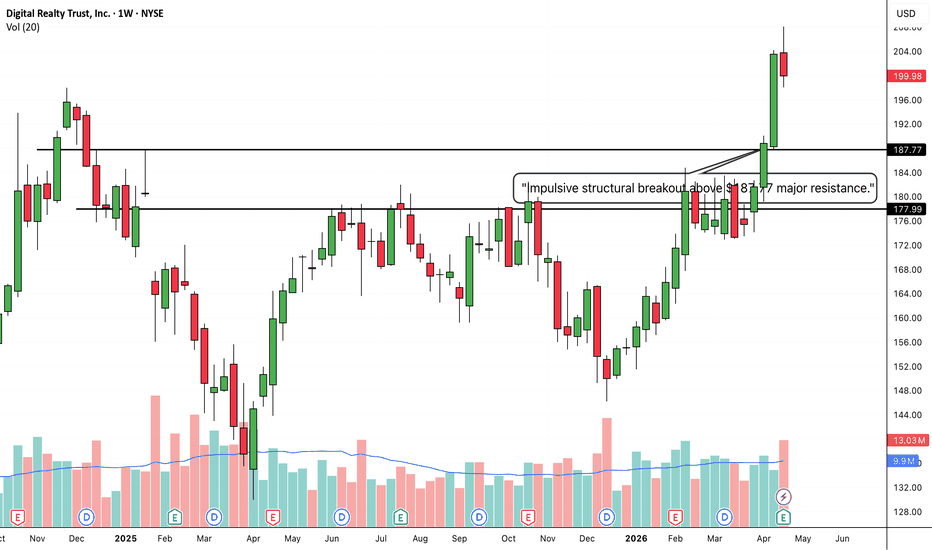
CSX: Stepping Up – Major Resistance Cleared for Trend ContinuatiThe Setup (Bias): I am taking a LONG bias on CSX Corporation (CSX) on the weekly timeframe.
The "Why" (Technical Reasons): 1. Secondary Breakout: The price has cleanly broken through the recent swing-high resistance at $43.11 with a strong, full-bodied weekly candle, indicating aggressive buyer momentum.
2. Textbook S/R Flip: Before this latest push, we saw the price break above the long-term historical resistance at $38.15, pull back to retest it, and bounce perfectly. That prior ceiling is now a confirmed floor, validating the structural strength of this uptrend.
Trade Plan (Entry & Exits): * Entry: Entering near the current market price of $45.41. A more conservative entry would be waiting for a minor daily pullback to retest the $43.11 level as new support.
Take Profit (Target): Riding the momentum into new territory, the next logical psychological targets are $50.00, followed by $55.00.
Stop Loss: Placed below the recent swing low and the previous breakout zone, around $39.50. If the price breaks back below the $40 psychological level, the current upward structure is broken.
Duration: Because this analysis is built on a 1-Week chart, this is a longer-term swing trade designed to play out over the coming weeks to a few months.  Long
Long
 Long
Long
ANET: Explosive Macro Breakout and High-Tight Flag Formation1. The Macro Perspective: Conquering the Ceiling
I am taking a LONG bias on Arista Networks, Inc. (ANET) on the daily (1D) timeframe.
When analyzing pure market structure, we have to respect major historical pivot points. Look at the black horizontal line at 160.91. Earlier in the chart, this level acted as a massive brick wall, aggressively rejecting the price and sending the stock into a deep, multi-month washout. However, the stock eventually found its footing, formed a series of higher lows, and methodically grinded its way right back up to the "scene of the crime."
2. The Educational Setup: The Power of the Breakout Candle
To understand why this setup is so bullish, look at how the price reacted when it finally reached 160.91 again:
No Hesitation: Often, stocks will form a "handle" or consolidate directly under major resistance before breaking out. ANET didn't even pause. It sliced through the 160.91 macro ceiling with a massive, full-bodied green expansion candle.
The Vacuum: When a stock breaks a major historical level with that kind of velocity, it triggers a massive short squeeze and forces sidelined institutional buyers to chase the price, creating a vacuum of upward momentum.
3. Current Price Action: The High-Tight Flag
Look at the most recent price action on the far right, currently trading near 172.62. After a massive explosive move, you expect profit-taking. However, instead of pulling all the way back to the 160.91 line, the stock is refusing to give up its gains. It is chopping sideways in a very tight, controlled range right at the absolute highs. This is a "High Tight Flag." It shows that buyers are happily absorbing any selling pressure at premium prices, storing kinetic energy for the next leg up.
4. The Trade Plan: Entries, Targets, and Risk Management
Entry Strategy: Momentum traders can look for an entry on a decisive daily close above the current tight flag consolidation (roughly above 175.00) to catch the immediate continuation. A safer, secondary strategy would be to place limit orders lower down, just in case the flag breaks downward to execute a standard "break and retest" of the 160.91 support floor.
Take Profit (Targets): Because the stock has shattered its macro resistance and is entering pure price discovery (blue sky territory), there is no historical supply to slow it down. The immediate psychological and measured targets are the 185.00 and 200.00 macro levels.
Invalidation (Stop Loss): A trade thesis is only valid if the market structure holds. For an entry on the flag breakout, a tight stop loss can be placed just below the flag's lower boundary (around 165.00). The ultimate invalidation for the macro thesis would be a definitive daily close completely back below the 160.91 line, which would signal a severe bull trap.
5. Time Horizon:
Because this technical setup is built on a 1-Day chart capturing a high-momentum breakout and flag consolidation, this is a short-to-medium-term swing trade designed to capture the immediate institutional markup phase. Let the trend run!  Long
Long
 Long
Long
 Long
Long
 Long
Long
NAM_INDIA: The Macro Staircase and Explosive Blue Sky Breakout1. The Macro Perspective: The Deep Washout and Recovery
I am taking a LONG bias on Nippon Life India Asset Management Ltd. (NAM_INDIA) on the weekly (1W) timeframe.
When analyzing pure market structure in a strong macro environment, patience reveals the absolute highest probability setups. Look at the massive structural development on the left side of this chart. After a deep, highly volatile markdown phase that successfully washed out all the weak hands, the stock initiated a methodical process of accumulation. It carved out a massive V-shaped recovery and systematically started grinding its way up the chart, establishing a major concrete floor at the 783.70 level.
2. The Educational Setup: Conquering the Stepping Stones
To understand the sheer strength of this current breakout, look at how the price systematically dismantled historical resistance on the right side of the curve by building a "Staircase":
The Break & Retest: After establishing the 783.70 floor, the stock rallied into the 973.30 zone. Notice how it didn't just run away. It pulled back, formed a higher low right at the dashed 908.60 pivot line, and used that as a launchpad.
The High-Level Base: Once it cleared 973.30, the stock built a "Step-Up Base." It used the 973.30 line as its new concrete foundation and consolidated tightly directly underneath the new 1,057.95 resistance level. This high-level chop acts like a pressure cooker, transferring shares to strong-handed institutional buyers and storing immense kinetic energy before the next explosive move.
3. Current Price Action: Blue Sky Territory
Look at the most recent weekly candle on the far right. The pressure cooker has exploded. Buyers have effortlessly shattered the 1,057.95 macro resistance, printing a massive, full-bodied green expansion candle and surging past 1,100. By clearing this final accumulation zone, NAM_INDIA has officially entered "Blue Sky Territory" (pure price discovery). There is absolutely zero historical overhead supply left. Every single investor who has bought and held this stock is now in profit, meaning natural selling pressure evaporates.
4. The Trade Plan: Entries, Targets, and Risk Management
Entry Strategy: Momentum is exceptionally strong right now near 1,103.40. Chasing a massive weekly expansion candle always carries a higher risk of an immediate intraday drawdown. The highest-probability, lowest-risk entry involves stepping down to a daily timeframe and placing limit orders to catch a potential minor structural pullback to retest the 1,050.00 to 1,060.00 breakout zone. Letting that newly broken ceiling prove itself as a new, indestructible support floor offers a phenomenal risk-to-reward ratio.
Take Profit (Targets): Because the stock is in pure price discovery, we use measured structural targets. By taking the depth of the recent step-up base (roughly 85 points from the 973.30 floor to the 1,057.95 ceiling) and projecting it upward from the breakout line, our immediate structural target sits comfortably in the 1,140.00 to 1,150.00 zone. A larger macro target based on the deeper 783.70 base points toward 1,300.00+.
Invalidation (Stop Loss): A trade thesis is only valid if the new market structure holds. A hard stop loss should be placed safely below the recent stepping stone and consolidation floor, around the 950.00 to 970.00 level. A definitive weekly close completely back below the 973.30 line would act as an early warning sign of a failed macro breakout and severe structural weakness.
5. Time Horizon:
Because this technical setup is built on a 1-Week chart capturing a massive structural completion into fresh price discovery, this is a medium-to-longer-term position trade designed to play out over the coming weeks to months. Let the macro trend run!  Long
Long
 Long
Long
Why “Buy Low, Sell High” Fails So Many Traders“Buy low, sell high” sounds like the simplest rule in trading.
Buy when the price is low. Sell when the price is high.
But in real markets, this idea often causes traders to buy too early in a downtrend and sell too early in an uptrend.
1. “Low” and “High” Are Always Relative
A price that looks very low today can still fall much further if the bearish structure remains intact.
On the other hand, a price that looks extremely high can continue rising if the trend remains strong.
A low price is not automatically a Buy opportunity. A high price is not automatically a Sell signal.
The more important question is:
Where is price within the current market structure?
2. Traders Often Buy When the Market Is at Its Weakest
After a sharp decline, price suddenly looks “cheap.”
This is when many traders start trying to catch the bottom simply because they think:
“It has already fallen too much.”
But if the market is still forming Lower Highs + Lower Lows , support keeps breaking, and selling pressure has not weakened, you are not necessarily “buying low.”
You may simply be buying into a downtrend that is not over yet.
3. “Sell High” Can Make You Exit Too Early
The opposite mistake happens when traders see price rally strongly and immediately want to sell because the market looks “too high.”
But in a healthy uptrend, Higher Highs and Higher Lows can continue for much longer than expected.
Don’t sell just because price looks high. Sell when the structure starts giving you a reason to exit.
4. Location Matters More Than the Absolute Price
Instead of asking:
“Is the price low enough yet?”
Ask:
Is price at support or in the middle of a range?
Is the broader trend bullish or bearish?
Has price action provided confirmation?
If I’m wrong, where is my invalidation?
A “cheap” price without structural support can always become cheaper.
5. A Better Approach Than Buy Low – Sell High
A more practical way to think about the market is:
Buy strength after weakness has failed.
Sell weakness after strength has failed.
In simple terms:
Don’t try to predict the bottom.
Don’t try to call the top.
Wait for the market to prove that control has shifted from one side to the other.  Education
Long 
Before You Buy the Dip, Check This“Buy the dip” sounds simple: price drops, you buy at a lower price, and wait for the market to recover.
But there is one major problem:
Not every drop is a pullback. Sometimes, you are buying just as the trend is beginning to change.
1. Dip or Breakdown?
In a healthy uptrend, pullbacks are normal as long as the broader structure remains intact. Price corrects, buyers step back in, and the market continues to maintain Higher Highs and Higher Lows .
But if key support breaks and price begins forming Lower Highs and Lower Lows , the story has changed.
A lower price does not automatically mean a better opportunity.
2. Look at Where Price Is Pulling Back To
A dip into support, a previous breakout zone, or an important structural level is more meaningful than buying simply because price has fallen 5% or 10%.
The important question is not how far price has dropped.
It is:
“Are buyers actually stepping back in at this level?”
3. Don’t Catch a Falling Knife Just Because It’s Falling
One small green candle after a sharp decline is not necessarily confirmation.
Watch whether price can hold support, reclaim a lost level, or begin rebuilding bullish structure.
Location gives you an area to watch. Price action gives you a reason to act.
4. Always Know When Your Idea Is Wrong
Before you buy the dip, define what would invalidate your bullish thesis.
If price continues breaking structure and you keep buying simply because “it’s even cheaper now,” buying the dip can quickly turn into averaging down in a downtrend .
Before You Buy the Dip, Check This
Is the broader trend still bullish?
Is key support still holding?
Has price action confirmed that buyers are returning?
If you’re wrong, where is the invalidation?
Don’t buy the dip just because price has fallen. Buy when the decline is still part of a structure that gives you a clear reason to believe buyers remain in control.  Education
H2 Bullish Recovery From Major Demand
XAUUSD is trading around 4,349 after another volatile session around the lower H2 structure. Price remains inside a broader descending channel, but the current location is close to a major demand cluster where a recovery setup may begin to develop.
The macro backdrop remains challenging for gold. U.S. August CPI rose 0.4% MoM and 3.4% YoY, while core CPI increased 0.3% MoM and 2.4% YoY. Markets now price roughly an 85% probability of a Fed rate hike next week, keeping pressure on non-yielding gold. However, the U.S. 10-year yield eased back toward 4.93% after nearly touching 5%, providing some short-term relief.
Technical View
The broader structure remains below the descending channel resistance, so the recovery is not confirmed yet.
Price is currently holding around the 4,335–4,360 Demand / Reclaim Zone. This area may support a short-term bounce, but the cleaner bullish location remains lower at the 4,275–4,300 Major Demand / Bullish OB.
A liquidity sweep into that major demand followed by a strong reclaim, bullish MSS or higher-low confirmation would support the recovery path shown on the chart.
The first upside obstacle is 4,385–4,405 Resistance / Bearish OB. Acceptance above this area would strengthen the recovery and expose the larger 4,475–4,490 Major Resistance / Supply zone.
Key Zones
Current Price: 4,349.420
Demand / Reclaim Zone: 4,335–4,360
Buy Priority: 4,275–4,300
Resistance / Bearish OB: 4,385–4,405
Major Resistance / Supply: 4,475–4,490
Trading Plan
Buy Priority: 4,275–4,300
Condition: wait for a liquidity sweep into Major Demand followed by bullish rejection, reclaim, MSS or clear higher-low confirmation.
TP1: 4,335–4,360
TP2: 4,385–4,405
TP3: 4,475–4,490
Invalidation: sustained acceptance below 4,275.
Buy/Sell View
The preferred setup is to wait for a deeper pullback into Major Demand rather than chase the current bounce.
Shorts also become less attractive near 4,300 because price would already be entering a major bullish OB. The cleaner decision is to let demand confirm whether buyers can absorb the remaining sell-side pressure.
Important Note
Inflation remains the main macro risk. With CPI and PPI both firm, Fed tightening expectations remain elevated, while oil above $100 continues to reinforce inflation concerns. Any renewed rise in Treasury yields could pressure gold again.
Final View
Gold remains structurally weak, but 4,275–4,300 is the key H2 area where the risk/reward begins to shift toward a recovery setup.
My main scenario is a liquidity sweep into Major Demand followed by bullish confirmation, targeting 4,385–4,405 first and potentially 4,475–4,490 if the recovery strengthens.
Will gold sweep Major Demand before starting the next H2 recovery? Long 
Education 
XAUUSD: Sellers Reject the Recovery — Is 4,280 the Next Target?After a short-term rebound, XAUUSD is showing renewed weakness as price struggles below the descending trendline and the Ichimoku resistance area. The recovery toward 4,430–4,440 has so far failed to change the broader bearish structure, keeping sellers in control.
In terms of news, gold is under pressure as rising oil prices revive inflation concerns, while strong U.S. employment data has increased expectations that the Federal Reserve could raise rates again. Markets are currently pricing roughly a 60% probability of a Fed rate hike, making upcoming U.S. inflation data especially important. Higher rate expectations remain a headwind for non-yielding gold, even though a softer U.S. dollar is providing some support.
Looking at the H3 chart, the technical structure also supports a bearish scenario:
Price has been repeatedly rejected from the descending trendline.
The 4,425–4,440 area overlaps with trendline resistance and the upper Ichimoku zone.
Price is now trading around 4,393, showing that the latest rebound has already lost momentum.
The 4,360–4,385 zone is the nearest support. A decisive break below this area could accelerate selling pressure toward the lower demand zone.
📉 Main Scenario
Resistance: 4,425–4,440
Support: 4,360–4,385
Target: 4,280–4,300
As long as XAUUSD remains below the descending trendline and fails to reclaim 4,440, I continue to favor the bearish scenario. A breakdown below 4,360 would strengthen the case for another move toward 4,280–4,300. Short